


 本文介绍了如何使用Python的nlinfit函数拟合三阶Selmiere方程来描述波长与折射率的关系。通过提供的水的折射率数据,实现了方程参数的计算,并展示了拟合结果与原始数据的对比,同时给出了拟合残差。代码中包含了数据读取、拟合过程和结果输出,方便进行多组数据的处理。
一、前言
对于已测量出的 波长-折射率 数据,我们希望找到一个方程来拟合它,这里我们采用三阶 selmier 方程,其形式如下:
n ( x ) = 1 + B 1 x 2 x 2 − C 1 2 + B 2 x 2 x 2 − C 2 2 + B 3 x 2 x 2 − C 3 2 n(x) = \sqrt{1 + \dfrac{B_1x^2}{x^2-C_1^2} + \dfrac{B_2x^2}{x^2-C_2^2} + \dfrac{B_3x^2}{x^2-C_3^2}} n(x)=1+x2−C12B1x2+x2−C22B2x2+x2−C32B3x2
我们利用已知的波长数据(Wavelength)与折射率数据(Refractive Index)去拟合方程中的 B1, C1, B2, C2, B3, C3 等参数。
二、数据处理
我们有一段关于水的折射率与入射光波长的关系数据:
| Wavelength(x) | RefractiveIndex(n) |
|---|---|
| 0.5 | 1.335 |
| 0.6 | 1.3321 |
| 0.7 | 1.3311 |
| 0.8 | 1.329 |
| 0.9 | 1.3281 |
| 1 | 1.3272 |
| 1.1 | 1.3255 |
| 1.2 | 1.3244 |
| 1.3 | 1.3225 |
| 1.4 | 1.3213 |
| 1.5 | 1.319 |
将其保存在 Water.txt 文档内,与我们接下来的 Python 文件放在同一个目录下。
三、Python代码
计算折射率的 selmier 方程代码如下:
def selmier(L, B1, C1, B2, C2, B3, C3):
    offset = 1
    # L = x ** 2
    ssum = B1 * L / (L - C1 ** 2) + B2 * L / (L - C2 ** 2) + B3 * L / (L - C3 ** 2)
    nn = offset + ssum
    return nn
拟合采用的是 pycse 包中的 nlinfit 函数,其用法和 MATLAB 类似,拟合代码如下:
pars, pint, se = nlinfit(selmier, Lambda ** 2, n ** 2, coeffs, 0.05)
注意这里的 coeffs 为我们给定的初始参数值,这里我初始参数(B1, C1, B2, C2, B3, C3)全部设为 0.1。完整代码如下:
#!/usr/bin/env python3
# -*- coding: utf-8 -*-
"""
Created on Wed Mar 30 19:38:56 2022
@author: zq
"""

import numpy as np
import matplotlib.pyplot as plt
from pycse import nlinfit

def selmier(L, B1, C1, B2, C2, B3, C3):
    offset = 1
    # L = x ** 2
    ssum = B1 * L / (L - C1 ** 2) + B2 * L / (L - C2 ** 2) + B3 * L / (L - C3 ** 2)
    nn = offset + ssum
    return nn

def Welcome():
    w = """
===================================================\n
Created on Wed Mar 30 19:38:56 2022

\tThe fit function is Show in README.txt.

\tThis code can solve this problem, but the requirements for the initial predicted value are relatively high. It is recommended that you use a matlab code.

\tYou can contact me to obtain a copy of matlab code.

\t\tEmail: z.q.feng@qq.com\n
\t\t\tor\n
\t\tBlog: https://blog.csdn.net/weixin_46584887?spm=1010.2135.3001.5343

\tOf course if you know how to use matlab...

@author: z.q.feng\n
===================================================
        """
    print(w, end = '')

if __name__ == '__main__':
    Welcome()
    # coeffs = np.loadtxt('settings.txt')
    coeffs = np.array([0.1, 0.1, 0.1, 0.1, 0.1, 0.1])
    if len(coeffs) != 6:
        raise ValueError("The coefficients' number that noticed in the settings must be equal to 6 !")

    while (True):
        file = input("\nPlease enter the datas' filename(without .txt) : ")
        tmp = np.loadtxt(file + '.txt')
        Lambda, n = tmp[:, 0], tmp[:, 1]

        try:
            pars, pint, se = nlinfit(selmier, Lambda ** 2, n ** 2, coeffs, 0.05)
        except RuntimeError:
            print('\n\tOptimal parameters not found.\n\tPlease change the coefficients in settings...\n')
            break

        nn = selmier(Lambda ** 2, pars[0], pars[1], pars[2], pars[3], pars[4], pars[5]) ** 0.5
        tmp = np.linalg.norm(n - nn, 2)
        print('\n\tSuccessfully create coeffs-' + file + '.txt and fit-' + file + '.png.')
        print('\n\tThe recovery residual is %.6f.' % (tmp))

        with open("coeffs-" + file + ".txt", 'w') as f:
            f.write('\t' + file + '\n')
            for i in range(len(pars)):
                if i % 2 == 0:
                    f.write('B' + str(i // 2 + 1) + '\t' + str(pars[i]) + '\n')
                else:
                    f.write('C' + str(i // 2 + 1) + '\t' + str(pars[i]) + '\n')

        plt.figure(figsize = (8, 6))
        plt.plot(Lambda, n, 'r-', label = 'Original')
        plt.plot(Lambda, nn, 'b--', label = 'Fit')
        plt.xlabel('Wave length')
        plt.ylabel('Refractive index')
        plt.title('Original-curve vs. Fit-curve')
        plt.grid()
        plt.legend()
        plt.savefig("fit-" + file + ".png", dpi = 300)

        q = input("\nQuit ? (y / n) : ")
        if q == 'y':
            break
        else:
            continue
四、使用及其说明
运行上述代码,运行界面如下:
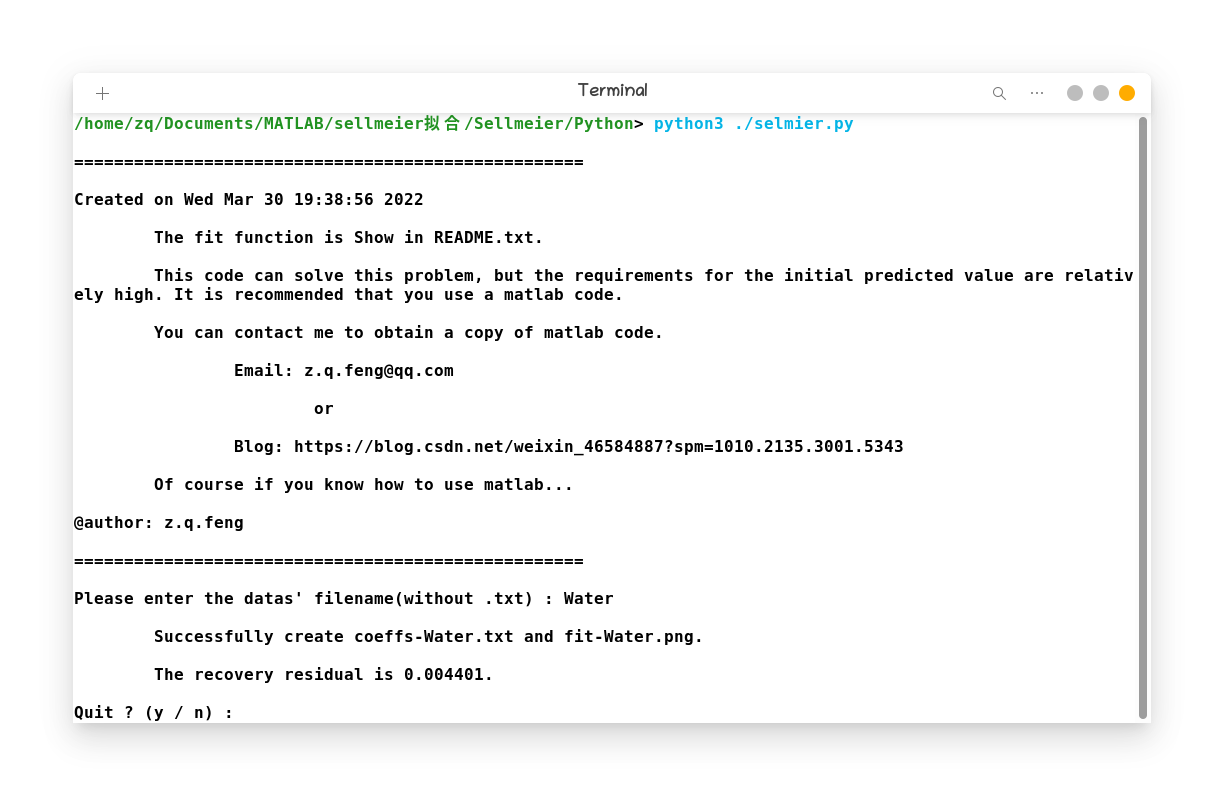
这里我们输入的为我们的 Water.txt 文件的文件名,可循环输入多个拟合多组数据。输出有两个:coeff-Water.txt 和 fit-Water.png。
coeff-Water.txt:
	Water
B1	7.876519563674877
C1	0.2569073177409549
B2	7.874100532538284
C2	0.25690470607109844
B3	-15.01175094249148
C3	0.2607512075672549
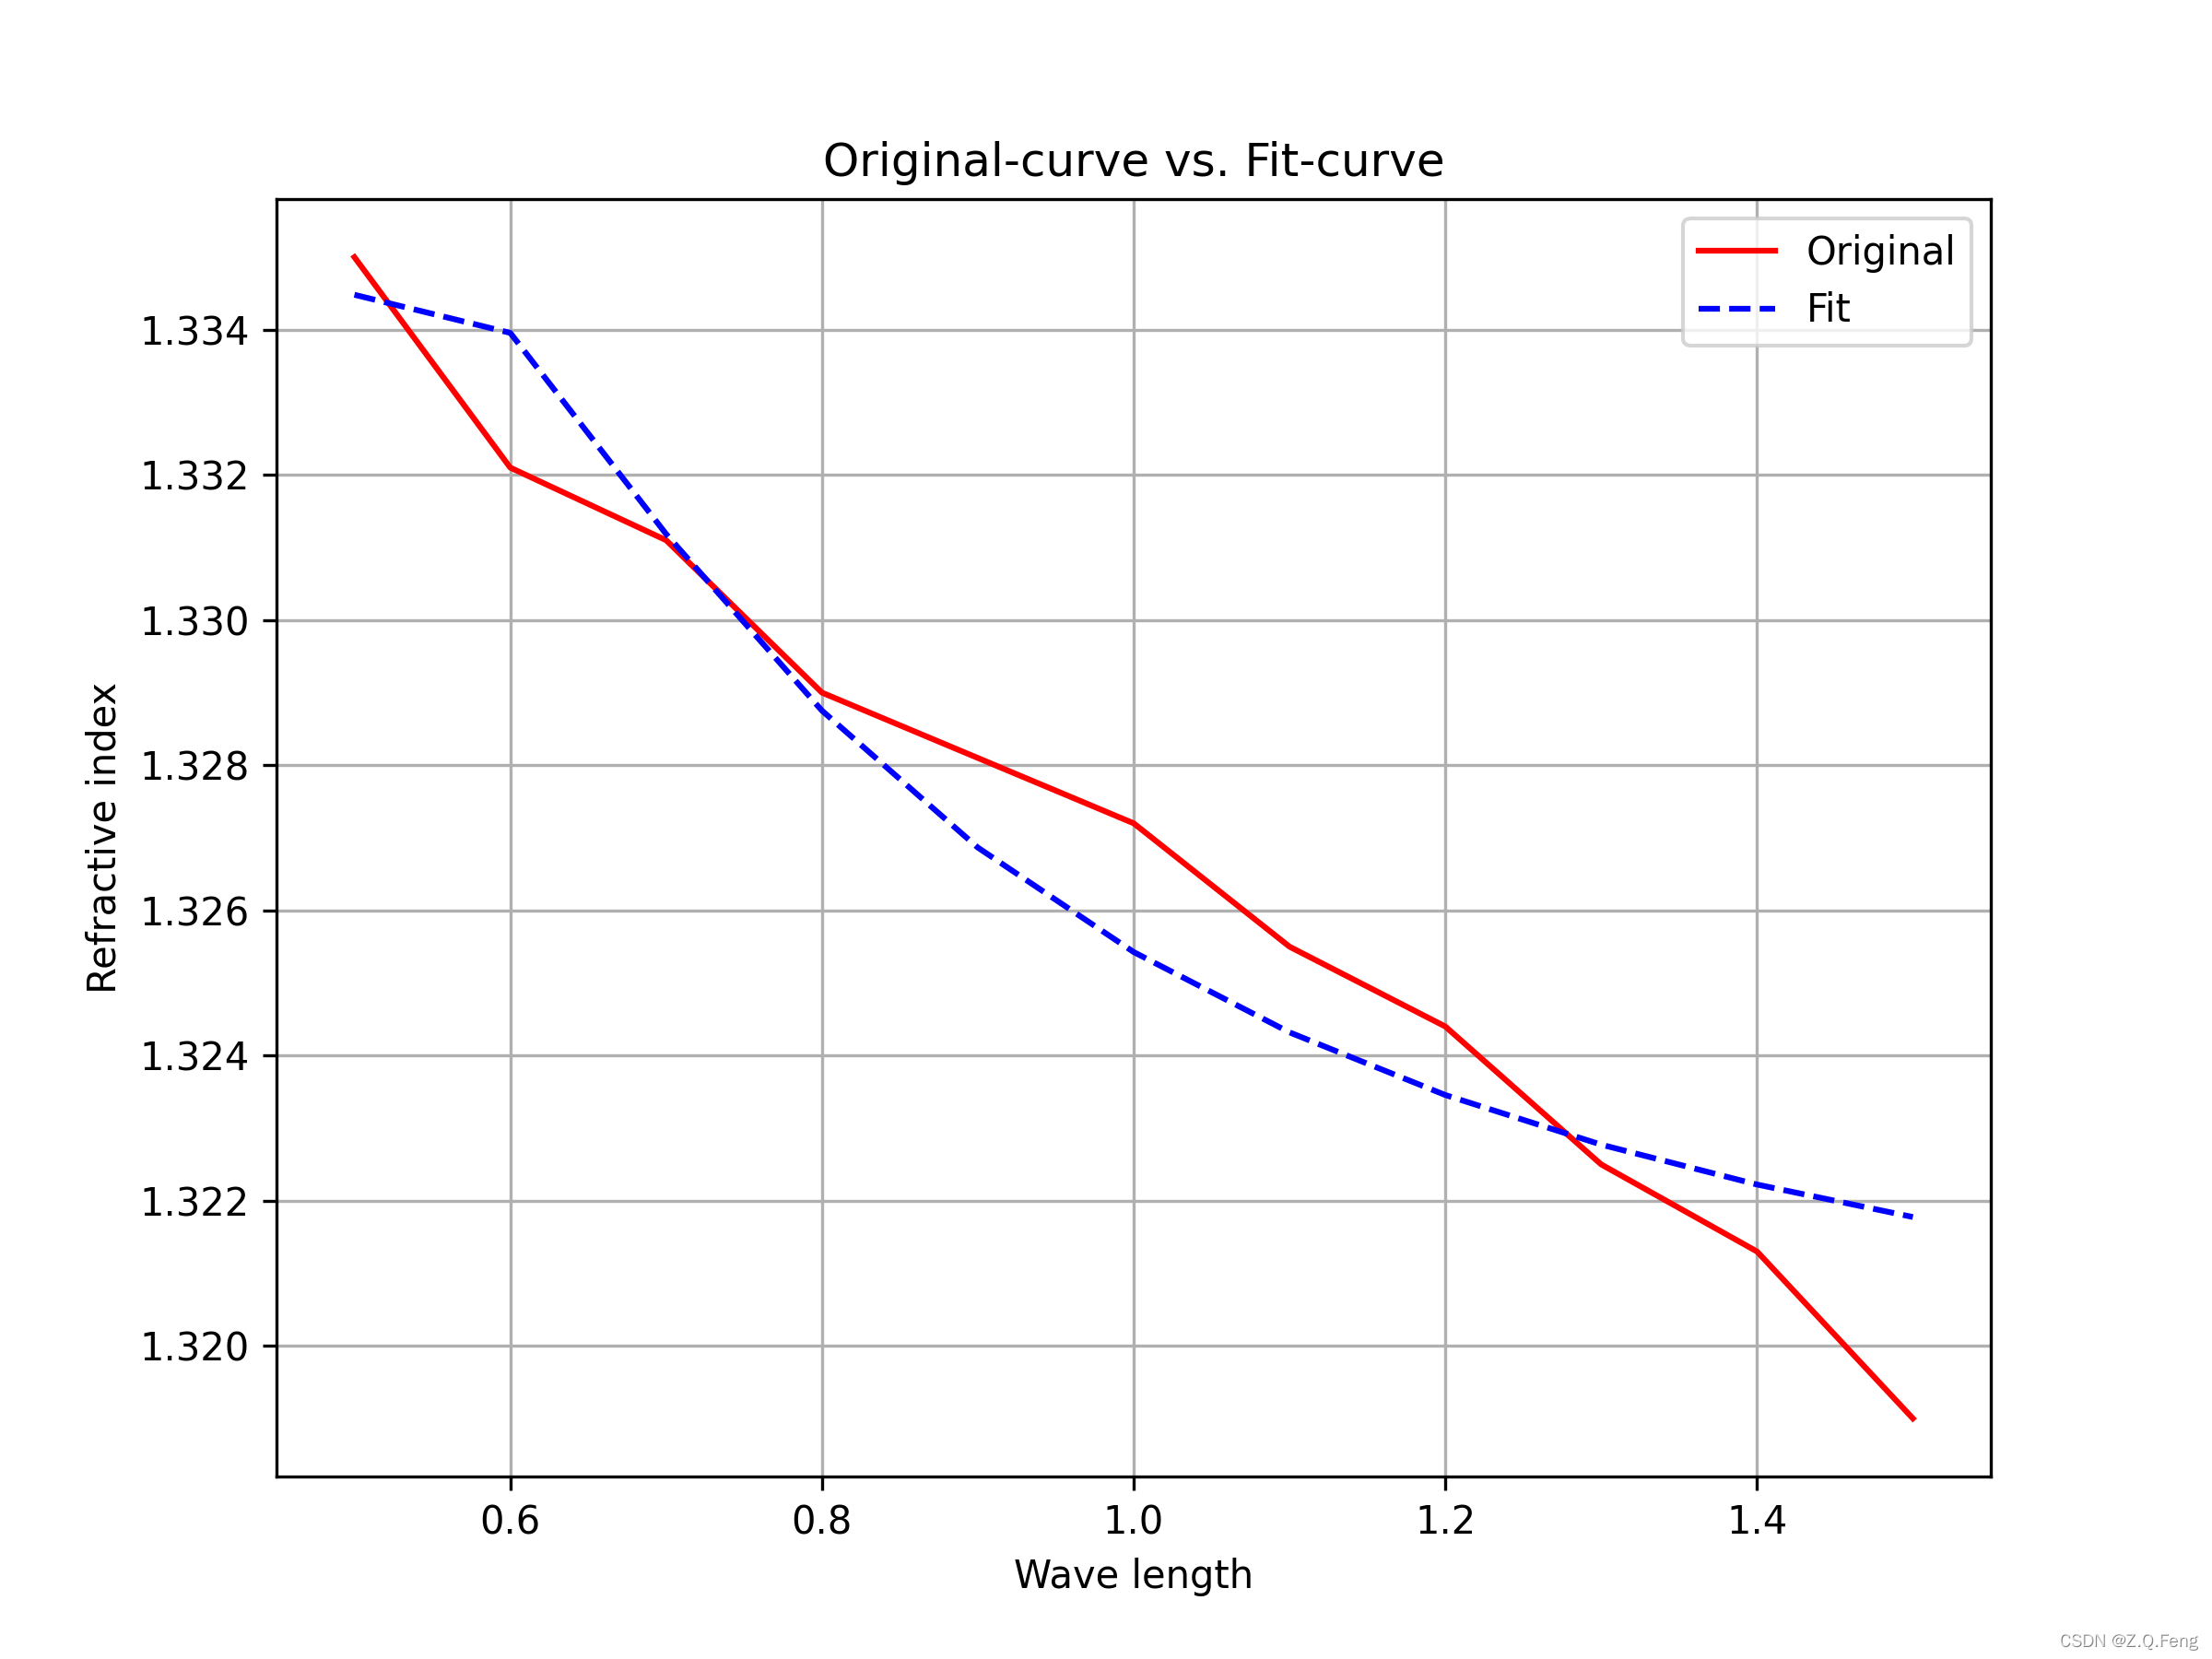
fit-Water.png:
其中,终端还会输出我们的拟合残差:
Please enter the datas' filename(without .txt) : Water

	Successfully create coeffs-Water.txt and fit-Water.png.

	The recovery residual is 0.004401.

Quit ? (y / n) :
五、总结
Python 的 nlinfit 函数精度不如 MATLAB 的高,但是配置 MATLAB 环境远比配置搭建 Python 环境困难,此外,我还编写了一份 Windows 下可直接运行出结果的 EXE 文件来拟合参数,上传到资源里啦:


 1484
1484

 被折叠的 条评论
为什么被折叠?
被折叠的 条评论
为什么被折叠?
 到【灌水乐园】发言


