


ECharts地图使用教程
前言
前阵子工作中需要的做个地图鼠标触摸的时候展示对应的信息,点击的时候跳转下一级.在对比了高德地图和echarts地图之后果断选择echarts地图,因为echarts做出来的3D效果不错,接下来开始撸代码.
效果图
在这里插入图片描述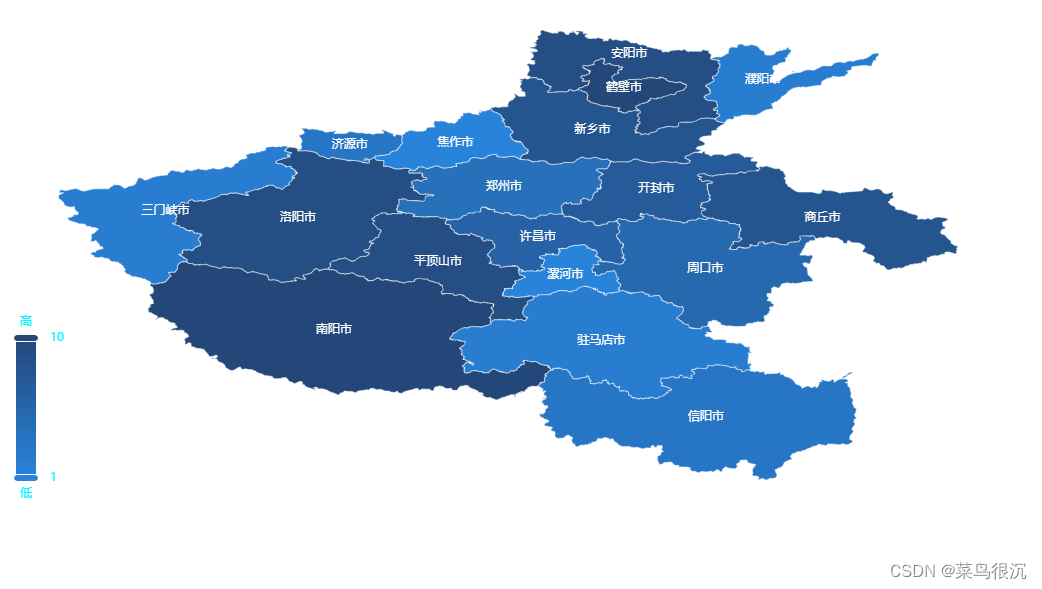
是不是也很炫酷哈
一、Echarts?
众所周知Echarts是一个基于 JavaScript 的开源可视化图表库,社区更是有很多好看且大气的可视化图表.
二、使用步骤
1.获取ECharts
从npm获取
npm install echarts
或者是使用地址链接,建议大家使用npm下载.下面代码为了方便大家使用是我单独写的demo,使用的地址链接.粘贴下来就可以直接使用.
<script src="https://registry.npmmirror.com/echarts/5.4.3/files/dist/echarts.min.js"></script>
<script src="https://registry.npmmirror.com/echarts-gl/2/files/dist/echarts-gl.min.js"></script>
2.完整代码
话不多说直接上代码.
<!DOCTYPE html>
<html lang="en">
<head>
<meta charset="UTF-8" />
<meta http-equiv="X-UA-Compatible" content="IE=edge" />
<meta name="viewport" content="width=device-width, initial-scale=1.0" />
<title>河南地图</title>
<script src="https://cdn.jsdelivr.net/npm/vue@2.7.14/dist/vue.js"></script>
<script src="https://registry.npmmirror.com/echarts/5.4.3/files/dist/echarts.min.js"></script>
<script src="https://registry.npmmirror.com/echarts-gl/2/files/dist/echarts-gl.min.js"></script>
<script src="https://unpkg.com/axios/dist/axios.min.js"></script>
</head>
<body>
<div id="app">
<div id="map" style="height: 500px; width: 1000px"></div>
</div>
<script>
var vm = new Vue({
el: '#app',
data() {
return {
name: '河南省',
dataJson: '',
};
},
async created() {
console.log('执行');
const { data } = await axios.get('./geojson.json');
console.log('data', JSON.stringify(data));
this.dataJson = JSON.stringify(data);
},
mounted() {
// this.test();
setTimeout(() => {
const { features } = JSON.parse(this.dataJson);
this.temp = features.map((v) => ({
value: Math.floor(Math.random() * 10) + 1,
name: v.properties.name,
}));
this.test();
console.log('name',this.name);
}, 1000);
},
methods: {
test() {
const { features = [] } = JSON.parse(this.dataJson);
const mapData = features.map((v) => {
const { name } = v.properties;
const value = Math.floor(Math.random() * 10) + 1;
return { name, value };
});
mapData.forEach((item) => {
item.itemStyle = {
normal: { areaColor: '#02b4b8', borderColor: '#fff' },
emphasis: { areaColor: '#8BB5D8' },
};
});
console.log('mapData', mapData);
const name = 'piduqu';
const chart = document.getElementById('map');
const myChart = echarts.init(chart);
myChart.showLoading();
const geoJson = this.dataJson;
myChart.hideLoading();
echarts.registerMap(name, geoJson);
const option = {
backgroundColor: 'rgba(4,58,112,0)',
left: '-40%',
right: '-40%',
bottom: '-40%',
top: '-40%',
tooltip: {
trigger: 'item',
// formatter: (params) => params.name,
formatter: '<span style="font-size: 20px;">{b}</span>',
},
visualMap: {
show: true,
text: ['高', '低'],
left: 'left',
top: 'bottom',
textStyle: {
color: '#00f7ff',
},
min: 1,
max: 10,
realtime: false,
calculable: true,
seriesIndex: [0],
inRange: {
color: ['#2884db', '#244779'],
},
},
series: [
{
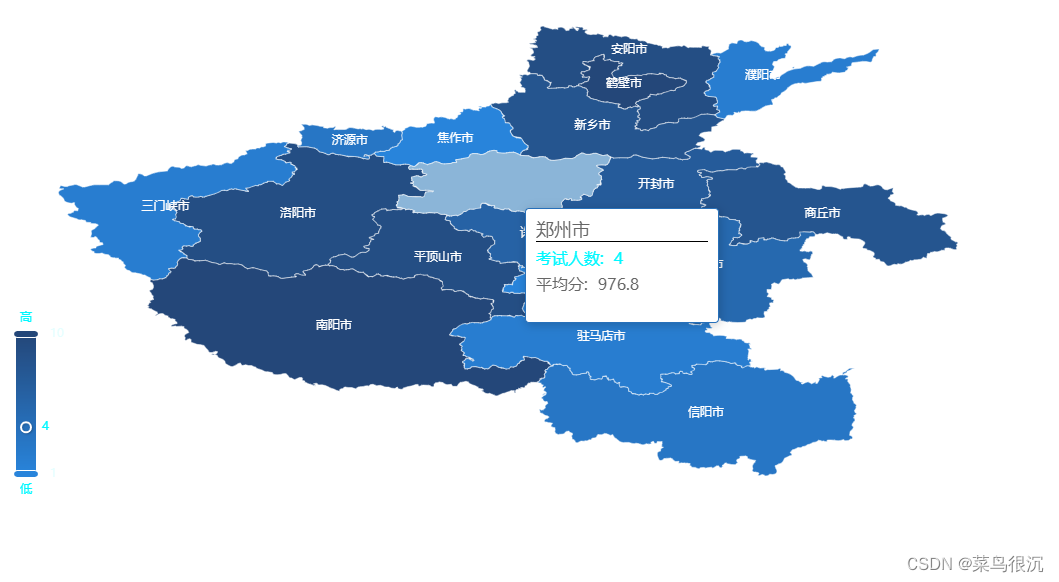
tooltip: {
trigger: 'item',
formatter: function (item) {
// console.log('item', item);
var tipHtml = '';
tipHtml =
'<div style="width: 172px;height: 93px;border-bottom-color:rgb(255,255,255,0.12);">' +
'<div style="height: 22px;border-bottom: 1px solid #000;font-size: 18px;">' +
item.name +
'</div>' +
'<div style="display:flex;justify-content: flex-start;color:#494949;margin-bottom:4px;font-size:16px;margin-top:5px">' +
'<span style="color:#00F7FF ;font-weight:400;margin-right:10px;">' +
'考试人数:' +
' ' +
'</span>' +
'<span style="color:#00F7FF;font-weight:400;">' +
item.value +
'</span>' +
'</div>' +
'<div style="display:flex;justify-content: flex-start;color:#494949;margin-bottom:4px;font-size:16px;margin-top:5px">' +
'<span style="color:#666;font-weight:400;margin-right:10px;">' +
'平均分:' +
' ' +
'</span>' +
'<span style="color:#666;font-weight:400;">' +
'976.8' +
'</span>' +
'</div>' +
'</div>';
return tipHtml;
},
},
type: 'map',
map: name,
geoIndex: 0,
// 长宽比
aspectScale: 0.75,
// 存在legend时显示
showLegendSymbol: false,
label: {
normal: {
show: true,
color: '#fff',
},
emphasis: {
show: false,
textStyle: {
color: '#02131b',
},
},
},
// 是否拖动
roam: false,
itemStyle: {
normal: {
areaColor: '#02b4b8',
borderColor: '#fff',
},
emphasis: {
areaColor: '#ffe900',
},
},
animation: false,
data: mapData,
},
],
};
myChart.setOption(option);
// 添加事件
myChart.off('click');
myChart.on('click', (params) => {
console.log('点击', params);
// this.$emit('checkCity', params.name);
});
},
},
});
</script>
</body>
</html>
这个地方请求了本地文件
async created() {
   console.log('执行');
   const { data } = await axios.get('./geojson.json');
   console.log('data', JSON.stringify(data));
   this.dataJson = JSON.stringify(data);
 },
下面是两个获取geojson文件的地址
https://datav.aliyun.com/portal/school/atlas/area_selector#&lat=33.50475906922609&lng=104.2822265625&zoom=4
https://hxkj.vip/demo/echartsMap/
总结
echarts地图效果还是比较美观的,根据获取的geojson文件来展示对应的地区.目前只能展示到县区一级,街道乡镇是没有对应的geojson文件的.


 1万+
1万+


 被折叠的 条评论
为什么被折叠?
被折叠的 条评论
为什么被折叠?
 到【灌水乐园】发言


