


 本文描述了一个护理部开发的体温单系统,使用Vue和Zrender库在前端实现多天、多时间点的体温单绘制,后端采用Springboot、mybatisplus和MySQL进行数据处理。详细介绍了日期范围处理、网格绘制方法和页面分页功能。
文章目录
-
- 背景
- 整体架构流程
背景
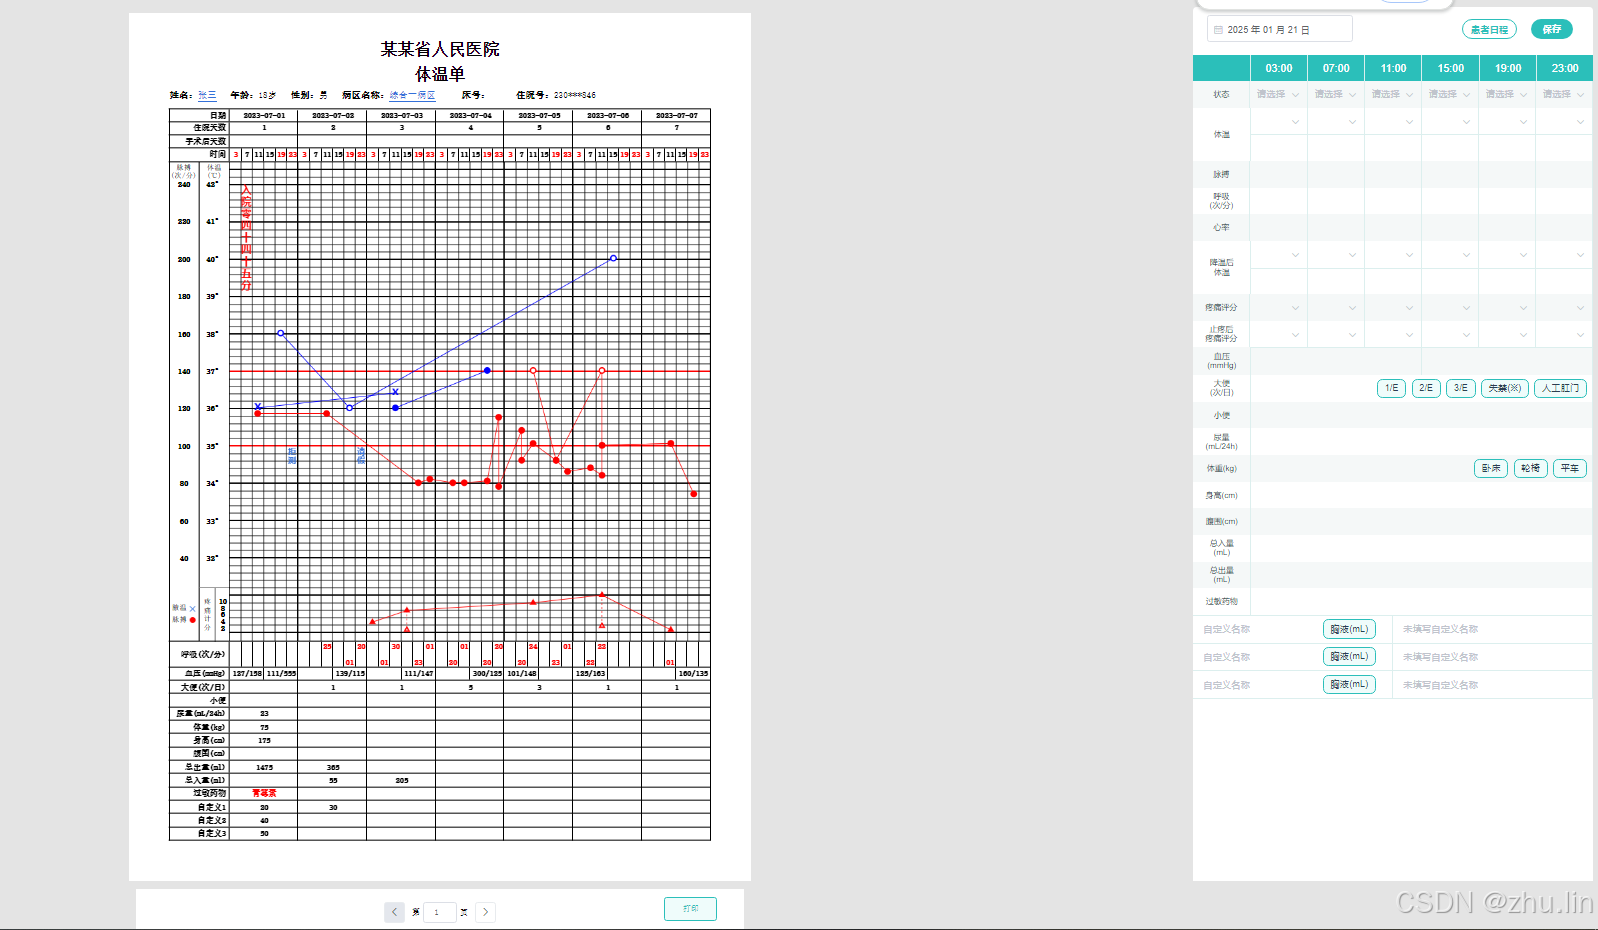
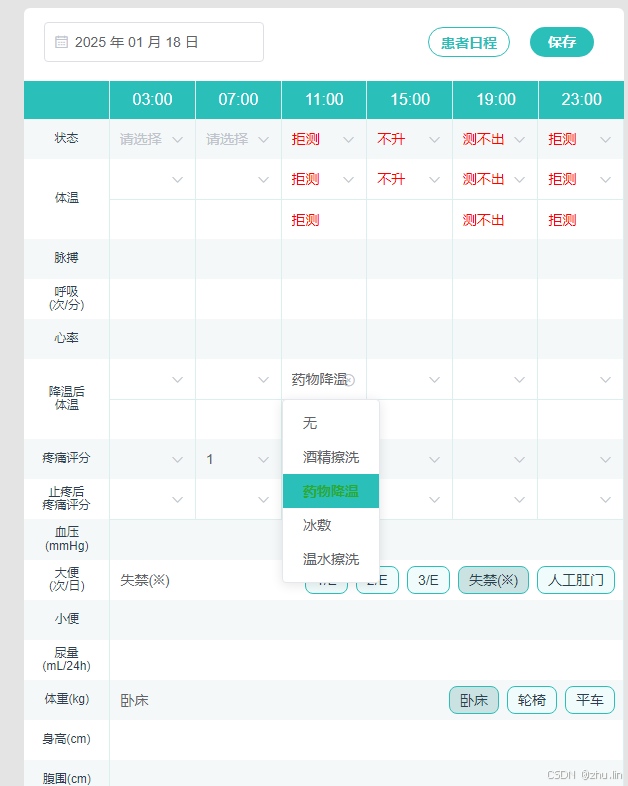
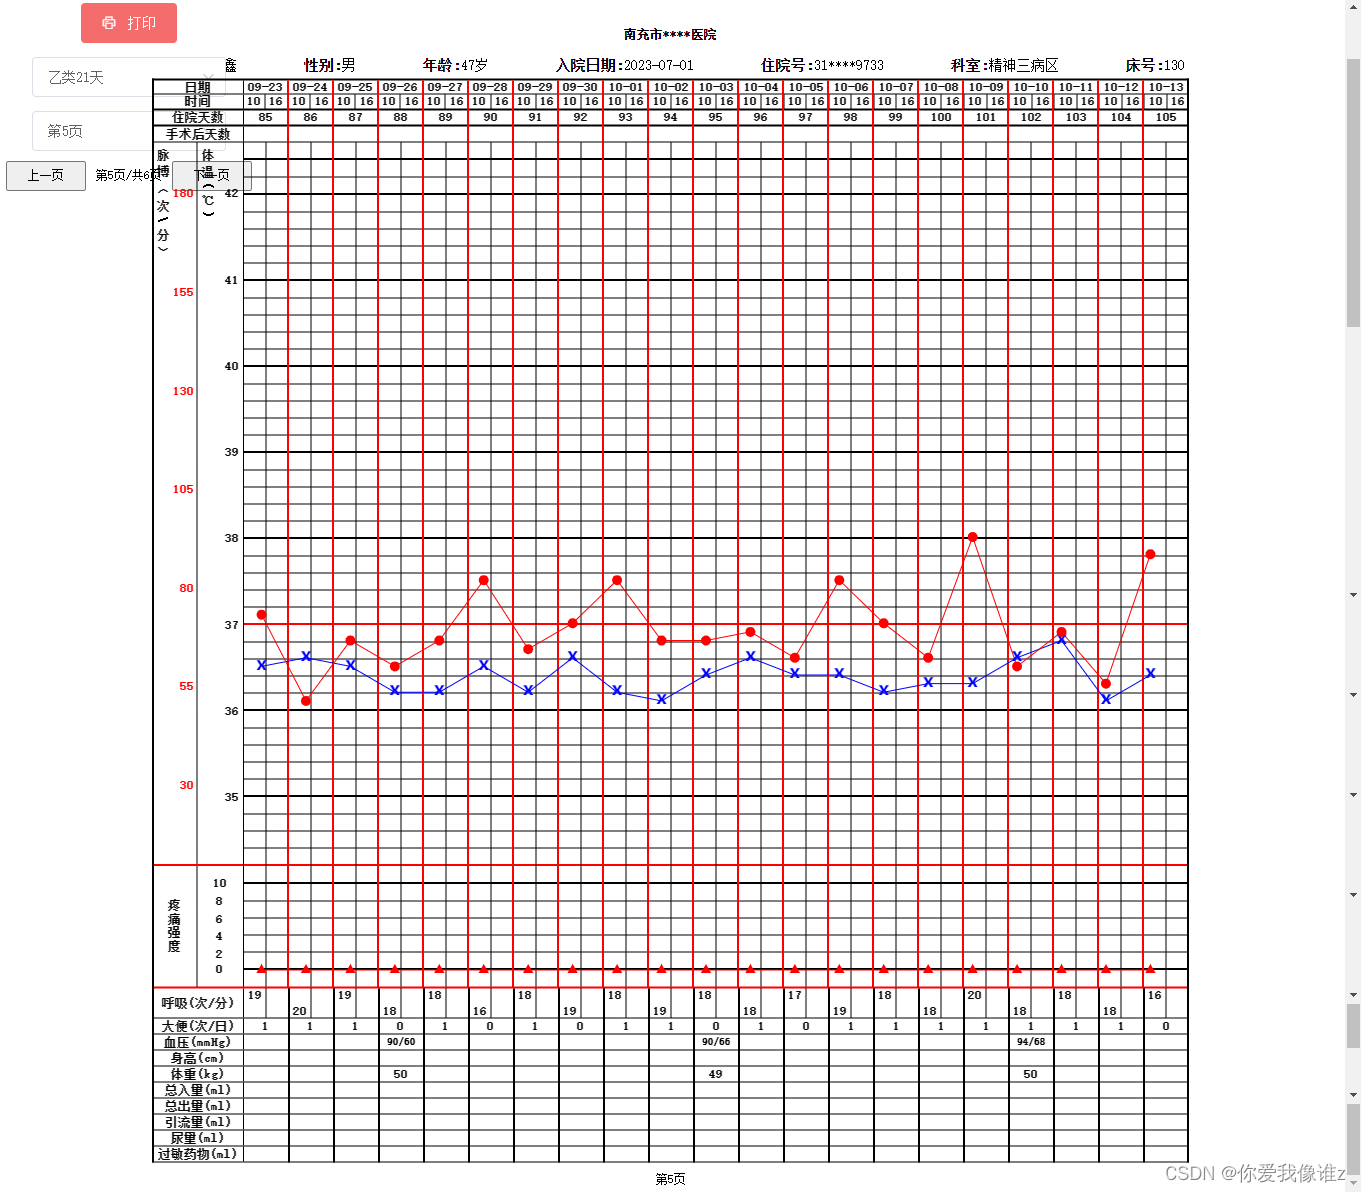
在医疗护理工作中,体温监测是评估患者健康状况的重要指标之一。为了满足护理部对于体温记录管理的多样化需求,我们设计并开发了一套灵活的体温单系统。该系统旨在通过数字化手段,简化体温记录流程,提高数据准确性和工作效率,同时支持多种定制化功能,以适应不同患者的监测需求。
效果:
注:在线体验版本:体温单,在线演示体验http://118.24.46.235/twd/#/
- 多日多时间点记录:
- 系统支持设置多种不同的体温记录周期,包括但不限于7天6个时间点、14天4个时间点、21天2个时间点和30天1个时间点等等。用户可以根据患者的具体情况和医嘱,灵活设置体温记录计划。
- 自动生成预设时间点的记录框,便于医护人员快速录入数据,减少遗漏。
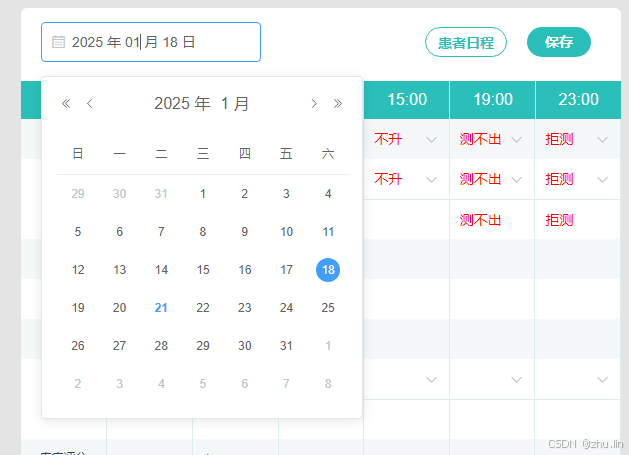
- 自定义时间筛序:
- 提供强大的时间筛选功能,用户可以根据需要选择特定的日期范围或时间点,快速查找和筛选体温记录。
- 支持多种筛选条件组合,如按日期、时间段、患者ID等,提高数据检索效率。
- 多种类型体温单切换:
- 系统内置多种体温单模板,包括但不限于常规体温单、特殊疾病专用体温单等,满足不同科室和患者的特殊需求。
- 用户可以根据实际情况,轻松切换体温单类型,保持记录的规范性和一致性。
- 分页显示与局部打印:
- 支持体温记录的分页显示,便于用户浏览和管理大量数据。
- 提供局部打印功能,用户可以选择打印特定时间段或特定页面的体温记录,节省纸张和墨水,同时满足医院对病历资料管理的要求。
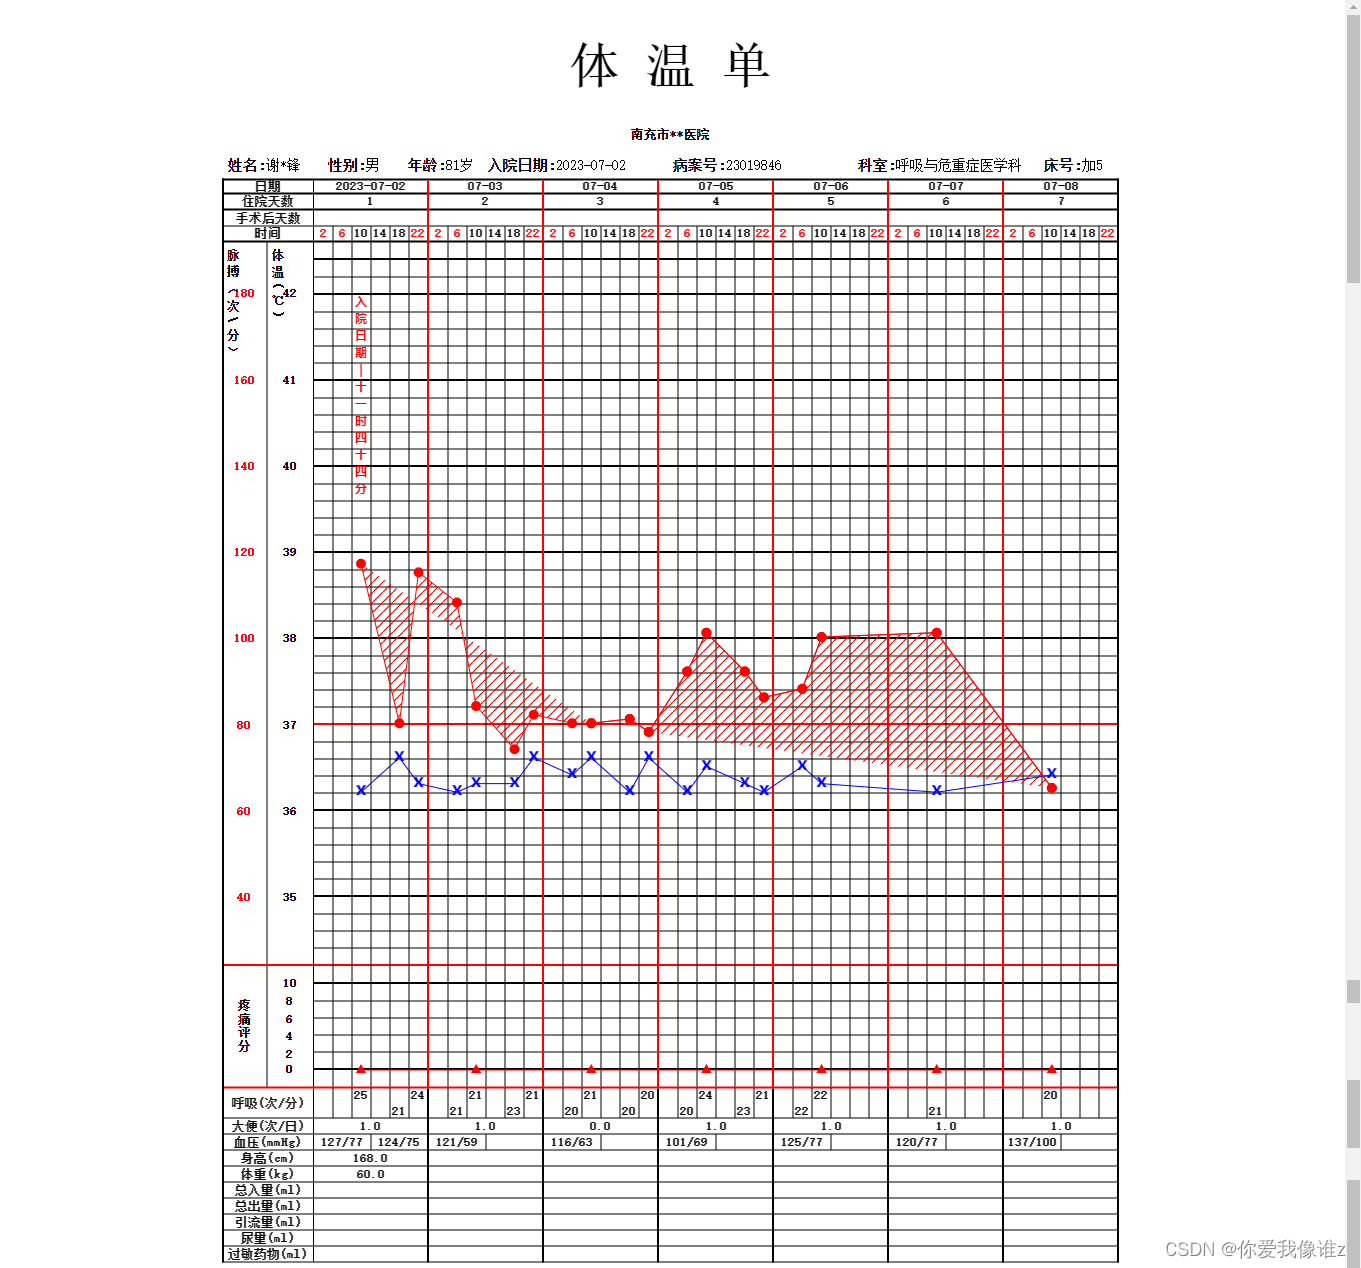

整体架构流程
- 项目重点在于中间网格的绘制,用到的canvas类库的zrender
- 前端使用vue + zrenderjs开发。后端:Springboot + mybatis plus + mysql
- 绘制网格,根据入院的开始时间和结束时间,绘制遍历总条数线
- 绘制体温单的天数
// 绘制体温单天数 createDate() { const list = []; const min = new Date(`${this.dateRange[0]} 00:00:00`).getTime(); const max = new Date(`${this.dateRange[1]} 00:00:00`).getTime(); // console.log(min, max, "----------------------------7") for (let i = min; i <= max; i += 24 * 60 * 60 * 1000) { list.push(this.parseTime(i, '{y}-{m}-{d}')) } return list; }, -
// 绘制Y轴坐标 createYz() { const totalLine = this.yRange[1] - this.yRange[0] + 1 + (this.yRange[1] - this.yRange[0]) * 4 + 3 + 6 let preSpace = 0 let breakIndex = 0 for (let i = 0; i < totalLine; i++) { const isPainBreak = this.yRange[1] - breakIndex + 2 === 35 && (i - 3) % 5 === 4 const isBreak = ((i - 3) % 5 === 0 || isPainBreak || i === 1) && i > 0 && i < totalLine - 1 const isboundary = i === 0 || i === totalLine - 1 const lineWidth = isBreak ? 2 : 1 const params = { x1: 0, y1: preSpace, x2: this.areaWidth - 1, y2: preSpace, lineWidth, color: isBreak ? this.yRange[1] - breakIndex++ + 1 === 37 || isPainBreak ? 'red' : '#000' : isboundary ? 'transparent' : '#000' } preSpace += lineWidth + this.ySpace this.createLine(params) } }, // 绘制X轴坐标 createXz() { const totalLine = this.xRange[1] - this.xRange[0] + 1 + (this.xRange[1] - this.xRange[0]) * 5 let preSpace = 0 for (let i = 0; i < totalLine; i++) { const isBreak = i % 6 === 0 && i > 0 && i < totalLine - 1 const lineWidth = isBreak ? 2 : i === 0 ? 2 : 1 const params = { x1: preSpace, y1: 0, x2: preSpace, y2: this.areaHeight, lineWidth, color: isBreak ? 'red' : '#000' } preSpace += lineWidth + this.xSpace this.createLine(params) } }, -
绘制表顶注释(为了防止注释重叠,如果注释落在同一个格子里,则依次往后移一个格子)
//绘制注释 createNote(notes, y, color) { const xaxis = notes.map((x) => this.getXaxis(this.getLocationTime(x.time)) ) const xaxisNew = this.handleNoteXaxis(xaxis) notes.forEach((x, i) => { let value = x.value if (x.value.endsWith('|')) { value = `${x.value}${this.toChinesNum( new Date(x.time).getHours() )}时${this.toChinesNum(new Date(x.time).getMinutes())}分` } this.createText({ // x: this.getXaxis(this.getSplitTime(x.time)) + this.xSpace/2, x: xaxisNew[i], y, value: this.addn(value), color, textLineHeight: this.ySpace + 1, fontWeight: 'bold' }) }) }, -
分页
this.vitalSigns = vitalSigns // 计算最大标识时间 const maxTimeNum = Math.max.apply( null, vitalSigns.map((x) => new Date(x.time_point).getTime()) ) const admissionDateNum = new Date( `${this.patInfo.admission_date.slice(0, 10)} 00:00:00` ).getTime() // 根据入院时间和最大标识时间计算出页数和每页的时间范围 const dateRangeList = [] for ( let i = admissionDateNum; i < maxTimeNum; i += 7 * 24 * 60 * 60 * 1000 ) { dateRangeList.push([ this.parseTime(i, '{y}-{m}-{d}'), this.parseTime(i + 6 * 24 * 60 * 60 * 1000, '{y}-{m}-{d}') ]) } // console.log(dateRangeList, "------------------------------7") this.dateRangeList = dateRangeList this.pageTotal = dateRangeList.length; // 页码数 let getArry=[]; for(let i=1;i<=this.pageTotal;i++){ getArry.push(i); } this.selVals= []; getArry.map((item,index)=>{ this.selVals.push({ label: "第" + item + "页", value:item }) }); // 页码数 end -
脉搏和心率需要画多边形,并且加上斜线阴影
脉搏和心率需要画多边形,并且加上斜线阴影
将脉搏和心率抽出来单独处理,描完点后使用zrender.Polygon()画多边形,阴影则用canvas画一根斜线填充到多边形里即可js
createPolygon({ points, lineWidth, color, zlevel = 0 }) {
  const canvas = document.createElement('canvas')
  canvas.width = 10
  canvas.height = 10
  const ctx = canvas.getContext('2d')
  ctx.moveTo(canvas.width, 0)
  ctx.lineTo(0, canvas.height)
  ctx.lineWidth = 1
  ctx.strokeStyle = 'red'
  ctx.stroke()

  const polygon = new zrender.Polygon({
    zlevel,
    shape: {
      points,
      smooth: 0,
      smoothConstraint: 0,
    },
    style: {
      lineWidth,
      stroke: color,
      fill: {
        image: canvas
      }
    }
  })
  this.zr.add(polygon)
},
-
项目开箱即用
-
源码请联系我Wx
-

-
创作不易请喝杯咖啡吧
-


 2878
2878

 被折叠的 条评论
为什么被折叠?
被折叠的 条评论
为什么被折叠?
 到【灌水乐园】发言


