


一:下载echarts
`npm install echarts --save
二:在相应页面引入echarts
import * as echarts from 'echarts'
三:定义ref,用于获取dom
<div ref="basic" class="centerCenterBottom" />

const basic = ref()
四:写一个函数在函数中获取div,并写配置项
function init() {
	//**
	**//通过basic.value就可以获取dom,等同getElementById(#id)**
	//**
  const myChart = echarts.init(basic.value)
  const option = {
    xAxis: {
      type: 'category',
      // fontSize: 60,
      axisLabel: {
        // 设置x轴字体大小和颜色
        textStyle: {
          fontSize: '15',
          color: '#fff'
        }
      },
      splitLine: { // 去除网格线
        show: false,
        type: 'dotted' // 网格线样式
      },
      data: state.xdata
    },
    yAxis: {
      type: 'value',
      splitLine: {
        // 设置y轴上每列线条展示
        show: true,
        //设置每列线条样式,
        lineStyle: {
          type: 'dotted', // 网格线样式
          //   dashOffset: 5
          color: 'rgba(255, 255, 255,0.3)'
        }
      }
    },
    // 调整图标位置
    grid: {
      show: false,
      top: '15%', // 一下数值可为百分比也可为具体像素值
      right: '5%',
      bottom: '10%', //控制折线图位置
      left: '5%'
    },
    legend: {
      //   data: ['Email'],
      //   icon: 'circle',
      top: '5%',
      right: '5%',
      textStyle: { // 图例的字体颜色
        color: '#fff'
      },
    },

    series: [{
      name: '行为识别',
      type: 'line',
      data: state.ydata,
      // showBackground: true,
      // backgroundStyle: {
      //   color: 'rgba(180, 180, 180, 0.2)'
      // }
      // 设置折线图拐点的样式的大小
      symbol: "circle",
      symbolSize: 10,

      // smooth: true,
      // areaStyle: {设置图标阴影},
      itemStyle: {
        normal: {
          // color: 'black',
          shadowBlur: 2
          // shadowColor: 'blue',
          // shadowOffsetX: 10,
          // shadowOffsetY: 2
        }
      }

    },
    {
      //另加一个series,配置折线图的每个项的背景色
      data: [
        0, 0, 0, 0, 0, 0, 0
      ],
      type: 'bar',
      barWidth: 100, // 设置柱子的宽度
      //是否展示每根柱子的背景
      showBackground: true,
      backgroundStyle: {
        color: new echarts.graphic.LinearGradient(0, 0, 0, 1, [{
          offset: 0,
          color: 'rgba(10, 50, 100, 0.2)'
        }, {
          offset: 1,
          color: 'rgba(3, 9, 37, 0.2)'
        }]),
      }
    },]
  }
  myChart.setOption(option)
}

五:配置完了,但是什么时候进行挂载=》在onMounted生命周期中进行挂载

onMounted(
  () => {
    init()
  }
)

注意:需要对div设置宽高,不然echarts显示不出来
.centerCenterBottom {
      width: 200px;
      height: 100px;
    }
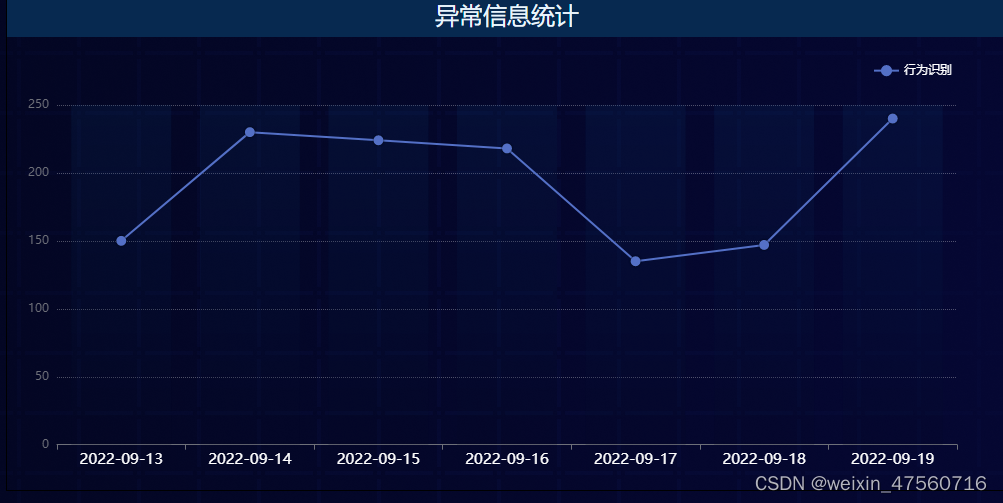
成功:


 592
592


 被折叠的 条评论
为什么被折叠?
被折叠的 条评论
为什么被折叠?
 到【灌水乐园】发言


