


本文简单粗暴,如有不适请点击右上角X
。yml文件若报错找不到问题,自行百度 yml文件在线编辑器 方便排错
请提前准备两台虚拟机。模拟正式环境nginx日志的收集
192.168.75.139:nginx,filebeat
192.168.75.138:logstash,elasticsearch,kibana
下载地址:
yum安装nginx
rpm -Uvh http://nginx.org/packages/centos/7/noarch/RPMS/nginx-release-centos-7-0.el7.ngx.noarch.rpm
yum -y install nginx
filebeat
https://artifacts.elastic.co/downloads/beats/filebeat/filebeat-7.13.2-linux-x86_64.tar.gz
logstash
https://artifacts.elastic.co/downloads/logstash/logstash-7.13.2-linux-x86_64.tar.gz
elasticsearch
https://artifacts.elastic.co/downloads/elasticsearch/elasticsearch-7.13.2-linux-x86_64.tar.gz
kibana
https://artifacts.elastic.co/downloads/kibana/kibana-7.13.2-linux-x86_64.tar.gz
需使用统一版本,不然报错
filebeat安装
192.168.75.139
通过filebeat收集日志发送至logstash处理(轻量化,资源占用较小,稳定)
解压,修改配置文件
systemctl start nginx
tar -xzvf filebeat-7.13.2-linux-x86_64.tar.gz -C /usr/local
mv /usr/local/filebeat-7.13.2-linux-x86_64 /usr/local/filebeat
vim /usr/local/filebeat/filebeat.yml
filebeat.inputs:
‐type: log
        enabled:true
paths:
                ‐ /var/log/nginx/*.log
filebeat.config.modules:
        path: ${path.config}/modules.d/*.yml
        reload.enabled: false
setup.template.settings:
        index.number_of_shards: 1

# 输出到 logstash
output.logstash:
# logstash 的 IP和端口
        hosts: ["192.168.75.138:5044"]#收集到的日志信息发送至logstash
processors:
        ‐ add_host_metadata:
                when.not.contains.tags: forwarded
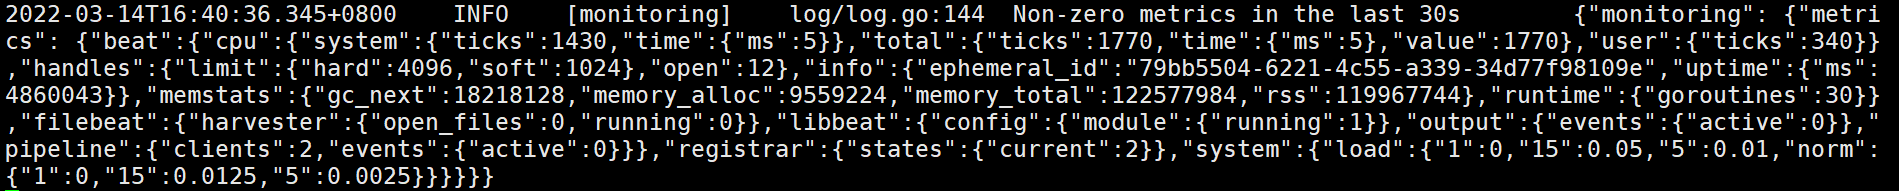
运行filebeat,访问nginx。查看输出信息。
less usr/locaal/filebeat/logs/filebeat
后台启动filebeat
./filebeat -c /usr/local/filebeat/filebeat.yml &
logstash安装
192.168.75.138
解压,修改配置文件
tar -xzf logstash-7.13.2-linux-x86_64.tar.gz -C /usr/local/
vim /usr/local/logstash/config/first-pipeline.conf             #新建配置文件
input {
        beats {
                port => 5044#输入信息为监听5044端口收到的信息
        }
}
filter {
        grok {
                match => { "message" => "%{COMBINEDAPACHELOG }" }
        }
        # geoip { source => "clientip" }
}

output {
        stdout {
                codec => rubydebug
        }
        #判断日志类型,创建索引,并输入到elasticsearch
if [log][file][path] == "/var/log/nginx/access.log" {
        elasticsearch {
                hosts => ["192.168.75.138:9200"]
                index => "%{[host][hostname]}‐nginx‐access‐%{+YYYY.MM.dd}"
        }
} else if [log][file][path] == "/var/log/nginx/error.log" {
        elasticsearch {
                hosts => ["192.168.75.138:9200"]
                index => "%{[host][hostname]}‐nginx‐error‐%{+YYYY.MM.dd}"
                }
        }
}
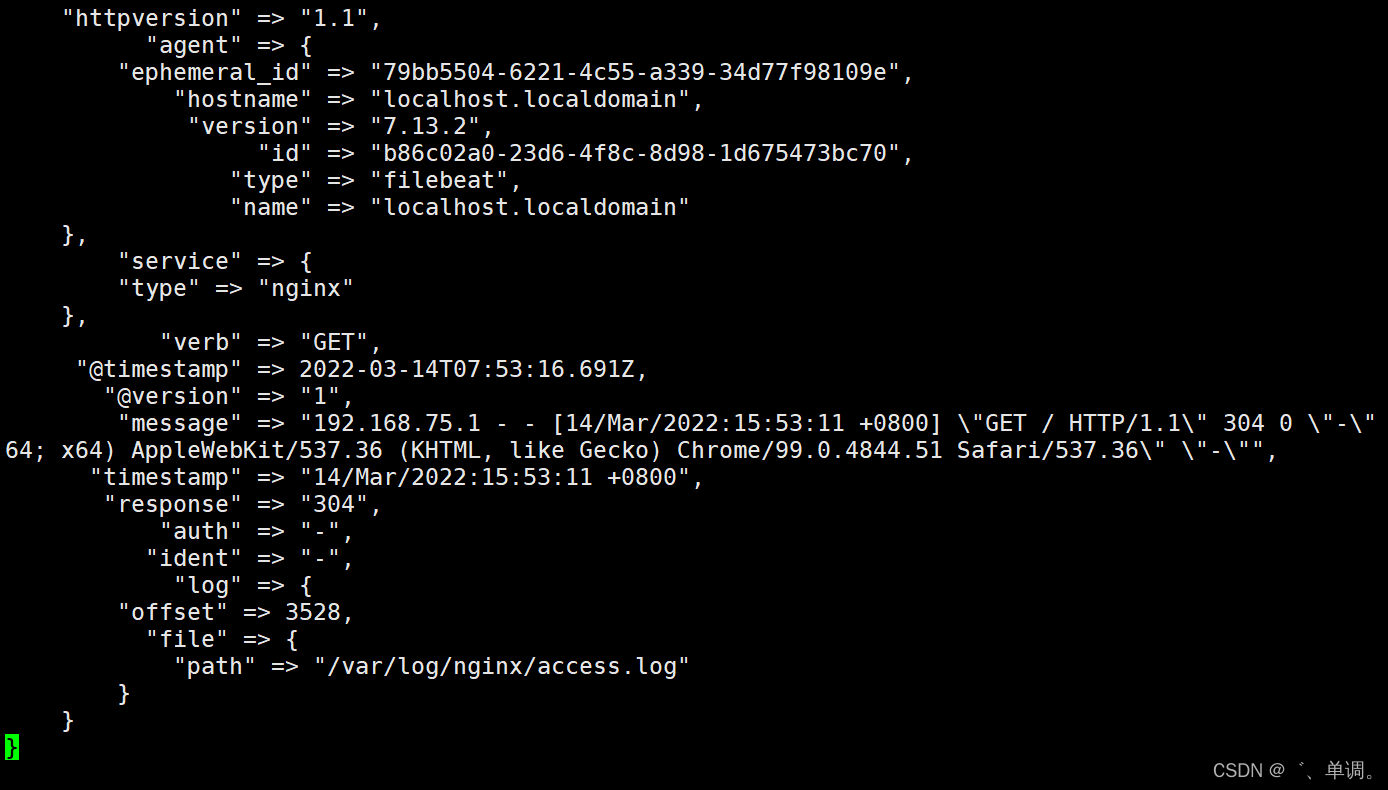
启动logstash,访问nginx。查看日志是否输出到logstash
cd /usr/local/logstash/bin
nohup ./logstash ‐f …/config/first‐pipeline.conf &
tail -f nohup.out
elasticsearch
安装,配置
tar -xzf  elasticsearch-7.13.2-linux-x86_64.tar.gz -C /usr/local/
cd /usr/local/
mv elasticsearch-7.13.2-linux-x86_64 elasticsearch
vim config/elasticsearch.yml
cluster.name: elk
node.name: es           #多节点部署请区分名称,例如:es01,es02,es03
node.data: true
network.host: 192.168.75.138
http.port: 9200
#本文单节点部署es,如需多节点增加一下#后面内容即可,如果还是单节点部署,请删除本行#后面内容
discovery.seed_hosts:
        ‐ 192.168.75.138
#        ‐ 192.168.75.136
#        ‐ 192.168.75.137
cluster.initial_master_nodes: ["es01","es02","es03"]
#cluster.initial_master_nodes: ["es01","es02","es03"]
es启动不能使用root,需创建单独账号,并授权属主属组
useradd es
chown -R es.es /usr/local/elasticsearch
su ‐ es
cd /usr/local/elasticsearch‐7.10.0
./bin/elasticsearch ‐d ‐p /tmp/elasticsearch.pid
查看端口 9200 9300是否启动
ss ‐ntal


查看集群健康状态
curl -X GET "localhost:9200/_cat/health?v"
查看是否自动创建索引
curl ‐X GET "192.168.75.138:9200/_cat/indices"
yellow open %{[host][hostname]}‐nginx‐access‐2022.03.14 xGSURq-tSFuojgx8257g0w 1 1  2    0  44.8kb  44.8kb
kibana
部署,修改配置
tar -xzvf kibana-7.13.2-linux-x86_64.tar.gz -C /usr/local
mv /usr/local/kibana-7.13.2-linux-x86_64 /usr/local/kibana
vim /usr/local/kibana/config/kibana.yml
server.port: 5601
server.host: "0.0.0.0"
elasticsearch.hosts: ["http://192.168.75.138:9200"]#es地址 若部署es集群请注销本行,解开下一行注释
#elasticsearch.hosts: ["http://192.168.75.136:9200","http://192.168.75.137:9200","http://192.168.75.138:9200"]
logging.dest:  /var/log/kibana/kibana.log  #kibana日志存放位置
i18n.locale: "zh-CN" #kibana界面设置为中文
创建程序使用的目录授权,
mkdir /run/kibana /var/log/kibana/
chown -R es.es /run/kibana /var/log/kibana/ /usr/local/kibana
su es
nohup /usr/local/kibana/bin/kibana &
192.168.75.138:5601 访问kibana页面


在这里即可查看我们刚刚收集到的日志信息
ELK部署完成,若有不足的地方欢迎大佬指导
windows版ELK部署文档暂时未发出来,有需要的也可以私信我


 1221
1221


 被折叠的 条评论
为什么被折叠?
被折叠的 条评论
为什么被折叠?
 到【灌水乐园】发言


