


本文实现了与MATLAB内置函数功能一致的STFT C++算法实现
论文基于STFT的算法原理以及MATLAB中的spectrogram函数,采用C++语言开发了一个专门的短时傅里叶变换计算类。根据MATLAB中spectrogram函数的定义,该函数返回的结果包括:
[S,F,T] = spectrogram(x,window,noverlap,nfft,fs)其中,S代表STFT矩阵,F表示频率向量,T为时间向量,在这种可视化方法中,频率向量作为纵坐标,时间向量作为横坐标,而STFT矩阵则通过色条的深浅来表示不同的幅度值。因此,为了后续能使用QT画出与MATLAB一致的频谱图,基于C++的实现结果也需要返回这个三个值。
1. STFT的基本原理
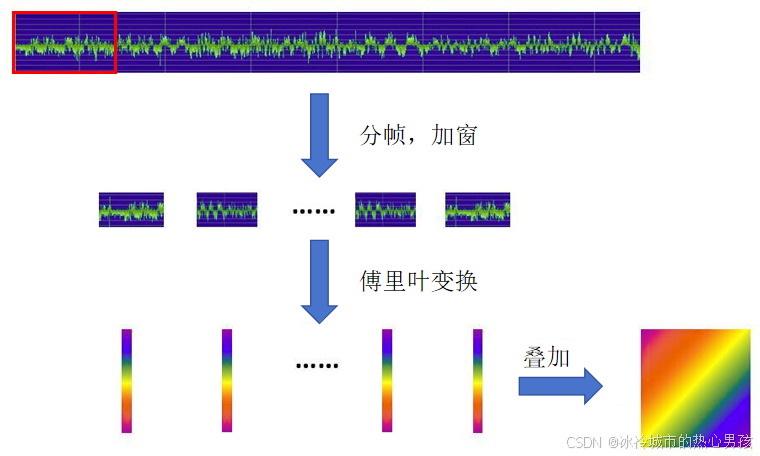
STFT通过引入一个时间窗口来截断振动信号,表征特定时刻的振动特性。在每个选定的时间段内,振动信号可被视作近似平稳的,随后对这段信号执行傅里叶变换,由于时间窗沿时间轴移动,可以获取信号在不同时间点的频谱变化,STFT描述如下:
通过将原始信号 与时间窗函数
相乘, 将所得的结果与傅里叶基函数
进行乘积运算, STFT 算法流程设计如图所示。
2.STFT代码实现
设计一个STFT类,主要包含两个功能:1.信号加窗 2.STFT,头文件代码如下:
// 定义窗口类型的枚举
enum WindowType {
    HANN,
    HAMMING,
    BLACKMAN,
    FLAP_TOP,
    // 添加其他窗口类型...
};
class STFT_calculator
{

public:
// calculateSTFT 函数声明
static std::tuple<std::vector<std::vector<std::complex<double>>>, std::vector<double>, std::vector<double>> calculateSTFT(const std::vector<double>& signal, int windowSize, int overlap, double fs, WindowType windowType);
    // getWindow 函数声明
static std::vector<double> getWindow(WindowType windowType, int windowSize);
};

#endif // STFT_CALCULATOR_H
这里定义窗口类型的枚举是为了后续在QT中开发可视化窗口。
2.1 加窗函数的实现
vector<double> STFT_calculator::getWindow(WindowType type, int size) {
    vector<double> window(size);

    switch (type) {
    case HANN:
        for (int i = 0; i < size; i++) {
            window[i] = 0.5 * (1 - cos(2 * M_PI * i / (size - 1)));
        }
        break;
    case HAMMING:
        for (int i = 0; i < size; i++) {
            window[i] = 0.54 - 0.46 * cos(2 * M_PI * i / (size - 1));
        }
        break;
    case BLACKMAN:
        for (int i = 0; i < size; i++) {
            window[i] = 0.42 - 0.5 * cos(2 * M_PI * i / (size - 1)) + 0.08 * cos(4 * M_PI * i / (size - 1));
        }
        break;
    case FLAP_TOP:
        for (int i = 0; i < size; i++) {
            if (i <= size / 10) {
                window[i] = 0.5 * (1 - cos(10.0 * M_PI * i / size));
            } else if (size / 10 < i && i <= 9 * size / 10 - 1) {
                window[i] = 1;
            } else {
                window[i] = (1 + cos(10.0 * M_PI * (i - 9.0 * size / 10) / size)) / 2;
            }
        }
        break;
    default:

        break;
    }

    return window;
}
这里例举了四种较常使用的窗函数,其原理公式可以在文献中找到,不过多赘述。
2.2 短时傅里叶变换计算实现
本文采用FFTW库进行傅里叶变换,STFT计算实现代码如下:
std::tuple<std::vector<std::vector<std::complex<double>>>, std::vector<double>, std::vector<double>> STFT_calculator::calculateSTFT(const std::vector<double>& x, int windowSize, int overlap, double fs, WindowType windowType) {


    int signalSize = x.size();
    int L=1 + static_cast<int>(std::floor((signalSize - windowSize) / static_cast<double>(overlap)));
    std::vector<std::vector<std::complex<double>>> STFT(windowSize, std::vector<std::complex<double>>(L, 0.0));

    // 获取窗口函数
    std::vector<double> window = getWindow(windowType, windowSize);
    // Create FFTW plans
    fftw_complex *in, *out;
    fftw_plan plan;
    in = (fftw_complex*)fftw_malloc(sizeof(fftw_complex) * windowSize);
    out = (fftw_complex*)fftw_malloc(sizeof(fftw_complex) * windowSize);
    plan = fftw_plan_dft_1d(windowSize, in, out, FFTW_FORWARD, FFTW_ESTIMATE);

    // STFT
    for (int l = 0; l < L; ++l) {
        // 加窗
        std::vector<double> xw(windowSize, 0.0);
        for (int i = 0; i < windowSize; ++i) {
            xw[i] = x[l * overlap + i] * window[i];
        }

        // FFT计算
        for (int i = 0; i < windowSize; ++i) {
            in[i][0] = xw[i];
            in[i][1] = 0.0;
        }

        fftw_execute(plan);

        // In-place FFTshift (if needed)
        int shift = windowSize / 2;
        std::vector<std::complex<double>> shiftedX(windowSize);
        for (int i = 0; i < windowSize; ++i) {
            int shiftedIndex = (i + shift) % windowSize;
            shiftedX[i] = std::complex<double>(out[shiftedIndex][0], out[shiftedIndex][1]);
        }

        // Assign to STFT(:, 1+l)
        for (int i = 0; i < windowSize; ++i) {
            STFT[i][l] = shiftedX[i];
        }

    }


    // Clean up
    fftw_destroy_plan(plan);
    fftw_free(in);
    fftw_free(out);

    // 计算频率向量f
    // 计算频率向量f,使其与MATLAB一致
    std::vector<double> f(windowSize);
    for (int k = 0; k < windowSize; k++) {
        f[k] = static_cast<double>(k - windowSize / 2) * fs / windowSize;
    }

    // 计算时间向量t,使其与MATLAB一致
    std::vector<double> t(L);

    for (int i = 0; i < L; i++) {
        t[i] = (windowSize / 2 + i * overlap) / fs;
    }

    return std::make_tuple(STFT, f, t);
}
返回三个容器:STFT,F,T。
3.QT中实现STFT频谱图绘制
STFT_calculator stftCalculator;
auto result = stftCalculator.calculateSTFT(inputData.toStdVector(), windowSize, overlap, samplingRate, windowType);
std::vector<std::vector<std::complex<double>>> STFT = std::get<0>(result);
std::vector<double> f = std::get<1>(result);
std::vector<double> t = std::get<2>(result);
处理STFT计算结果,计算归一化幅度:
std::vector<double> window(windowSize, 1.0); // 默认为矩形窗
switch (windowType) {
// 为每种窗类型计算具体的窗函数
}
double C = std::accumulate(window.begin(), window.end(), 0.0) / windowSize;
std::vector<std::vector<double>> S(STFT.size(), std::vector<double>(STFT[0].size()));
for (size_t i = 0; i < STFT.size(); ++i) {
    for (size_t j = 0; j < STFT[i].size(); ++j) {
        S[i][j] = 20 * std::log10(std::abs(STFT[i][j]) / windowSize / C + 1e-6);
    }
}
在可视化过程中,归一化幅度可以确保图形的色彩映射更为准确和直观。如果不进行归一化,某些幅度值过大或过小的区域可能会导致图形显示效果不佳,使得特定频率成分的变化不明显。
3.1 Qcustomplot进行频谱图绘制
// 创建颜色映射
QCPColorGradient colorGradient;
colorGradient.setColorStopAt(0, Qt::blue);
colorGradient.setColorStopAt(1, Qt::white);

// 创建色彩图层
QCPColorMap *colorMap = new QCPColorMap(ui->STFTPLOT->xAxis, ui->STFTPLOT->yAxis);
colorMap->setKeyAxis(ui->STFTPLOT->xAxis);
colorMap->setValueAxis(ui->STFTPLOT->yAxis);
colorMap->data()->setSize(width,height);
colorMap->data()->setRange(QCPRange(t.front(), t.back()), QCPRange(f.front(), f.back()));
// 记录最小和最大值
double minValue = std::numeric_limits<double>::max();
double maxValue = std::numeric_limits<double>::lowest();


// 填充色彩图层数据
for (int i = 0; i <width; ++i)
{
            for (int j = 0; j < height; ++j)
            {
                double value = S[j][i];
                double tValue = t[i];
                double fValue = f[j];

                colorMap->data()->setCell(i, j, value);
                // 更新最小和最大值
                minValue = std::min(minValue, value);
                maxValue = std::max(maxValue, value);
                qDebug() << "i:" << i << ", j:" << j << ", t:" << tValue << ", f:" << fValue << ", value:" << value;
            }
}
// 设置颜色轴标签
ui->STFTPLOT->xAxis->setLabel("时间(s)");
ui->STFTPLOT->yAxis->setLabel("频率(Hz))");
ui->STFTPLOT->xAxis->setLabelFont(QFont("Arial", 14));
ui->STFTPLOT->yAxis->setLabelFont(QFont("Arial", 14));
// 添加色标
QCPColorScale *colorScale = new QCPColorScale(ui->STFTPLOT);
colorScale->setType(QCPAxis::atRight);
ui->STFTPLOT->plotLayout()->addElement(0, 1, colorScale);
colorScale->setDataRange(QCPRange(minValue, maxValue));
colorScale->axis()->setLabel("幅值");//色条的名
colorScale->axis()->setLabelFont(QFont("Arial", 14));
colorMap->setColorScale(colorScale);
// 显示图例
ui->STFTPLOT->setInteractions(QCP::iRangeDrag|QCP::iRangeZoom);//可拖拽+可滚轮缩放
ui->STFTPLOT->rescaleAxes();
ui->STFTPLOT->replot();
最终实现效果如下:
QT设计的一个简单界面,需要设置窗函数、窗口大小、移动步长。

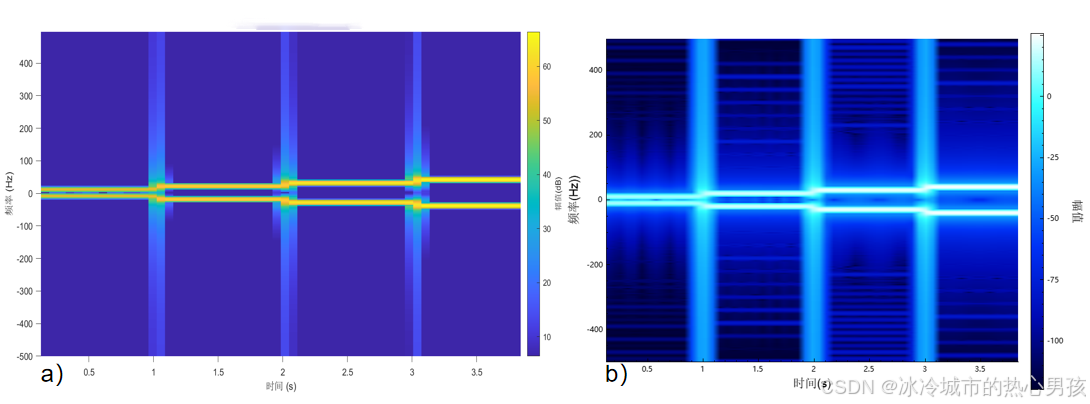
定义测试信号:
其中,信号采样频率为1000Hz,t1表示0-1s,t2表示1—2s,t3表示2—3s,t4表示3—4s。选取STFT的窗口大小为256,移动步长为64,窗函数选择布莱克曼窗,采用MATLAB中的spectrogram函数进行对比验证,结果如图所示(左图为本文实现,右图为MATLAB)。
 需要程序完整源码,请私信博主。


 5155
5155

 被折叠的 条评论
为什么被折叠?
被折叠的 条评论
为什么被折叠?
 到【灌水乐园】发言


