


效果图: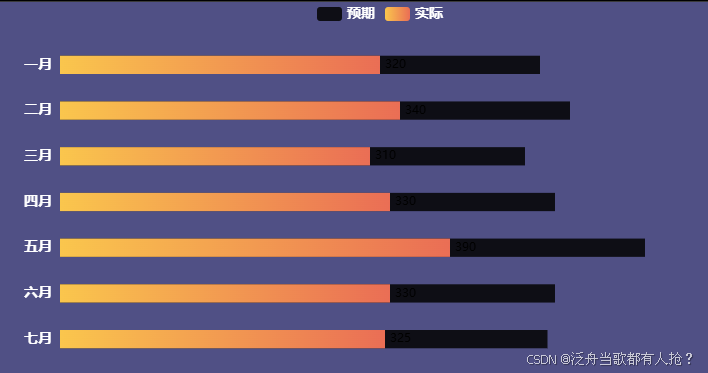
<template>
   <div>
       <div ref="chart" style="width: 800px; height: 400px;background-color: #505085;"></div>
   </div>
</template>

<script>
import * as echarts from 'echarts';
import { color } from 'echarts/lib/export';

export default {
   name: 'EChartBarDemo',
   mounted() {
       this.initChart();
   },
   methods: {
       initChart() {
           const myChart = echarts.init(this.$refs.chart);
           const baseData = [320, 340, 310, 330, 390, 330, 325]; // 确保两组数据值一致

           const option = {
               tooltip: { show: true }, // 关闭悬浮提示
               legend: { show: true, textStyle: {
                        color: '#fff', // 图例字体颜色
                        fontSize: 14,
                        fontWeight: 'bold'
                    } },  // 关闭图例
               grid: {
                   left: '10%',
                   right: '15%',
                   top: '10%',
                   bottom: '10%',
               },
               xAxis: {
                   show: false, // 完全隐藏X轴
                   type: 'value',
                  //  max: 400,    // 强制统一最大宽度
               },
               yAxis: {
                   type: 'category',
                   data: ['一月', '二月', '三月', '四月', '五月', '六月', '七月'],
                   axisLine: { show: false },
                   axisTick: { show: false },
                   inverse: true, // Y轴反向(柱子从右向左生长)
                   axisLabel: {
                        color: '#fff', // y轴字体颜色
                        fontSize: 14,
                        fontWeight: 'bold'
                    }
               },
               series: [
                   // 先渲染背景条(预期)
                   {
                       name: '预期',
                       type: 'bar',
                       //stack: 'total', //官方文档说的堆叠只要stack的value值是一样的就可以堆叠,不支持 'time' 和 'category' 类型的类目轴。 但是我们就是要category类型堆叠所以不能用这个stack
                       itemStyle: {
                           color: '#0e0e15',
                           // borderColor: '#000',
                           // borderWidth: 3,
                           // borderRadius: 20, // 圆角边框
                       },
                       barWidth: '40%',
                       barGap: '-100%', // 强制与主柱子重叠
                       zIndex: 1,
                       data: baseData.map(v => v *1.5), // 略长于主柱子
                   },
                   // 再渲染主柱子(实际)
                   {
                       name: '实际',
                       type: 'bar',
                       itemStyle: {
                           color: new echarts.graphic.LinearGradient(0, 0, 1, 0, [
                               { offset: 0, color: '#fac64d' },
                               { offset: 1, color: '#ea6e55' },
                           ]),
                           borderRadius: 20, // 圆角与背景条一致
                       },
                       barWidth: '40%',
                       zIndex: 2,
                       label: {
                           show: true,
                           position: 'right',
                           formatter: '{c}',
                           fontSize: 12,
                           // fontWeight: 'bold',
                           // color: '#FFF',
                       },
                       data: baseData,
                   }
               ],
           };

           myChart.setOption(option);
           window.addEventListener('resize', () => myChart.resize());
       },
   },
};
</script>


 被折叠的 条评论
为什么被折叠?
被折叠的 条评论
为什么被折叠?
 到【灌水乐园】发言


