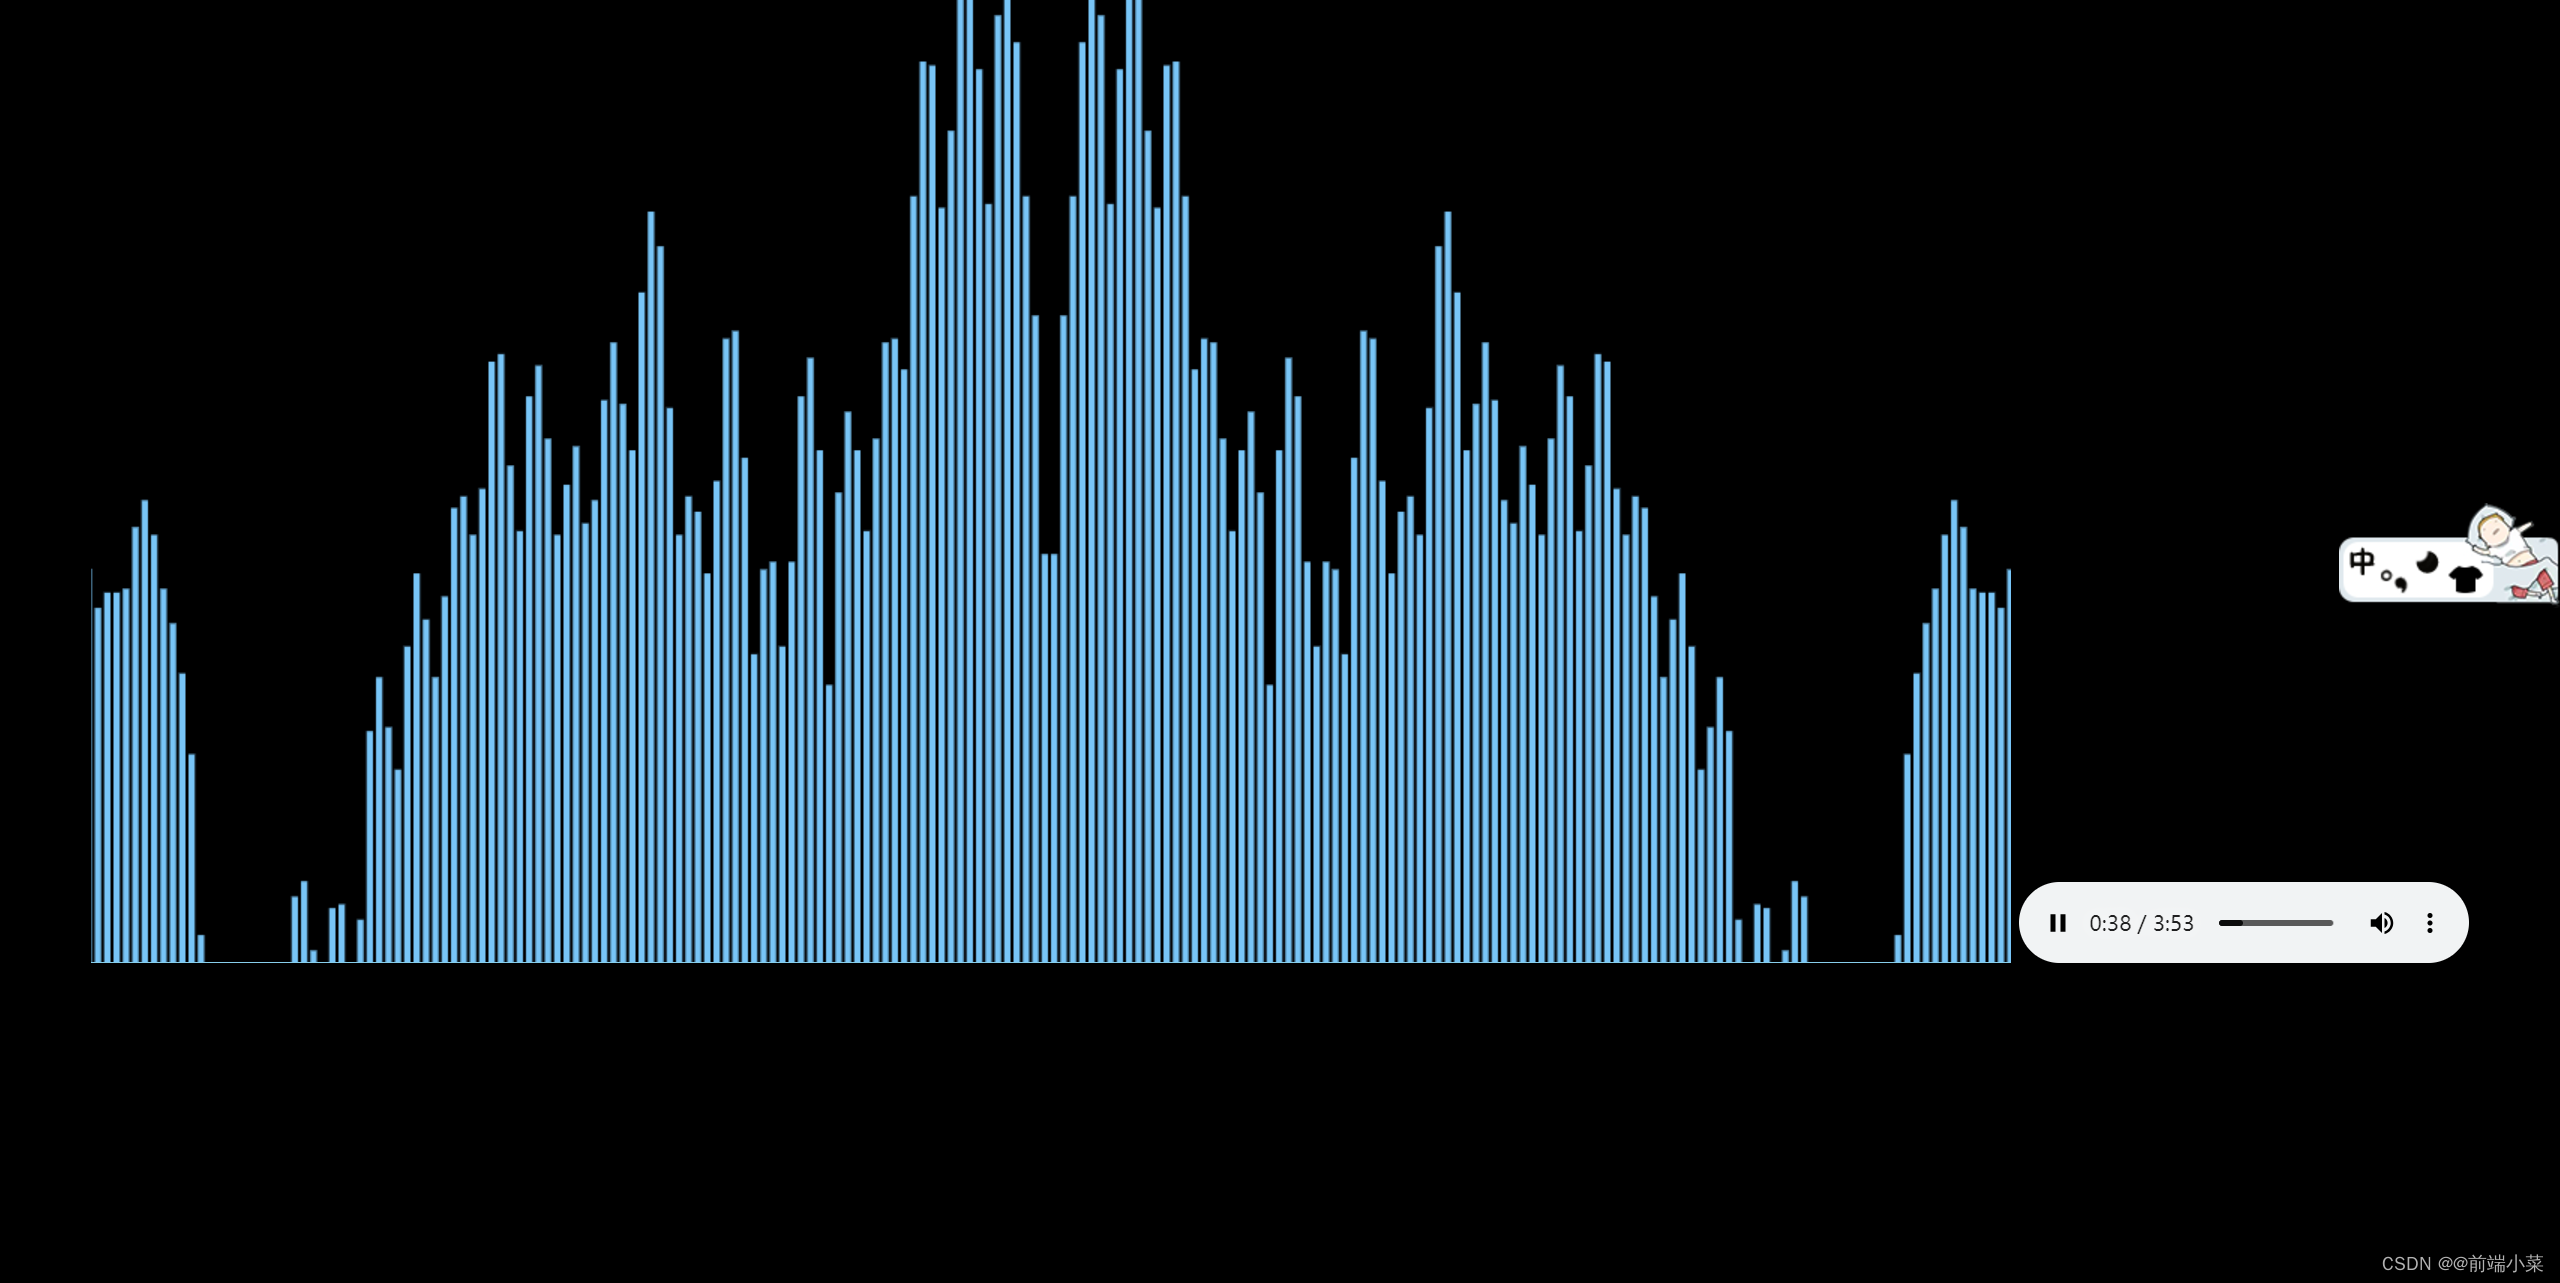
效果图:
<!DOCTYPE html>
<html lang="en">
<head>
  <meta charset="UTF-8">
  <meta http-equiv="X-UA-Compatible" content="IE=edge">
  <meta name="viewport" content="width=device-width, initial-scale=1.0">
  <title>Document</title>
</head>
<style>
  * {
    padding: 0;
    margin: 0;
    background-color: #000;
    text-align: center;
  }
  canvas {
    border-bottom: 1px solid skyblue;
  }
</style>
<body>
  <canvas></canvas>
  <audio
    crossorigin="anonymous"
    src="./M500004bfQ2t3H8Cn0.mp3" controls></audio>

  <script>
    const audio = document.querySelector('audio')
    const cvs = document.querySelector('canvas')
    const ctx = cvs.getContext('2d')
    // 初始化 canvas 尺寸
    function initCvs() {
      cvs.width = (window.innerWidth / 2) * devicePixelRatio
      cvs.height = (window.innerHeight / 2) * devicePixelRatio
    }
    initCvs()

    let isInit = false
    let dataArray, analyser
    audio.onplay = function () {
      if(isInit) {
        return
      }

      // 初始化
      const audioCtx = new AudioContext()   // 创建音频上下文
      const source = audioCtx.createMediaElementSource(audio)  // 创建音频源节点

      analyser = audioCtx.createAnalyser()   // 创建分析器
      analyser.fftSize = 512  // 设置分析器的 fft 大小
      // // // 创建数组,用于接受分析器的数据
      dataArray = new Uint8Array(analyser.frequencyBinCount)
      source.connect(analyser)  // 连接分析器
      analyser.connect(audioCtx.destination)  // 连接音频上下文和分析器

      isInit = true
    }

    audio.onpause = () => {
      isInit = false
    }

    function draw() {
      requestAnimationFrame(draw)

      // 清空画布
      const { width, height} = cvs
      ctx.clearRect(0, 0, width, height)
      if(!isInit) {
        return
      }

      // 从分析器节点分析出数据到数组中
      analyser.getByteFrequencyData(dataArray)

      const len = dataArray.length / 2.5
      // 每个柱子的宽度
      const barWidth = width / len / 2
      for (let i = 0; i < len; i++) {
        const data = dataArray[i] // <256
        const barHeight = data / 250 * height
        // 二个 x 点画出对称图形
        const x1 = i * barWidth + width / 2
        const x2 = width / 2 - (i + 1) * barWidth
        const y = height - barHeight
        ctx.fillStyle = '#78C5F7'
        ctx.fillRect(x1, y, barWidth - 2, barHeight)
        ctx.fillRect(x2, y, barWidth - 2, barHeight)

      }
      console.log(dataArray);

    }

    draw()
  </script>
</body>
</html>


 6185
6185


 被折叠的 条评论
为什么被折叠?
被折叠的 条评论
为什么被折叠?
 到【灌水乐园】发言


