


if 语句:
x=32;y=86;
if x>y
    'dss'
elseif x<y
    "dzz"
else
    "error"
end
循环语句
for 循环变量 = 起始值 : 步长 : 终止值
   循环体
end
a=0;
for i=1:1:10
    a = a+i;
end
a
while    表达式
     循环体
end
a=0;
num=0;
while num<10
    a=a+1;
    num=num+1;
end

num
matlab 绘图
绘图的基本步骤:
x = -pi:.1:pi;
y1 = sin(x);
y2 = cos(x);        %准备绘图数据
figure(1)           %打开图形窗口
subplot(2,1,1)      %确定第一幅图绘图窗口
plot(x,y1)          %以x,y1绘图
title('绘图的基本步骤') %为第一幅图设置标题:"绘图的基本步骤"
grid on             %显示网格线

subplot(2,1,2)      %确定第二幅图绘图窗口
plot(x,y2)          %以x,y2绘图
xlabel('time')      %为第二幅设置x坐标名'time'
ylabel('y')         %为第二幅设置y坐标名'y'

figure(2)           %打开图形窗口
subplot(1,2,1),stem(x,y1,'r')       %绘制红色的脉冲图
subplot(1,2,2),errorbar(x,y1,'g')   %绘制绿色的误差条形图
关于plot:
plot 的格式:
plot(y) 直接打点图
plot(x,y)正常绘制二维坐标图
plot(x,y1,x2,y2…) 在同一个坐标里绘制好几个曲线
x=-pi:.1:pi;
y1=sin(x)
y2=cos(x)
figure(1)
subplot(3,1,1)
plot(x,y1)
subplot(3,1,3)
y3=[1,2,3,4,5];
plot(y3)
subplot(3,1,2)
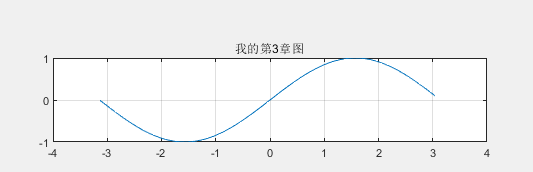
plot(x,y1,x,y2)
title("我的第3章图")
grid on

关于subplot:
subplot是将多个图画到一个平面上的工具。其中,m表示是图排成m行,n表示图排成n列,也就是整个figure中有n个图是排成一行的,一共m行,如果m=2就是表示2行图。p表示图所在的位置,p=1表示从左到右从上到下的第一个位置。
比如: subplot(3,3,1)
可以看出它其实已经留好九个图的位置了
如果你在一个代码里改了
它没有覆盖的话就算是你删了代码它还在上面

grid on
出现网格线:
标题&x,y轴标题
title('绘图的基本步骤') %为第一幅图设置标题:"绘图的基本步骤"
xlabel('time')      %为第二幅设置x坐标名'time'
ylabel('y')         %为第二幅设置y坐标名'y'


 8093
8093


 被折叠的 条评论
为什么被折叠?
被折叠的 条评论
为什么被折叠?
 到【灌水乐园】发言


