


目录
指标拆解:从游戏题材、出版商、发行年份、地区对营收方面的表现进行比较
导入库
import numpy as np
import pandas as pd
import matplotlib.pyplot as plt
数据摸底
#读取文件
df=pd.DataFrame(pd.read_csv('vgsales.csv'))

#初步了解
print(df.info())
print(df.describe())

#检查空值
print(df.isnull().any())
print(df.isnull().sum())
指标计算
1.不同体裁的游戏在营收方面的表现
(纵向对比,即比较不同的平台在同一方面的营收情况)
genre_sale=df.groupby('Genre').agg(NAsales=('NA_Sales','sum'),EUsales=('EU_Sales','sum'),
JPsales=('JP_Sales','sum'),Othsales=('Other_Sales','sum'),
Glosales=('Global_Sales','sum')).sort_values(by='Genre')
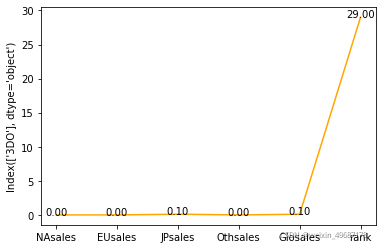
1.1全球销量排名
genre_sale['rank']=genre_sale['Glosales'].rank(method='min',ascending=False)
1.2全球销量排名前三的体裁
print(genre_sale.query('rank<=3'))
1.3绘图
1.3.1折线图
plt.figure()
x=genre_sale.index
y=genre_sale['Glosales']
z=genre_sale['Othsales']
plt.xticks(rotation=30)
plt.plot(x, y,label='glo')
plt.plot(x,z,label='oth')
plt.legend()
for a,b in zip(x,y):
plt.text(a,b+10,'%.2f' % b,ha='center')
for a,b in zip(x,z):
plt.text(a,b+10,'%.2f' % b,ha='center')
plt.figure()
c=genre_sale['NAsales']
d=genre_sale['EUsales']
e=genre_sale['JPsales']
plt.plot(x,c,label='NA')
plt.plot(x,d,label='EU')
plt.plot(x,e,label='JP')
plt.legend()
plt.xticks(rotation=30)
1.3.2条形图(结构条形图)
plt.figure()
plt.bar(x,c,label='NA',color='pink')
plt.bar(x,d,label='EU',color='purple')
plt.bar(x,e,label='JP',color='lightblue')
plt.legend()
plt.xticks(rotation=30)
for a,b in zip(x,c):
plt.text(a,b,'%.2f' % b,ha='center')
1.4评级
def sale_label(x):
if x>np.mean(genre_sale['Glosales']):
return 'high'
else:
return 'low'
genre_sale['label']=genre_sale['Glosales'].apply(lambda x:sale_label(x))
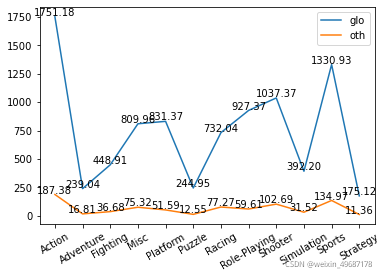
在全球营收方面,动作类、体育类、射击类游戏营收最高,考虑与游戏市场的受众有关。游戏市场中男性用户占比较大,其游戏偏好偏向上述题材。
在其他营收方面,各题材类型差异相对较小,与其他营收在总营收中占比较小有关。动作类、体育类的营收优势较为明显,同样反映出用户的题材偏好。
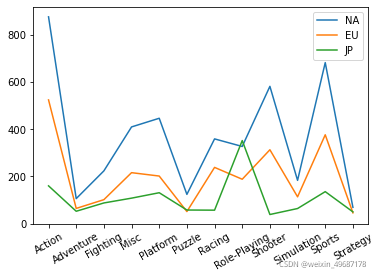
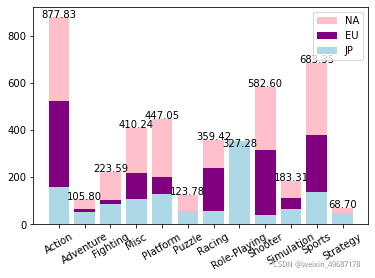
各题材在北美与欧洲的营收曲线较为一致, 仍是动作、射击、体育类题材占优势,用户偏好明显。
但在日本市场,角色扮演类型的游戏营收最高且营收优势明显,其他题材的游戏营收差别较小,考虑与日本普遍性较高的动漫文化有关。日本独特的文化环境塑造出日本市场独特的游戏偏好,因此针对日本的游戏市场策略需要与其他国家有所区分。推测以动漫为出发点衍生出的游戏在日本会具有较多的受众。
2.不同平台在营收方面的表现
plat_sale=df.groupby('Platform').agg(NAsales=('NA_Sales','sum'),EUsales=('EU_Sales','sum'),
JPsales=('JP_Sales','sum'),Othsales=('Other_Sales','sum'),
Glosales=('Global_Sales','sum'))
2.1纵向对比,即比较不同的平台在同一方面的营收情况
plat_sale['rank']=plat_sale['Glosales'].rank(method='min',ascending=False)
plt.figure()
for i in range(plat_sale.shape[1]):
x1=plat_sale.index
y1=plat_sale.iloc[:,i]
plt.bar(x1,y1,color='orange')
plt.xticks(rotation=90)
plt.ylabel(plat_sale.columns[i])
plt.show()
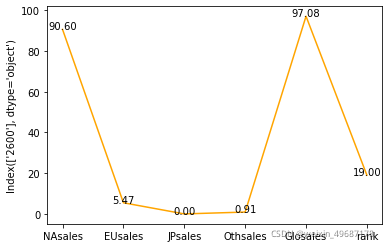
2.2横向对比,即比较同一平台在不同方面的营收情况
for i in range(len(plat_sale)):
f1=pd.DataFrame(plat_sale.iloc[i,:])
plt.plot(f1,color='orange')
plt.ylabel(f1.columns)
for n,g in zip(f1.index,f1.iloc[:,0]):
plt.text(n,g,'%.2f' % g,ha='center')
plt.show()
纵向
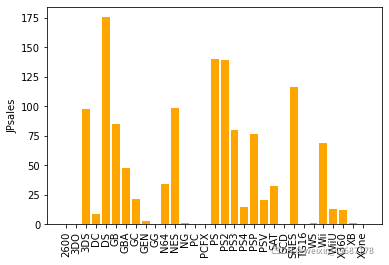
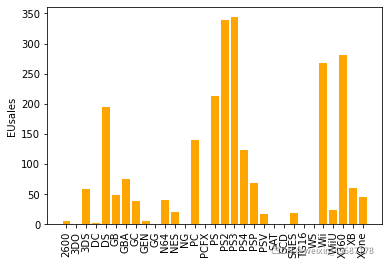
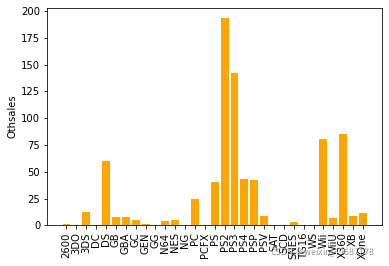
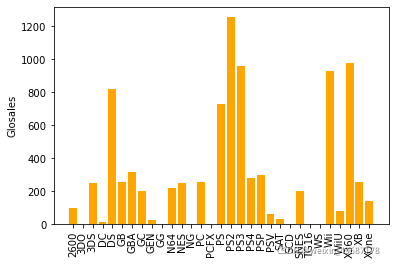
不同平台在不同地区的营收表现不同,峰值主要集中在PS、DS、Wii
DS在日本市场表现最好,但其欧美市场仍然需要开拓
在其他方面的营收,各个平台的表现差异最大
PS在欧洲营收、全球营收、总营收表现最好
横向
3.不同出版商在营收方面的表现

3.1分组计算
pub_sale=df.groupby('Publisher').agg(NAsales=('NA_Sales','sum'),EUsales=('EU_Sales','sum'),
                                   JPsales=('JP_Sales','sum'),Othsales=('Other_Sales','sum'),
                                   Glosales=('Global_Sales','sum'))

3.2排名
pub_sale['rank']=pub_sale['Glosales'].rank(method='min',ascending=False)
pub_sale_20=pub_sale.query('rank<=20')

3.3画图
plt.figure()
x2=pub_sale_20.index
y2=pub_sale_20['Glosales']
plt.plot(x2,y2,color='orange')
plt.xticks(rotation=90)
for a,b in zip(x2,y2):
plt.text(a,b+10,'%.2f' % b,ha='center') 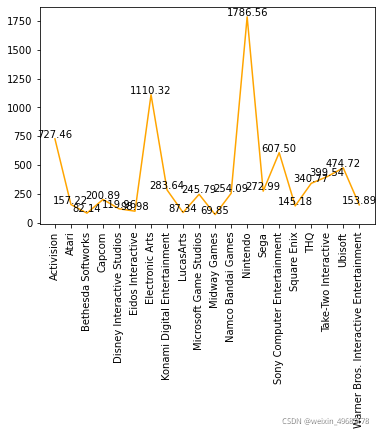
不同出版商在总营收方面的表现差异较大,存在一定程度上的垄断。
对于营收较低的出版商,可根据用户的游戏偏好推出相应类型的游戏,开拓市场。
4.不同年份在营收方面的的表现

4.1给年份分组

def year_group(x):
    if x<=1990:
        return '1980-1990'
    elif x<=2000:
        return '1991-2000'
    elif x<=2010:
        return '2001-2010'
    else:
        return '2011-2020'

list1=[]
for i in df['Year']:
    a=year_group(i)
    list1.append(a)
df['year_group']=list1

  #另一种写法
  #df['year_group']=df['Year'].apply(lambda x:year_group(x))

4.2分组计算

year_sale=df.groupby('year_group').agg(NAsales=('NA_Sales','sum'),EUsales=('EU_Sales','sum'),
                                   JPsales=('JP_Sales','sum'),Othsales=('Other_Sales','sum'),
                                   Glosales=('Global_Sales','sum'))

4.3画图
plt.figure()
for i in range(year_sale.shape[1]):
    x2=year_sale.index
    y2=year_sale.iloc[:,i]
    plt.plot(x2,y2,label=year_sale.columns[i])
    for a,b in zip(x2,y2):
        plt.text(a,b,'%.2f' % b,ha='center')
    plt.legend()
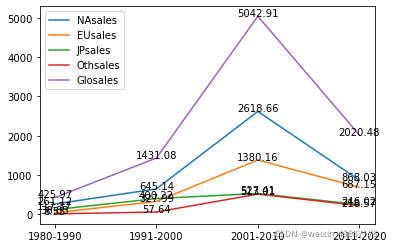
各地区的营收趋势较为一致,2001-2010年,游戏行业发展迅速,各地区营收迅速上升,但在2010年之后,各地区游戏行业营收水平有所下降。推测可能一方面由于全球化其他行业的发展,游戏行业受到冲击,另一方面与各地区推出的游戏、经济政策有关。
5.不同游戏在营收方面的表现

5.1分组计算
game_sale=df.groupby('Name').agg(NAsales=('NA_Sales','sum'),EUsales=('EU_Sales','sum'),
                                   JPsales=('JP_Sales','sum'),Othsales=('Other_Sales','sum'),
                                   Glosales=('Global_Sales','sum'))

5.2游戏在不同国家营收的排名
for i in range(game_sale.shape[1]):
    coname=game_sale.columns
    game_sale[coname[i]+'_rate']=game_sale.iloc[:,i].rank(method='min',ascending=False)

5.3取出不同国家营收排名前十的游戏
for i in range(5,10):
    outn=game_sale[game_sale.iloc[:,i]<=10].iloc[:,i]
    print(outn)
6.不同体裁在不同渠道的总营收以及占比
6.1营收
6.1.1数据透视表的写法
gen_pla=pd.pivot_table(df,values='Global_Sales',index='Genre',columns='Platform',aggfunc=np.sum).fillna(0)
6.1.2分组求和写法
gen_pla_rate=df.groupby(['Genre','Platform']).sum()['Global_Sales'].unstack().fillna(0)
gen_pla_rate['total']=np.sum(gen_pla_rate,axis=1)
6.2占比
new=pd.DataFrame(index=gen_pla_rate.index,columns=gen_pla_rate.columns)
for i in gen_pla_rate.columns:
new[i]=round(gen_pla_rate[i]/gen_pla_rate['total'],2)
6.3画图(横向画图,列名是横坐标)
plt.figure()
for i in range(0,8):
table1=pd.DataFrame(gen_pla_rate.iloc[i,:])
plt.plot(table1)
plt.xticks(rotation=90)
for n,g in zip(table1.index,table1.iloc[:,0]):
plt.text(n,g,'%.2f' % g,ha='center')
plt.show()
#如果不写plt.show,会都画在一张图里
7.不同体裁在不同年份的总营收表现

7.1分组计算

gen_year_rate=df.groupby(['Genre','year_group']).sum()['Global_Sales'].unstack().fillna(0)
gen_year_rate['total']=np.sum(gen_year_rate,axis=1)

7.2不同年份营收在体裁总营收的占比

for i in range(0,4):
    colname=gen_year_rate.columns
    gen_year_rate[colname[i]+'rate']=round(gen_year_rate.iloc[:,i]/gen_year_rate['total'],2)

7.3画图

#画图(纵向画图,行名是横坐标)
for i in range(0,5):
    colabel=gen_year_rate.columns
    x3=gen_year_rate.index
    y3=gen_year_rate.iloc[:,i]
    plt.plot(x3,y3,label=colabel[i])
    plt.legend()
    plt.xticks(rotation=75)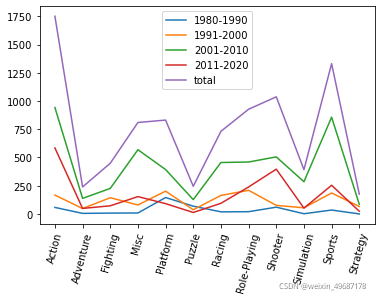
不同年份,各个游戏题材的全球营收情况有一定程度的差异 ,例如动作类游戏在1980-2000年营收表现并不优秀,但自2001年开始,其全球营收最高。即该题材游戏自2000年热度开始上升。射击类游戏同样如此。运动类游戏、角色扮演类游戏从1991年开始有所发展。platform类型的游戏在1980-2000年营收表现较好,自2001年开始衰落,推测可能是受到其他几种游戏类型的冲击。
8.不同平台在不同年份的总营收表现

8.1分组计算

pla_year_rate=df.groupby(['Platform','year_group']).sum()['Global_Sales'].unstack().fillna(0)
pla_year_rate['total']=np.sum(pla_year_rate,axis=1)


8.2计算占比

for i in range(0,4):
    colname=pla_year_rate.columns
    pla_year_rate[colname[i]+'_rate']=round(pla_year_rate.iloc[:,i]/pla_year_rate['total'],2)

8.3判断占比大小

def high_low(x):
    if x>=0.5:
        return 'high'
    elif x>=0.3:
        return 'middle'
    else:
        return 'low'

for i in range(5,9):
    colname=pla_year_rate.columns
    pla_year_rate[colname[i]+'_value']=pla_year_rate.iloc[:,i].apply(lambda x:high_low(x))

8.3依次按照每一年的占比大小分组,并计数

for i in range(9,13):
    a=pd.DataFrame(pla_year_rate.groupby(pla_year_rate.iloc[:,i]).count()['1980-1990'])
    print(a)
9.不同出版尚在不同年份的总营收表现

pub_year_rate=df.groupby(['Publisher','year_group']).sum()['Global_Sales'].unstack().fillna(0)
pub_year_rate['total']=np.sum(pub_year_rate,axis=1)

9.1占比

for i in range(0,4):
    colname=pub_year_rate.columns
    pub_year_rate[colname[i]+'_rate']=round(pub_year_rate.iloc[:,i]/pub_year_rate['total'],2)

9.2判断占比的大小

for i in range(5,9):
    colname=pub_year_rate.columns
    pub_year_rate[colname[i]+'_value']=pub_year_rate.iloc[:,i].apply(lambda x:high_low(x))

9.3一次按照每一年的占比大小分组,并计数
for i in range(9,13):
    a=pd.DataFrame(pub_year_rate.groupby(pub_year_rate.iloc[:,i]).count()['1980-1990'])
    print(a)
小结
总的来说,用户的游戏题材偏好较为明显,总体上体育、动作、射击类型的游戏营收较多,但同时,不同地区的题材偏好也有所区别,例如日本市场更偏向角色扮演类的游戏,这与其地域文化存在联系,因此,针对不同的地区,应制定不同的游戏策略。
此外,就出版商而言,游戏行业存在一定程度的垄断,即整体上不同出版商差异较大,营收较高的出版商数量较少。
最后,在趋势上,不同题材的游戏类型其营收状况也会随时间发生改变,目前受众较多的游戏类型大多是从2000年后开始流行,而在1980年-2000年流行的游戏题材在2000年之后其热度开始下降。


 413
413

 被折叠的 条评论
为什么被折叠?
被折叠的 条评论
为什么被折叠?
 到【灌水乐园】发言


