


项目改造适配不同分辨率
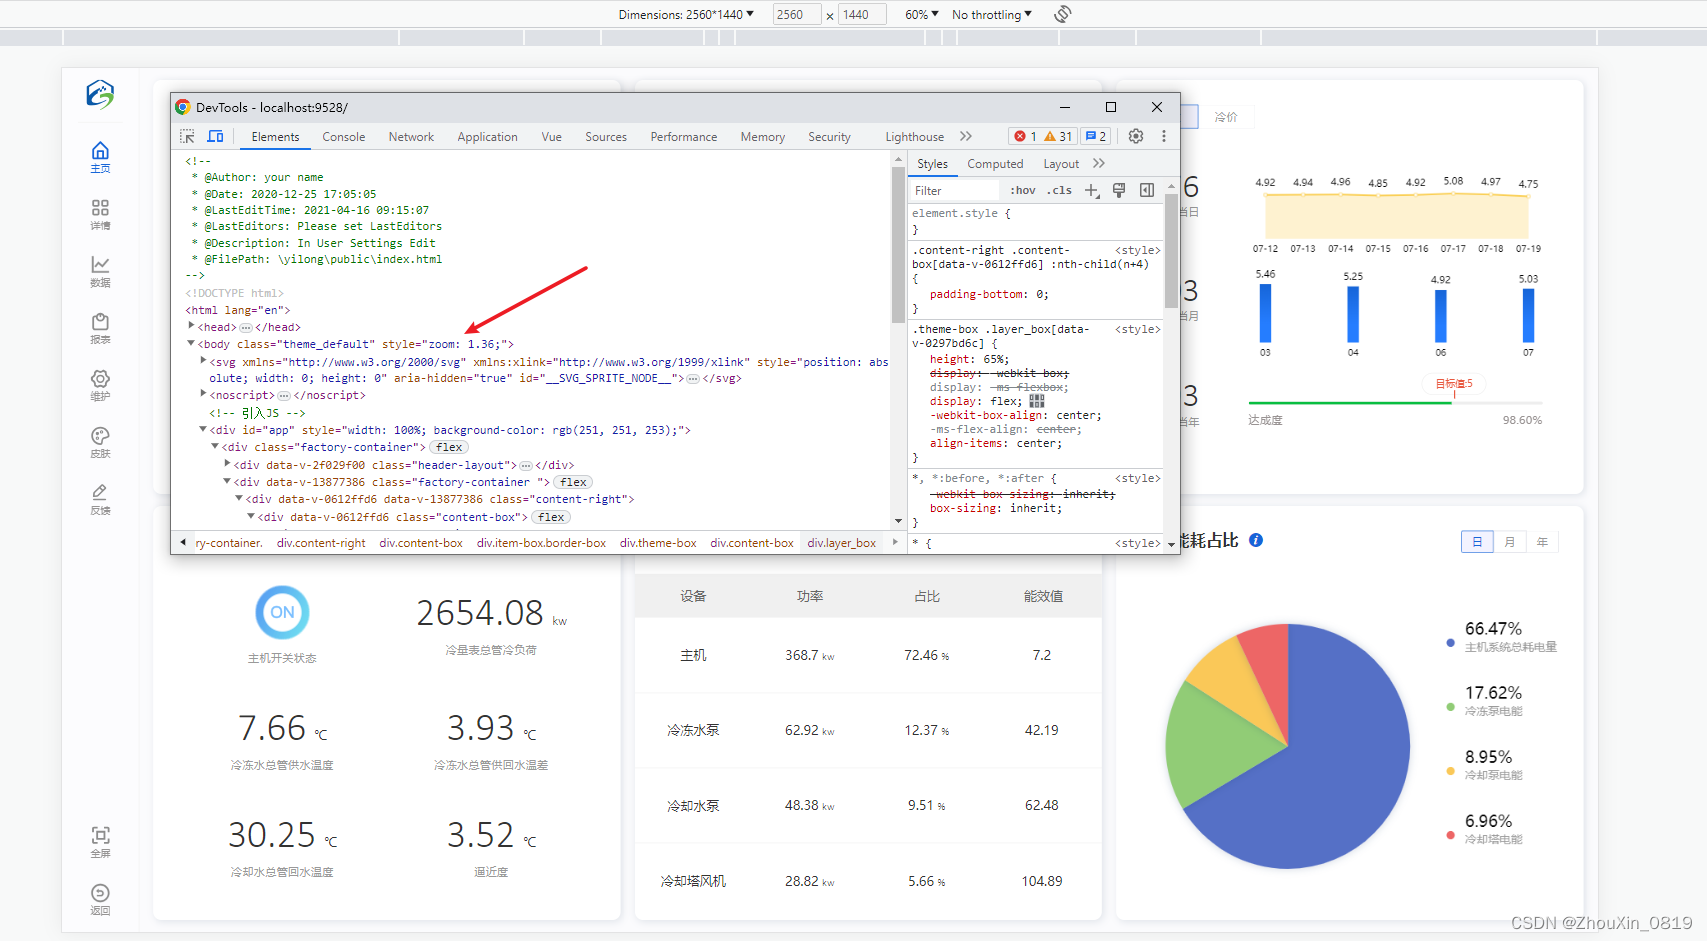
最近公司要做项目适配2k、3k、4k屏的分辨率,在网上找了很多中方案,常用且方便的是使用zoom全局缩放,因为是老项目所以对样式进行了重写整体使用了flex+百分比布局
- 使用
1、在utils文件夹中新建一个zoom.js文件 这个是我自己设置的一个缩放比例,具体大小可根据实际项目具体效果微调
export function setRem () {
    // 2560*1440 2k
    // 2560*1600 2k
    // 3200*1800 3k
    // 3840*2160 4k
    // 3840/1920 = 2
    const max = window.innerWidth;
    if(max>=3840) {
        document.body.style.zoom = 2;
    }else if(max>=2600&&max<3840){
        document.body.style.zoom = 1.65;
    }else if(max>=2400&&max<2600){
        document.body.style.zoom = 1.36;
    }else if(max>=1900&&max<2400){
        document.body.style.zoom = 1;
    }else if(max>=1600&&max<1900){
     document.body.style.zoom = 0.8;
    }else if(max>=1200&&max<1600){
     document.body.style.zoom = max / 1600;
    }else if(max>=800&&max<1200){
     document.body.style.zoom = max/1600;
    }else if(max>=500&&max<800){
     document.body.style.zoom = max / 800
    }else{
     document.body.style.zoom = max / 450;
    }
}
2、在main.js中导入使用
import { setRem } from './utils/zoom';
setRem();
3、效果图
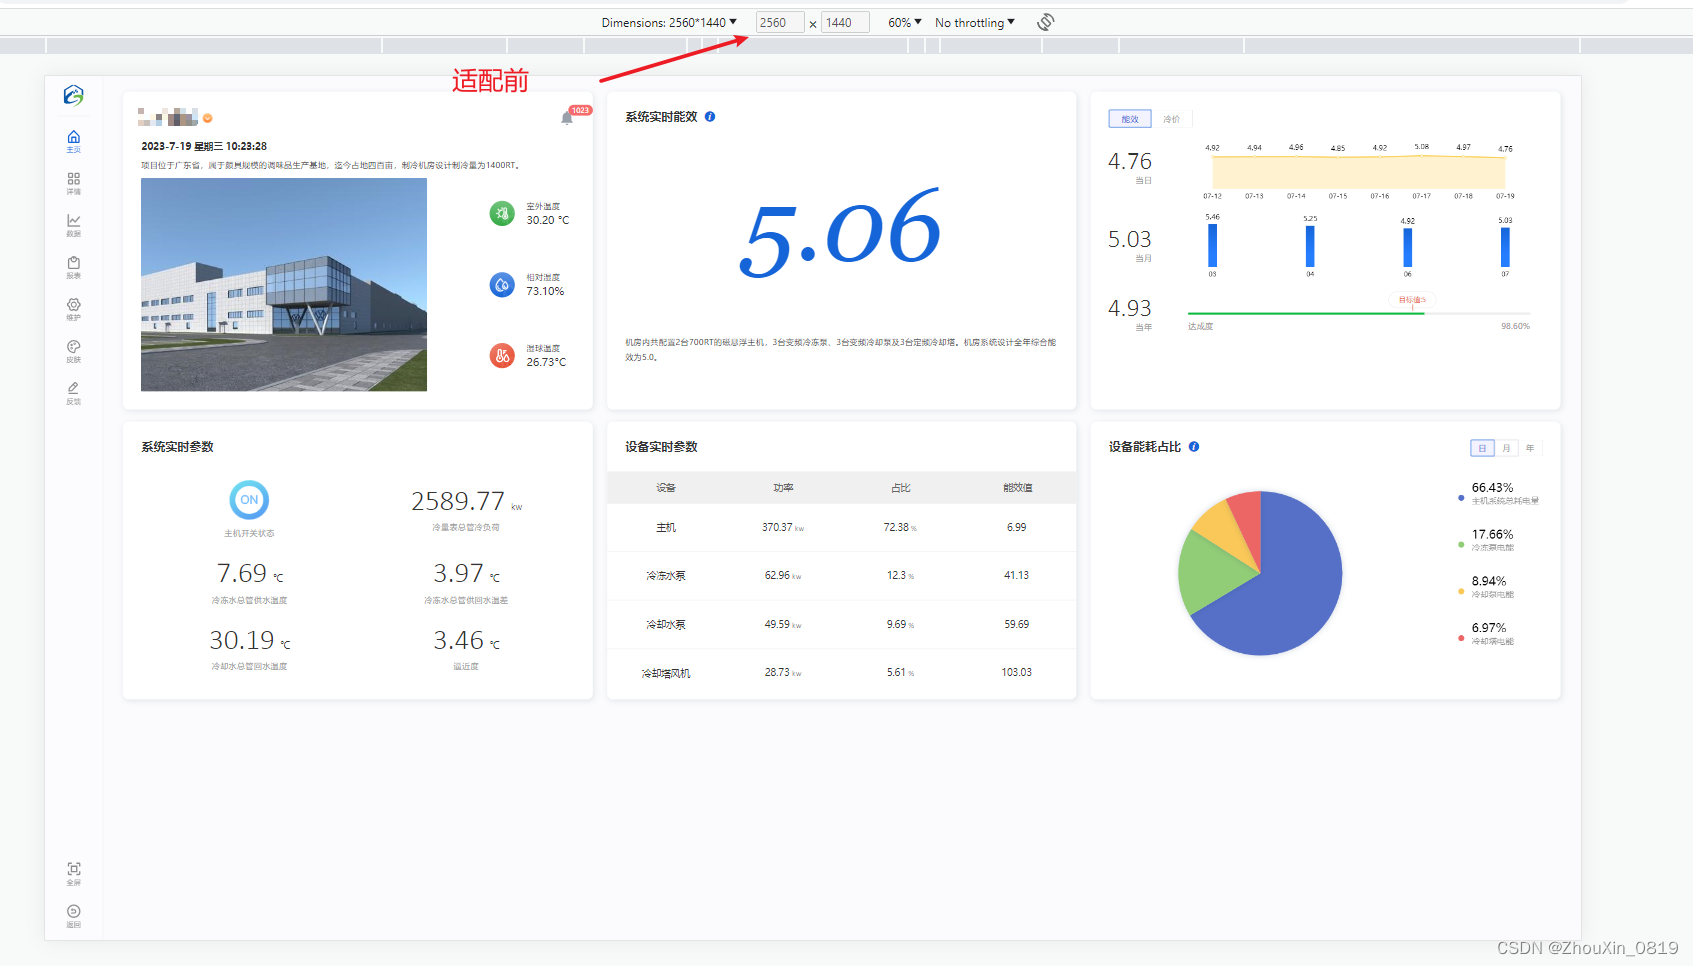
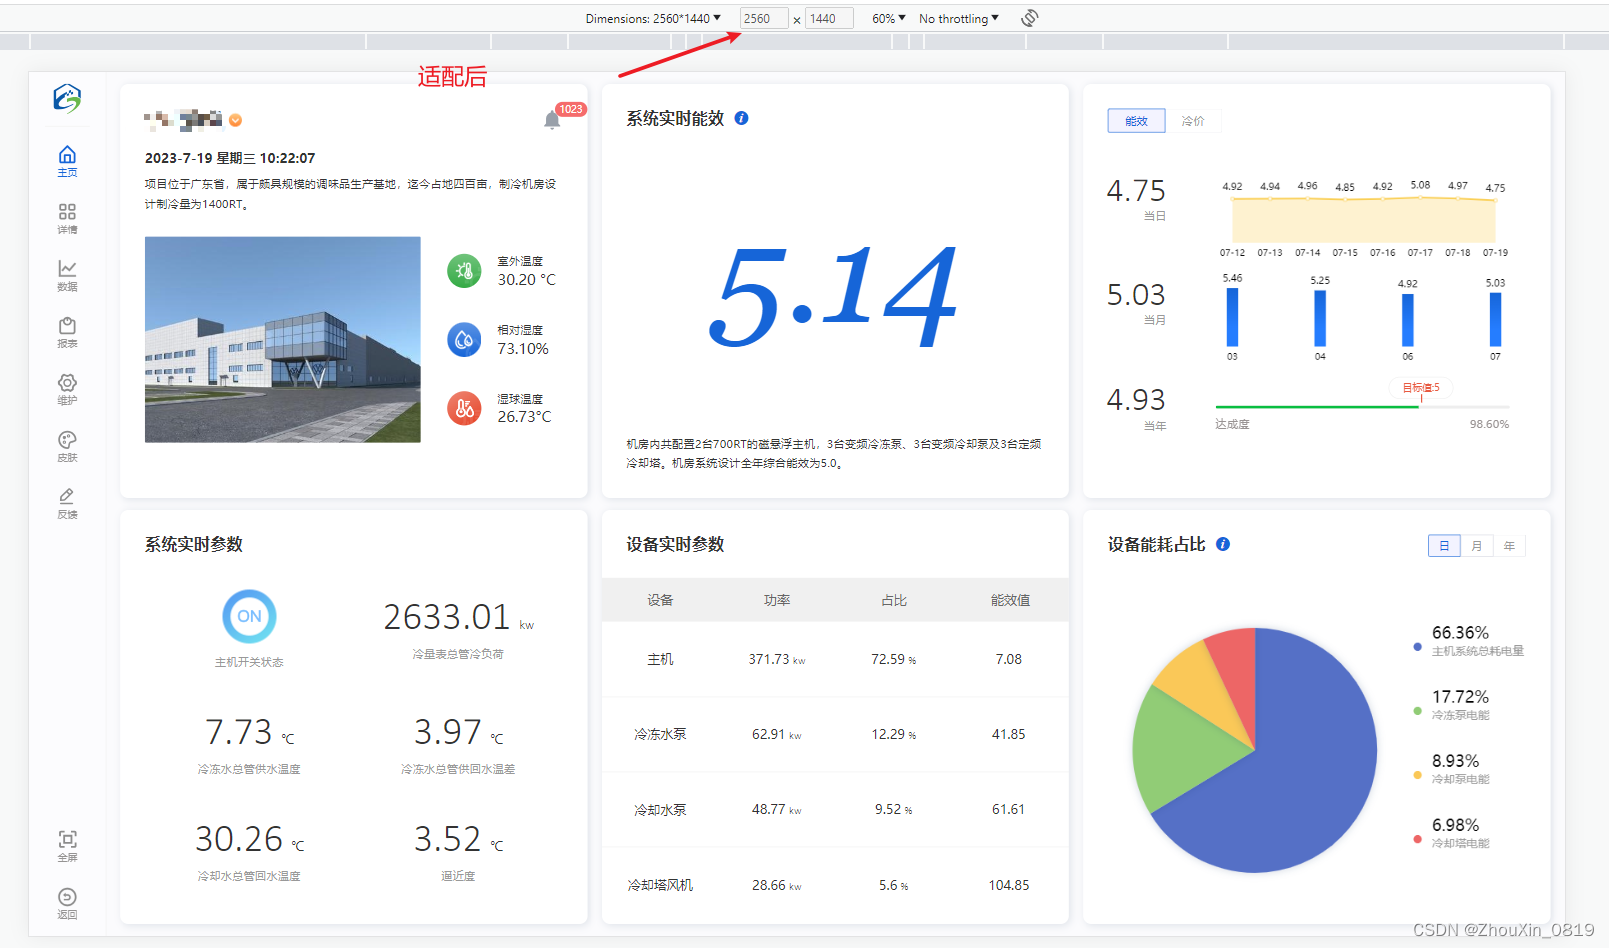
4、整体布局使用了flex布局或者使用百分比或者用elementui的栅格布局页面就不会乱在对整体内容的缩放效果就会很好。
适配后出现的其他问题
因为我这个项目中使用了好多echarts图表,全局使用zoom缩放导致echarts位置错位(比如鼠标经过饼图区域没反应或者鼠标经过饼图红色区域显示的是蓝色区域的数据等错位问题)
- 定义一个容器用于存放echarts
//外层盒子
 <div class="pie-chart">
 		//echarts 容器
        <div id="pieCharts" :style="`width: 100%;height:100%; zoom:${zoomrAtio};transform:scale(${zoom});transform-origin:0px 0px;`" />
 </div>
- 在data中定义两个变量
data() {
    return {
      zoom: '',
      zoomrAtio: '',
    };
  },
- 在初始化容器后再进行添加
 getPieEcharts() {
      const _this = this;
      var pieData = _this.pieList.sort(_this.compare("value", false));
      const pieEcharts = this.$echarts.init(
        document.getElementById("pieCharts")
      );
      const option = {
        tooltip: {
          trigger: "item",
          borderWidth: 0,
          formatter: function (param) {
            return `${param.marker}${param.name}: ${param.value.toFixed(
              2
            )}kwh, 占比: ${param.percent}%`;
          },
          backgroundColor: "rgba(255,255,255,1)",
          extraCssText: "box-shadow:0 0 10px rgba(0,120,234,0.1);color:#333333;font-size:16px",
          textStyle: {
            fontSize: 24,
            lineHeight: 50,
          },
          padding: [5, 15],
        },
        color: [
          "#5570c6",
          "#91cc76",
          "#fac858",
          "#ed6666",
          "#73c0de",
          "#3ba272",
          "#fc8352",
          "#9a61b4",
          "#ecc49f",
        ],
        legend: {
          type: "plain",
          orient: "vertical",
          icon: "circle",
          show: true,
          right: "0%",
          top: "center",
          itemHeight: 10,
          itemGap: 10,
          formatter: function (name) {
            var total = 0;
            var target;
            for (var i = 0, l = _this.pieList.length; i < l; i++) {
              total += _this.pieList[i].value;
              if (_this.pieList[i].name === name) {
                target = _this.pieList[i].value;
              }
            }
            var arr = [];
            if (target === 0) {
              arr = ["{a|" + 0 + "%}", "{b|" + name + "\n}"];
            } else {
              arr = [
                "{a|" + ((target / total) * 100).toFixed(2) + "%}",
                "{b|" + name + "\n}",
              ];
            }
            return arr.join("\n");
          },
          textStyle: {
            // label: { show: true },
            color: this.echartfc,
            padding: this.pieList.length == 5 ? [0, 10, -10, 0] : [26, 10, -10, 0],
            rich: {
              a: {
                fontSize: 20,
                verticalAlign: "top",
                align: "left",
                lineHeight: 26,
                fontWeight: 400,
              },
              b: {
                fontSize: 14,
                align: "left",
                color: "#999999",
                lineHeight: this.pieList.length == 5 ? 14 : 30,
                padding: this.pieList.length == 5 ? [20, -10, 20, 0] : [0, -10, 20, 0],
              },
            },
          },
        },
        series: [
          {
            type: "pie",
            radius: "76%",
            center: ["35%", "50%"],
            data: pieData,
            // roseType: 'radius',
            // 最小的扇区角度(0 ~ 360),用于防止某个值过小导致扇区太小影响交互
            label: {
              show: false,
              position: "inside",
              formatter: "{b}:{d}%",
            },
            itemStyle: {
              shadowBlur: 10,
              shadowColor: "rgba(9, 45, 97, 0.2)",
              shadowOffsetX: 0,
              shadowOffsetY: 0,
            },
          },
        ],
      };
      pieEcharts.setOption(option);
      //上面的不用管
      //核心代码区域 zoom  zoomrAtio 变量一点要等echarts初始化完成后再加上才有效果,
      this.$nextTick(()=>{
        this.zoom =  document.body.style.zoom;
        this.zoomrAtio =  (1/document.body.style.zoom).toFixed(2);
      });
    },
添加上面代码后在不同分辨率情况下鼠标经过移动点击都能正常显示了


 950
950


 被折叠的 条评论
为什么被折叠?
被折叠的 条评论
为什么被折叠?
 到【灌水乐园】发言


