


亲测: 官方文档:图表缩放 | Highcharts 使用教程
一、引入
1、安装依赖于highcharts
npm install highcharts --save2、安装完成后,进入项目main.js进行配置:
import highcharts from 'highcharts'因为我们需要使用3d图表,main.js还需要引入:
import highcharts3d from 'highcharts/highcharts-3d'在main.js 中,调用3d图表:
highcharts3d(highcharts)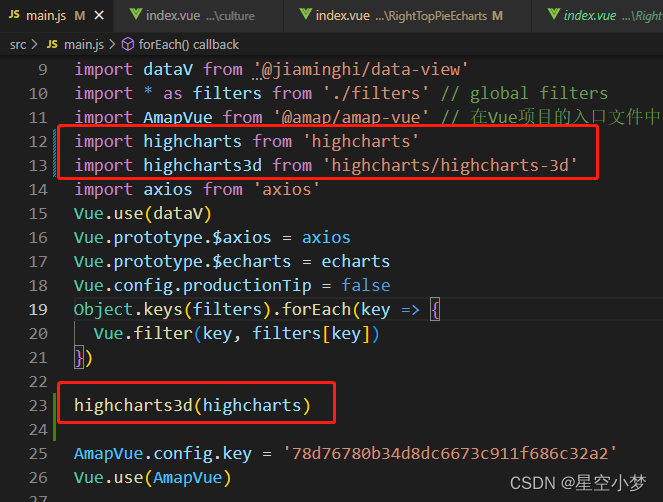
二、页面画图

import HighCharts from "highcharts";方法一:
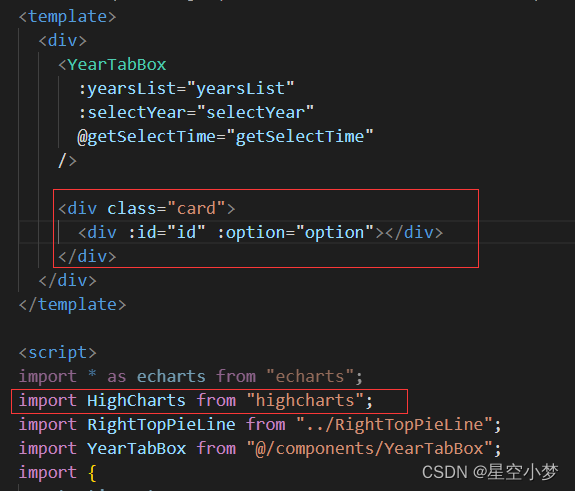
配置参考:https://www.jb51.net/article/134744.htm
方法一完整代码:
<template>
<div>
<YearTabBox
:yearsList="yearsList"
:selectYear="selectYear"
@getSelectTime="getSelectTime"
/>
<div class="card">
<div :id="id" :option="option"></div>
</div>
</div>
</template>
<script>
import * as echarts from "echarts";
import HighCharts from "highcharts";
import RightTopPieLine from "../RightTopPieLine";
import YearTabBox from "@/components/YearTabBox";
import {
getActionData,
getYearActionData,
getYearListBySql,
} from "@/api/manage";
import { GlobalMixin } from "@/mixins/globalMixin";
export default {
name: "RightTopPie",
mixins: [GlobalMixin],
components: {
RightTopPieLine,
YearTabBox,
},
// props: {
// msg: String,
// },
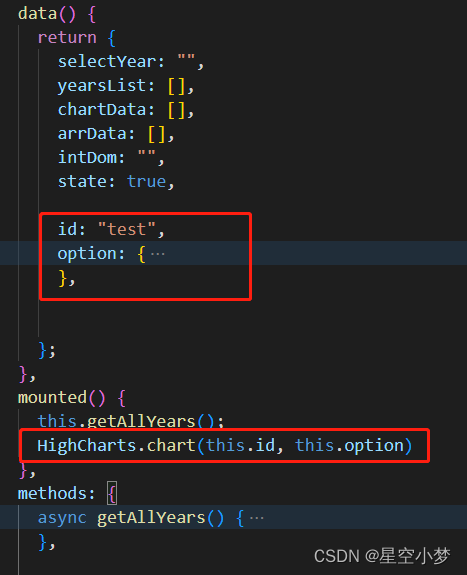
data() {
return {
selectYear: "",
yearsList: [],
chartData: [],
arrData: [],
intDom: "",
state: true,
id: "test",
option: {
chart: {
type: "pie", //饼图
options3d: {
enabled: true, //使用3d功能
alpha: 60, //延y轴向内的倾斜角度
beta: 0,
},
},
title: {
text: "测试用", //图表的标题文字
},
subtitle: {
text: "", //副标题文字
},
plotOptions: {
pie: {
allowPointSelect: true, //每个扇块能否选中
cursor: "pointer", //鼠标指针
depth: 35, //饼图的厚度
dataLabels: {
enabled: true, //是否显示饼图的线形tip
},
},
},
series: [
{
type: "pie",
name: "测试用1", //统一的前置词,非必须
data: [
["测试1", 12], //模块名和所占比,也可以{name: '测试1',y: 12}
["测试2", 23],
["测试3", 19],
["测试4", 29],
],
},
],
},
};
},
mounted() {
// this.getAllYears();
HighCharts.chart(this.id, this.option)
},
methods: {
async getAllYears() {
const yearsParams = {
api_key: "qJwsmXalFui8LnPxye",
metadata_id: "1529387467046707201",
};
const paramSql =
"select count_year from dp_ads.ads_jm_trade_homepage GROUP BY count_year";
const res = await getYearListBySql(
"/ylgDataApply/advancedQueryData",
yearsParams,
paramSql
);
let years = [];
years = res.items;
let arr = [];
years.map((item, index) => {
// yearsList.push(Number(item.count_year));
arr.push(item.count_year);
});
// 对年份进行排序
arr.sort((a, b) => {
return b - a;
});
this.yearsList = arr;
this.selectYear = arr[0];
// console.log(this.yearsList, "this.yearsList");
this.getData();
},
async getData() {
const params = {
api_key: "qJwsmXalFui8LnPxye",
metadata_id: "1529387467046707201",
};
const res = await getYearActionData(
"/ylgDataApply/advancedQueryData",
params,
this.selectYear
);
let arr = res.items;
// console.log(res.items, "00对外贸易关系");
arr.forEach((item) => {
item.exit = Number(Number(item.exit).toFixed(1));
item.import = Number(Number(item.import).toFixed(1));
item.total = Number(Number(item.total).toFixed(1));
});
this.chartData = arr;
this.arrData = this.getDescend(arr, "total");
// console.log(res.items, "对外贸易关系");
// this.handleChangeGraph();
},
getSelectTime(val) {
this.selectYear = val;
this.getData();
// this.handleData();
},
},
};
</script>
<style scoped lang="scss">
.card {
margin-top: 10px;
width: 100%;
position: relative;
}
.rightTopPie {
width: 96%;
height: 32vh;
// border: 1px solid red;
margin: 0px 10px 0px auto;
border-top: 0;
}
#line2 {
width: 52%;
height: calc(32vh - 2.5vh);
// border: 1px solid blue;
position: absolute;
right: 0;
top: 2.5vh;
padding-left: 2%;
}
#line2 > div {
width: 80%;
// border: 1px solid blue;
}
.rightLine {
width: 100%;
// border: 1px solid red;
> span:first-child {
display: inline-block;
width: 10px;
height: 10px;
background: #8fbfff;
box-shadow: 0px 0px 12px #8fbfff;
margin-right: 10px;
}
> span:nth-child(2) {
font-size: 16px;
font-family: Microsoft YaHei;
font-weight: bold;
font-style: italic;
color: #eceff4;
margin-right: 20px;
}
> span:nth-child(3) {
font-size: 16px;
font-family: PangMenZhengDao;
font-weight: bold;
font-style: italic;
color: #eceff4;
}
> span:nth-child(4) {
font-size: 16px;
font-family: Adobe Heiti Std;
font-weight: normal;
color: #eceff4;
padding-left: calc(100% - 20px - 60px - 60px - 55px);
// text-align: right;
}
}
/deep/ .el-progress-bar {
padding-right: 0px;
}
/deep/ .el-progress-bar__inner {
background-image: linear-gradient(
to right,
#0b3fff 0%,
#587bfd 50%,
#6c8bfd 100%
);
border-radius: 0px;
}
::v-deep .el-progress {
.el-progress-bar__outer {
background-color: #181f35; //这里是背景颜色
border-radius: 0px;
}
}
::v-deep .el-progress__text {
display: none;
}
</style>
<template>
  <div>
    <YearTabBox
      :yearsList="yearsList"
      :selectYear="selectYear"
      @getSelectTime="getSelectTime"
    />

    <div class="card ">
      <!-- <div ref="rightTopPie" class="rightTopPie" /> -->

      <div :id="id" :option="option"></div>

      <!-- <div id="line2">
        <RightTopPieLine
          v-for="(item, index) of arrData.slice(0, 4)"
          :key="index"
          :NoNum="index"
          :title="item.nation"
          :percentage="Number(item.proportion)"
        />
      </div> -->
    </div>
  </div>
</template>

<script>
import * as echarts from "echarts";
import HighCharts from "highcharts";
import RightTopPieLine from "../RightTopPieLine";
import YearTabBox from "@/components/YearTabBox";
import {
  getActionData,
  getYearActionData,
  getYearListBySql,
} from "@/api/manage";
import { GlobalMixin } from "@/mixins/globalMixin";
export default {
  name: "RightTopPie",
  mixins: [GlobalMixin],
  components: {
    RightTopPieLine,
    YearTabBox,
  },
  // props: {
  //   msg: String,
  // },

  data() {
    return {
      selectYear: "",
      yearsList: [],
      chartData: [],
      arrData: [],
      intDom: "",
      state: true,
      id: "rightTopPie",
      option: "",
    };
  },
  mounted() {
    this.getAllYears();
    this.getData();
  },
  methods: {
    async getAllYears() {
      const yearsParams = {
        api_key: "qJwsmXalFui8LnPxye",
        metadata_id: "1529387467046707201",
      };
      const paramSql =
        "select count_year from dp_ads.ads_jm_trade_homepage GROUP BY count_year";

      const res = await getYearListBySql(
        "/ylgDataApply/advancedQueryData",
        yearsParams,
        paramSql
      );

      let years = [];
      years = res.items;
      let arr = [];
      years.map((item, index) => {
        // yearsList.push(Number(item.count_year));
        arr.push(item.count_year);
      });
      // 对年份进行排序
      arr.sort((a, b) => {
        return b - a;
      });
      this.yearsList = arr;
      this.selectYear = arr[0];
      // console.log(this.yearsList, "this.yearsList");
      this.getData();
    },

    async getData() {
      const params = {
        api_key: "qJwsmXalFui8LnPxye",
        metadata_id: "1529387467046707201",
      };
      const res = await getYearActionData(
        "/ylgDataApply/advancedQueryData",
        params,
        this.selectYear
      );
      let arr = res.items;
      // console.log(res.items, "00对外贸易关系");
      arr.forEach((item) => {
        item.exit = Number(Number(item.exit).toFixed(1));
        item.import = Number(Number(item.import).toFixed(1));
        item.total = Number(Number(item.total).toFixed(1));
      });
      this.chartData = arr;

      this.arrData = this.getDescend(arr, "total");
      // console.log(res.items, "对外贸易关系");
      // this.handleChangeGraph();

      this.option = {
        chart: {
          type: "pie", //饼图
          options3d: {
            enabled: true, //使用3d功能
            alpha: 60, //延y轴向内的倾斜角度
            beta: 0,
          },
          spacing: [0, 100, 0, 0], //图标与四周的间距 相当于echarts grid
        },

        // title: {
        //   text: "测试用", //图表的标题文字
        // },
        // subtitle: {
        //   text: "", //副标题文字
        // },

        legend: {
          align: "left", //水平方向位置
          verticalAlign: "top", //垂直方向位置
          x: 0, //距离x轴的距离
          y: 0, //距离Y轴的距离
        },

        plotOptions: {
          pie: {
            allowPointSelect: true, //每个扇块能否选中
            cursor: "pointer", //鼠标指针
            depth: 35, //饼图的厚度
            dataLabels: {
              enabled: true, //是否显示饼图的线形tip
            },
          },
        },
        series: [
          {
            type: "pie",
            name: "测试用1", //统一的前置词,非必须
            data: [
              ["测试1", 12], //模块名和所占比,也可以{name: '测试1',y: 12}
              ["测试2", 23],
              ["测试3", 19],
              ["测试4", 29],
            ],
            showInLegend: true,

            // verticalAlign:top
          },
        ],
      };

      HighCharts.chart(this.id, this.option);
    },

    getSelectTime(val) {
      this.selectYear = val;
      this.getData();
      // this.handleData();
    },
  },
};
</script>

<style scoped lang="scss">
.card {
  margin-top: 10px;
  width: 100%;
  position: relative;
}

.rightTopPie {
  width: 96%;
  height: 32vh;
  border: 1px solid red;
  margin: 0px 10px 0px auto;
  border-top: 0;
}

#line2 {
  width: 52%;
  height: calc(32vh - 2.5vh);
  // border: 1px solid blue;
  position: absolute;
  right: 0;
  top: 2.5vh;
  padding-left: 2%;
}

#line2 > div {
  width: 80%;

  // border: 1px solid blue;
}

.rightLine {
  width: 100%;
  // border: 1px solid red;
  > span:first-child {
    display: inline-block;
    width: 10px;
    height: 10px;
    background: #8fbfff;
    box-shadow: 0px 0px 12px #8fbfff;
    margin-right: 10px;
  }
  > span:nth-child(2) {
    font-size: 16px;
    font-family: Microsoft YaHei;
    font-weight: bold;
    font-style: italic;
    color: #eceff4;
    margin-right: 20px;
  }
  > span:nth-child(3) {
    font-size: 16px;
    font-family: PangMenZhengDao;
    font-weight: bold;
    font-style: italic;
    color: #eceff4;
  }
  > span:nth-child(4) {
    font-size: 16px;
    font-family: Adobe Heiti Std;
    font-weight: normal;
    color: #eceff4;
    padding-left: calc(100% - 20px - 60px - 60px - 55px);
    // text-align: right;
  }
}

/deep/ .el-progress-bar {
  padding-right: 0px;
}

/deep/ .el-progress-bar__inner {
  background-image: linear-gradient(
    to right,
    #0b3fff 0%,
    #587bfd 50%,
    #6c8bfd 100%
  );
  border-radius: 0px;
}

::v-deep .el-progress {
  .el-progress-bar__outer {
    background-color: #181f35; //这里是背景颜色
    border-radius: 0px;
  }
}

::v-deep .el-progress__text {
  display: none;
}
</style>


 1064
1064


 被折叠的 条评论
为什么被折叠?
被折叠的 条评论
为什么被折叠?
 到【灌水乐园】发言


