


一、熔断作用和原理
1.1 熔断的作用
熔断,是创建弹性微服务应用程序的重要模式。熔断能够使您的应用程序具备应对来自故障、潜在峰值和其他未知网络因素影响的能力
熔断机制其实是一种保护机制,在微服务架构中,服务部署在不同的节点上,如果服务成功响应请求,那么万事大吉。但事实往往并非如此,下游客户端需要受到保护,以免上游服务过慢。反过来,上游服务必须受到保护,以免因请求积压而过载。不然很可能导致整个系统响应过慢压力过大,最终系统崩溃。熔断机制则是个很好的解决方案。
1.2 熔断的原理
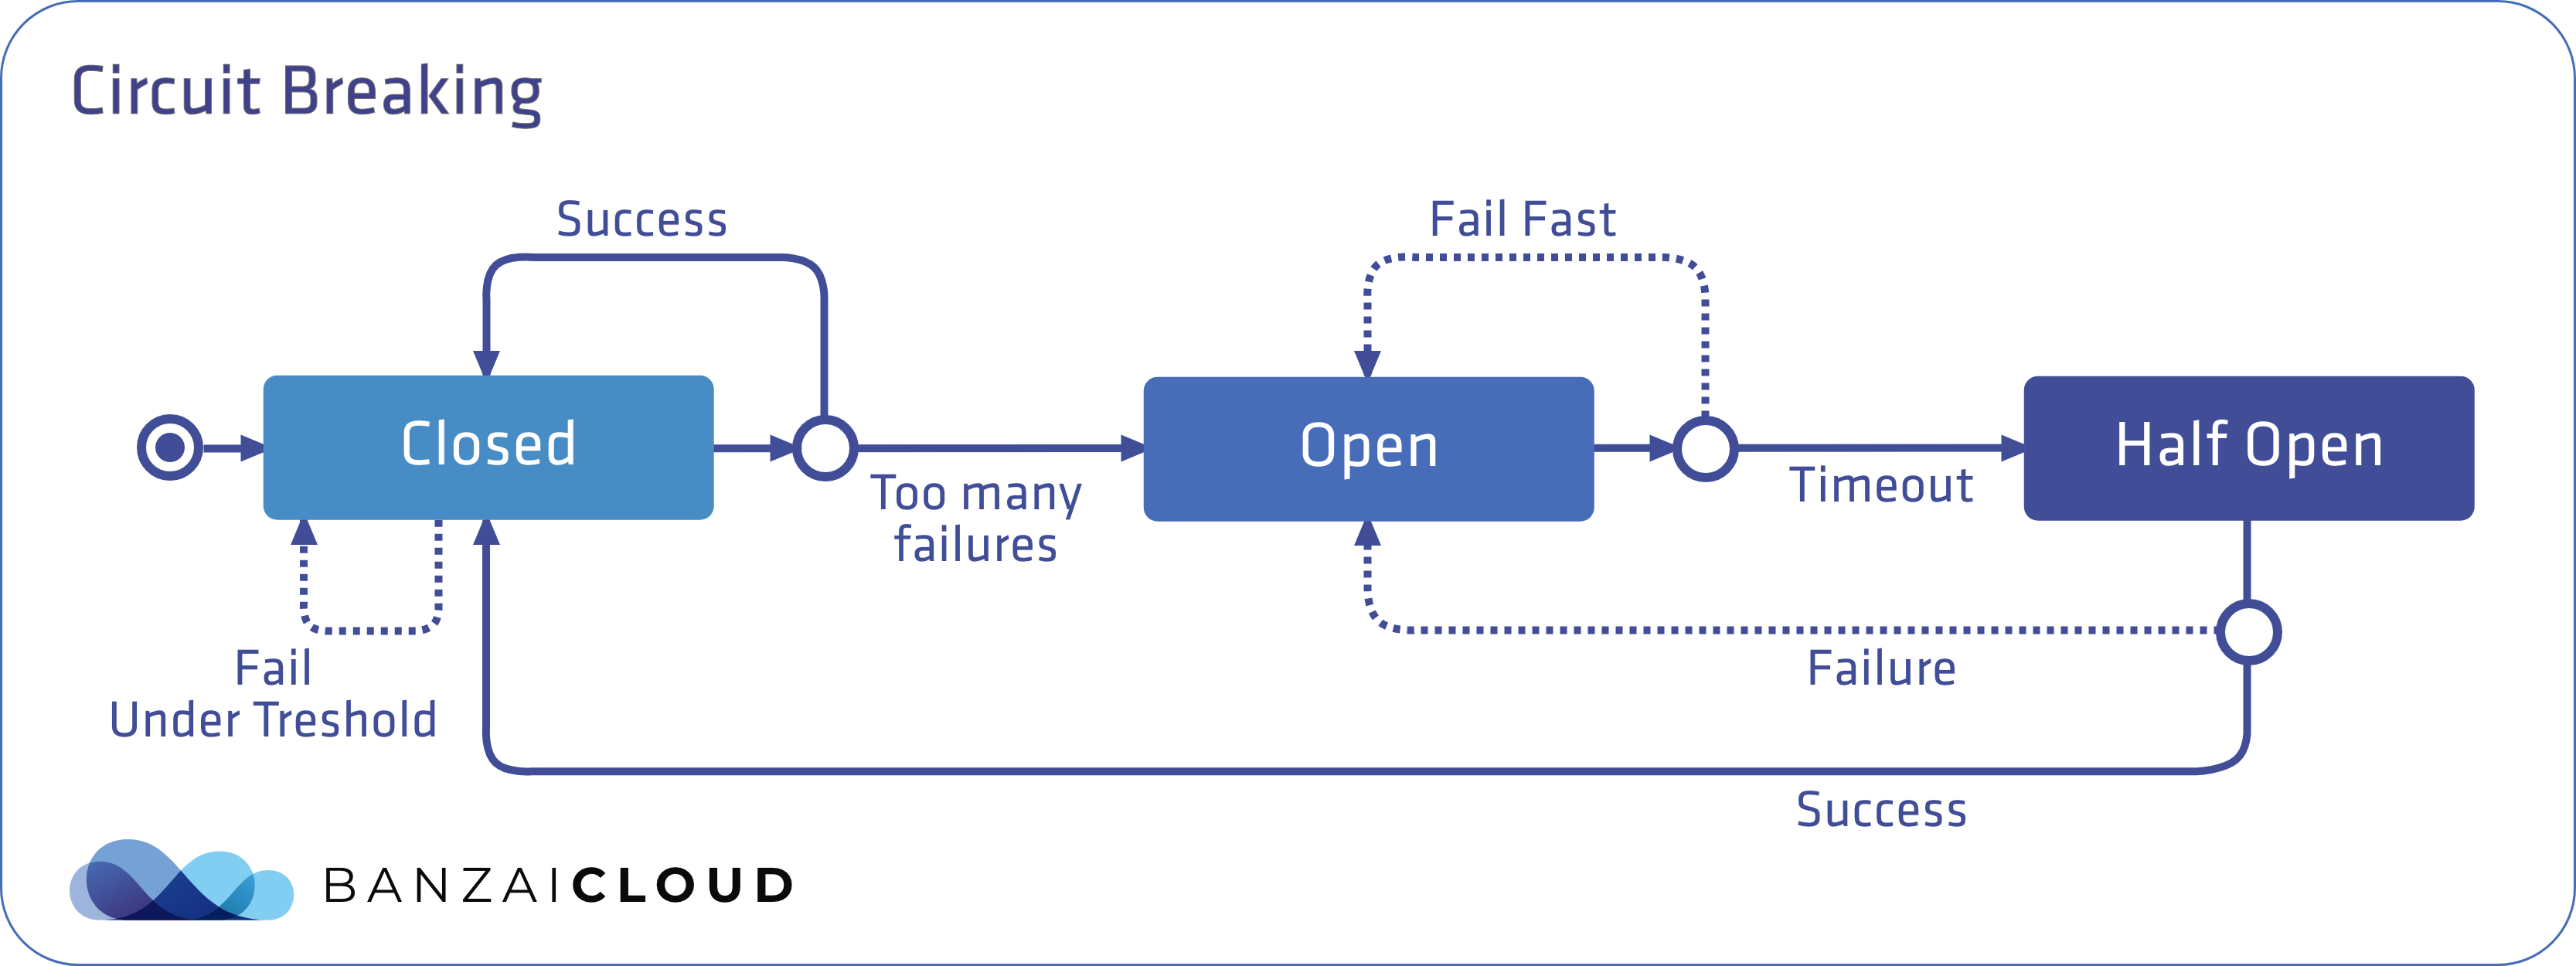
熔断有三种状态:关闭、打开和半开,默认情况下处于关闭状态。
关闭状态:无论请求成功或失败,到达预先设定的故障数量阈值前,都不会触发熔断。
打开状态:当达到阈值时,熔断器就会打开。当调用处于打开状态的服务时,熔断器将断开请求,直接返回一个错误,而不去执行调用。通过在客户端断开下游请求的方式,可以在生产环境中防止级联故障的发生。
半开状态:在经过事先配置的超时时长后,熔断器进入半开状态,这种状态下故障服务有时间从其中断的行为中恢复。如果请求在这种状态下继续失败,则熔断器将再次打开并继续阻断请求。否则熔断器将关闭,服务将被允许再次处理请求。
如下图,转载自banzaicloud
1.3 istio熔断配置
Istio的熔断可以在配置TrafficPolicy的内场Destination RuleIstio自定义资源。有两个字段TrafficPolicy与断路器相关:ConnectionPool和OutlierDetection。
ConnectionPool:可以为服务配置连接量,控制请求、挂起请求、重试或超时的最大数量
OutlierDetection:用于控制从负载平衡池中驱逐不健康的服务,控制服务从连接池中弹出之前的错误数量,并且可以设置最小弹出持续时间和最大弹出百分比。
Destination Rule配置熔断例子:
apiVersion: networking.istio.io/v1alpha3
kind: DestinationRule
metadata:
  name: notifications
spec:
  host: notifications
  trafficPolicy:
    connectionPool:
      tcp:
        maxConnections: 1
      http:
        http1MaxPendingRequests: 1
        maxRequestsPerConnection: 1
    outlierDetection:
      consecutiveErrors: 1
      interval: 1s
      baseEjectionTime: 3m
      maxEjectionPercent: 100
hosts指定请求目标,服务名notifications
ConnectionPool中设置了在一定时间内只能和notifications 服务建立一个连接:每个连接最多只能有一个挂起(pending)的请求。如果达到阈值,熔断器将开启阻断请求。
OutlierDetection部分的设置用来检查每秒调用服务是否有错误发生。如果有,则将服务从负载均衡池中逐出至少三分钟(100%最大弹出百分比表示,如果需要,所有的服务实例都可以同时被逐出)。
如果 Istio 启用了双向 TLS 身份验证,则必须在应用目标规则之前将 TLS 流量策略
mode:ISTIO_MUTUAL添加到DestinationRule。否则请求将产生 503 错误
二、配置实验环境
1、创建一个提供响应请求的服务(httpbin )
2、创建一个熔断规则DestinationRule
3、创建一个负载测试客户端Fortio
4、测试触发熔断
2.1 创建httpbin服务
[root@k8s-master httpbin]# cat httpbin.yaml
apiVersion: v1
kind: ServiceAccount
metadata:
  name: httpbin
---
apiVersion: v1
kind: Service
metadata:
  name: httpbin
  labels:
    app: httpbin
    service: httpbin
spec:
  ports:
  - name: http
    port: 8000
    targetPort: 80
  selector:
    app: httpbin
---
apiVersion: apps/v1
kind: Deployment
metadata:
  name: httpbin
spec:
  replicas: 1
  selector:
    matchLabels:
      app: httpbin
      version: v1
  template:
    metadata:
      labels:
        app: httpbin
        version: v1
    spec:
      serviceAccountName: httpbin
      containers:
      - image: docker.io/kennethreitz/httpbin
        imagePullPolicy: IfNotPresent
        name: httpbin
        ports:
        - containerPort: 80
[root@k8s-master httpbin]# kubectl apply -f httpbin.yaml
serviceaccount/httpbin created
service/httpbin created
deployment.apps/httpbin created
查看pod已经启动成功
[root@k8s-master httpbin]# kubectl get pod
NAME                       READY   STATUS    RESTARTS       AGE
appv1-5cf75d8d8b-vdvzr     2/2     Running   4 (5d3h ago)   5d4h
appv2-684dd44db7-r6k6k     2/2     Running   4 (5d3h ago)   5d4h
httpbin-74fb669cc6-5hkjz   2/2     Running   0              70s
2.2 创建熔断规则
[root@k8s-master cricuit-breaking]# cat destinationrule.yaml
apiVersion: networking.istio.io/v1alpha3
kind: DestinationRule
metadata:
  name: httpbin
spec:
  host: httpbin
  trafficPolicy:
    connectionPool:
      tcp:
        maxConnections: 1
      http:
        http1MaxPendingRequests: 1
        maxRequestsPerConnection: 1
    outlierDetection:
      consecutive5xxErrors: 1
      interval: 1s
      baseEjectionTime: 3m
      maxEjectionPercent: 100
[root@k8s-master cricuit-breaking]# kubectl apply -f destinationrule.yaml
destinationrule.networking.istio.io/httpbin created
[root@k8s-master cricuit-breaking]# kubectl get destinationrules.networking.istio.io
NAME      HOST                               AGE
canary    canary.default.svc.cluster.local   5d4h
httpbin   httpbin                            11s

[root@k8s-master cricuit-breaking]# kubectl get destinationrules.networking.istio.io httpbin -o yaml
apiVersion: networking.istio.io/v1beta1
kind: DestinationRule
metadata:
  annotations:

... ...

spec:
  host: httpbin
  trafficPolicy:
    connectionPool:
      http:
        http1MaxPendingRequests: 1
        maxRequestsPerConnection: 1
      tcp:
        maxConnections: 1
    outlierDetection:
      baseEjectionTime: 3m
      consecutive5xxErrors: 1
      interval: 1s
      maxEjectionPercent: 100
[root@k8s-master cricuit-breaking]#
2.3 创建负载测试客户端Fortio
[root@k8s-master cricuit-breaking]# cat fortio-deploy.yaml
apiVersion: v1
kind: Service
metadata:
  name: fortio
  labels:
    app: fortio
    service: fortio
spec:
  ports:
  - port: 8080
    name: http
  selector:
    app: fortio
---
apiVersion: apps/v1
kind: Deployment
metadata:
  name: fortio-deploy
spec:
  replicas: 1
  selector:
    matchLabels:
      app: fortio
  template:
    metadata:
      annotations:
        # This annotation causes Envoy to serve cluster.outbound statistics via 15000/stats
        # in addition to the stats normally served by Istio. The Circuit Breaking example task
        # gives an example of inspecting Envoy stats via proxy config.
        proxy.istio.io/config: |-
          proxyStatsMatcher:
            inclusionPrefixes:
            - "cluster.outbound"
            - "cluster_manager"
            - "listener_manager"
            - "server"
            - "cluster.xds-grpc"
      labels:
        app: fortio
    spec:
      containers:
      - name: fortio
        image: fortio/fortio:latest_release
        imagePullPolicy: Always
        ports:
        - containerPort: 8080
          name: http-fortio
        - containerPort: 8079
          name: grpc-ping
[root@k8s-master cricuit-breaking]# kubectl apply -f fortio-deploy.yaml
service/fortio created
deployment.apps/fortio-deploy created
[root@k8s-master cricuit-breaking]#
查看创建pod状态
[root@k8s-master cricuit-breaking]# kubectl get pod
NAME                             READY   STATUS    RESTARTS       AGE
appv1-5cf75d8d8b-vdvzr           2/2     Running   4 (5d3h ago)   5d4h
appv2-684dd44db7-r6k6k           2/2     Running   4 (5d3h ago)   5d4h
fortio-deploy-687945c6dc-zjb7s   2/2     Running   0              41s
httpbin-74fb669cc6-5hkjz         2/2     Running   0              14m
[root@k8s-master cricuit-breaking]#
登入客户端 Pod 并使用 Fortio 工具调用 httpbin 服务,注意pod名要替换成刚刚查找出来的pod
[root@k8s-master cricuit-breaking]# kubectl exec fortio-deploy-687945c6dc-zjb7s fortio -- /usr/bin/fortio curl -quiet http://httpbin:8000/get
HTTP/1.1 200 OK
server: envoy
date: Wed, 05 Jan 2022 12:50:06 GMT
content-type: application/json
content-length: 594
access-control-allow-origin: *
access-control-allow-credentials: true
x-envoy-upstream-service-time: 25

{
  "args": {},
  "headers": {
    "Host": "httpbin:8000",
    "User-Agent": "fortio.org/fortio-1.17.1",
    "X-B3-Parentspanid": "4d6f06146b076eb4",
    "X-B3-Sampled": "1",
    "X-B3-Spanid": "d01931edb506c09b",
    "X-B3-Traceid": "436319cccbb1ae594d6f06146b076eb4",
    "X-Envoy-Attempt-Count": "1",
    "X-Forwarded-Client-Cert": "By=spiffe://cluster.local/ns/default/sa/httpbin;Hash=31f26376fdc1840183774e5be2fe1d56ea196ef69acb2785b6710fe487fcd1df;Subject=\"\";URI=spiffe://cluster.local/ns/default/sa/default"
  },
  "origin": "127.0.0.6",
  "url": "http://httpbin:8000/get"
}
[root@k8s-master cricuit-breaking]#
2.4 测试触发熔断
在 DestinationRule 配置中,我们设置了 maxConnections: 1 和 http1MaxPendingRequests: 1,意思是如果并发的连接和请求数超过1,那么超出的请求就会被阻止,报503错误。
首先:发送并发数为 2 的连接(-c 2),请求 20 次(-n 20)
[root@k8s-master cricuit-breaking]# kubectl exec fortio-deploy-687945c6dc-zjb7s fortio -- /usr/bin/fortio load -c 2 -qps 0 -n 20 -loglevel Warning http://httpbin:8000/get
12:53:59 I logger.go:127> Log level is now 3 Warning (was 2 Info)
Fortio 1.17.1 running at 0 queries per second, 2->2 procs, for 20 calls: http://httpbin:8000/get
Starting at max qps with 2 thread(s) [gomax 2] for exactly 20 calls (10 per thread + 0)
12:53:59 W http_client.go:806> [0] Non ok http code 503 (HTTP/1.1 503)
12:53:59 W http_client.go:806> [0] Non ok http code 503 (HTTP/1.1 503)
12:53:59 W http_client.go:806> [0] Non ok http code 503 (HTTP/1.1 503)
Ended after 65.85345ms : 20 calls. qps=303.7
Aggregated Function Time : count 20 avg 0.0059132964 +/- 0.004518 min 0.000490991 max 0.022192328 sum 0.118265928
# range, mid point, percentile, count
>= 0.000490991 <= 0.001 , 0.000745496 , 10.00, 2
> 0.003 <= 0.004 , 0.0035 , 15.00, 1
> 0.004 <= 0.005 , 0.0045 , 60.00, 9
> 0.005 <= 0.006 , 0.0055 , 75.00, 3
> 0.006 <= 0.007 , 0.0065 , 85.00, 2
> 0.008 <= 0.009 , 0.0085 , 90.00, 1
> 0.012 <= 0.014 , 0.013 , 95.00, 1
> 0.02 <= 0.0221923 , 0.0210962 , 100.00, 1
# target 50% 0.00477778
# target 75% 0.006
# target 90% 0.009
# target 99% 0.0217539
# target 99.9% 0.0221485
Sockets used: 5 (for perfect keepalive, would be 2)
Jitter: false
Code 200 : 17 (85.0 %)
Code 503 : 3 (15.0 %)
Response Header Sizes : count 20 avg 195.55 +/- 82.15 min 0 max 231 sum 3911
Response Body/Total Sizes : count 20 avg 736.6 +/- 208.2 min 241 max 825 sum 14732
All done 20 calls (plus 0 warmup) 5.913 ms avg, 303.7 qps
请求几乎都完成了,请求并发比较低,几乎都处理掉了
然后:我们增加并发,发送并发数为 2 的连接(-c 3),请求 20 次(-n 30)
[root@k8s-master cricuit-breaking]# kubectl exec fortio-deploy-687945c6dc-zjb7s fortio -- /usr/bin/fortio load -c 3 -qps 0 -n 30 -loglevel Warning http://httpbin:8000/get
13:00:19 I logger.go:127> Log level is now 3 Warning (was 2 Info)
Fortio 1.17.1 running at 0 queries per second, 2->2 procs, for 30 calls: http://httpbin:8000/get
Starting at max qps with 3 thread(s) [gomax 2] for exactly 30 calls (10 per thread + 0)
13:00:19 W http_client.go:806> [0] Non ok http code 503 (HTTP/1.1 503)
13:00:19 W http_client.go:806> [0] Non ok http code 503 (HTTP/1.1 503)
13:00:19 W http_client.go:806> [1] Non ok http code 503 (HTTP/1.1 503)
13:00:19 W http_client.go:806> [2] Non ok http code 503 (HTTP/1.1 503)
13:00:19 W http_client.go:806> [2] Non ok http code 503 (HTTP/1.1 503)
13:00:19 W http_client.go:806> [2] Non ok http code 503 (HTTP/1.1 503)
13:00:19 W http_client.go:806> [1] Non ok http code 503 (HTTP/1.1 503)
13:00:19 W http_client.go:806> [0] Non ok http code 503 (HTTP/1.1 503)
13:00:19 W http_client.go:806> [0] Non ok http code 503 (HTTP/1.1 503)
13:00:19 W http_client.go:806> [0] Non ok http code 503 (HTTP/1.1 503)
13:00:19 W http_client.go:806> [2] Non ok http code 503 (HTTP/1.1 503)
13:00:19 W http_client.go:806> [0] Non ok http code 503 (HTTP/1.1 503)
13:00:19 W http_client.go:806> [2] Non ok http code 503 (HTTP/1.1 503)
13:00:19 W http_client.go:806> [1] Non ok http code 503 (HTTP/1.1 503)
13:00:19 W http_client.go:806> [0] Non ok http code 503 (HTTP/1.1 503)
Ended after 63.023172ms : 30 calls. qps=476.02
Aggregated Function Time : count 30 avg 0.0046750369 +/- 0.005078 min 0.00040163 max 0.020853069 sum 0.140251107
# range, mid point, percentile, count
>= 0.00040163 <= 0.001 , 0.000700815 , 30.00, 9
> 0.001 <= 0.002 , 0.0015 , 46.67, 5
> 0.003 <= 0.004 , 0.0035 , 50.00, 1
> 0.004 <= 0.005 , 0.0045 , 63.33, 4
> 0.005 <= 0.006 , 0.0055 , 66.67, 1
> 0.006 <= 0.007 , 0.0065 , 76.67, 3
> 0.007 <= 0.008 , 0.0075 , 83.33, 2
> 0.008 <= 0.009 , 0.0085 , 86.67, 1
> 0.009 <= 0.01 , 0.0095 , 93.33, 2
> 0.018 <= 0.02 , 0.019 , 96.67, 1
> 0.02 <= 0.0208531 , 0.0204265 , 100.00, 1
# target 50% 0.004
# target 75% 0.00683333
# target 90% 0.0095
# target 99% 0.0205971
# target 99.9% 0.0208275
Sockets used: 16 (for perfect keepalive, would be 3)
Jitter: false
Code 200 : 15 (50.0 %)
Code 503 : 15 (50.0 %)
Response Header Sizes : count 30 avg 115 +/- 115 min 0 max 230 sum 3450
Response Body/Total Sizes : count 30 avg 532.5 +/- 291.5 min 241 max 824 sum 15975
All done 30 calls (plus 0 warmup) 4.675 ms avg, 476.0 qps
[root@k8s-master cricuit-breaking]#
目前已经触发熔断,多访问几次,效果显现
[root@k8s-master cricuit-breaking]# kubectl exec fortio-deploy-687945c6dc-zjb7s fortio -- /usr/bin/fortio load -c 3 -qps 0 -n 30 -loglevel Warning http://httpbin:8000/get
13:05:28 I logger.go:127> Log level is now 3 Warning (was 2 Info)
Fortio 1.17.1 running at 0 queries per second, 2->2 procs, for 30 calls: http://httpbin:8000/get
Starting at max qps with 3 thread(s) [gomax 2] for exactly 30 calls (10 per thread + 0)
13:05:28 W http_client.go:806> [1] Non ok http code 503 (HTTP/1.1 503)
13:05:28 W http_client.go:806> [0] Non ok http code 503 (HTTP/1.1 503)
13:05:28 W http_client.go:806> [0] Non ok http code 503 (HTTP/1.1 503)
13:05:28 W http_client.go:806> [1] Non ok http code 503 (HTTP/1.1 503)
13:05:28 W http_client.go:806> [0] Non ok http code 503 (HTTP/1.1 503)
13:05:28 W http_client.go:806> [1] Non ok http code 503 (HTTP/1.1 503)
13:05:28 W http_client.go:806> [0] Non ok http code 503 (HTTP/1.1 503)
13:05:28 W http_client.go:806> [1] Non ok http code 503 (HTTP/1.1 503)
13:05:28 W http_client.go:806> [0] Non ok http code 503 (HTTP/1.1 503)
13:05:28 W http_client.go:806> [1] Non ok http code 503 (HTTP/1.1 503)
13:05:28 W http_client.go:806> [0] Non ok http code 503 (HTTP/1.1 503)
13:05:28 W http_client.go:806> [1] Non ok http code 503 (HTTP/1.1 503)
13:05:28 W http_client.go:806> [0] Non ok http code 503 (HTTP/1.1 503)
13:05:28 W http_client.go:806> [0] Non ok http code 503 (HTTP/1.1 503)
13:05:28 W http_client.go:806> [1] Non ok http code 503 (HTTP/1.1 503)
13:05:28 W http_client.go:806> [0] Non ok http code 503 (HTTP/1.1 503)
13:05:28 W http_client.go:806> [2] Non ok http code 503 (HTTP/1.1 503)
13:05:28 W http_client.go:806> [1] Non ok http code 503 (HTTP/1.1 503)
13:05:28 W http_client.go:806> [2] Non ok http code 503 (HTTP/1.1 503)
13:05:28 W http_client.go:806> [1] Non ok http code 503 (HTTP/1.1 503)
13:05:28 W http_client.go:806> [2] Non ok http code 503 (HTTP/1.1 503)
13:05:28 W http_client.go:806> [2] Non ok http code 503 (HTTP/1.1 503)
13:05:28 W http_client.go:806> [2] Non ok http code 503 (HTTP/1.1 503)
13:05:28 W http_client.go:806> [2] Non ok http code 503 (HTTP/1.1 503)
13:05:28 W http_client.go:806> [2] Non ok http code 503 (HTTP/1.1 503)
13:05:28 W http_client.go:806> [2] Non ok http code 503 (HTTP/1.1 503)
13:05:28 W http_client.go:806> [2] Non ok http code 503 (HTTP/1.1 503)
13:05:28 W http_client.go:806> [2] Non ok http code 503 (HTTP/1.1 503)
Ended after 38.111835ms : 30 calls. qps=787.16
Aggregated Function Time : count 30 avg 0.0035141705 +/- 0.008374 min 0.000294241 max 0.033723522 sum 0.105425115
# range, mid point, percentile, count
>= 0.000294241 <= 0.001 , 0.000647121 , 63.33, 19
> 0.001 <= 0.002 , 0.0015 , 90.00, 8
> 0.025 <= 0.03 , 0.0275 , 96.67, 2
> 0.03 <= 0.0337235 , 0.0318618 , 100.00, 1
# target 50% 0.000843165
# target 75% 0.0014375
# target 90% 0.002
# target 99% 0.0326065
# target 99.9% 0.0336118
Sockets used: 28 (for perfect keepalive, would be 3)
Jitter: false
Code 200 : 2 (6.7 %)
Code 503 : 28 (93.3 %)
Response Header Sizes : count 30 avg 15.4 +/- 57.62 min 0 max 231 sum 462
Response Body/Total Sizes : count 30 avg 200.73333 +/- 167.6 min 153 max 825 sum 6022
All done 30 calls (plus 0 warmup) 3.514 ms avg, 787.2 qps
[root@k8s-master cricuit-breaking]#
[root@k8s-master cricuit-breaking]#
[root@k8s-master cricuit-breaking]#
[root@k8s-master cricuit-breaking]#
[root@k8s-master cricuit-breaking]#
[root@k8s-master cricuit-breaking]#
[root@k8s-master cricuit-breaking]# kubectl exec fortio-deploy-687945c6dc-zjb7s fortio -- /usr/bin/fortio load -c 3 -qps 0 -n 30 -loglevel Warning http://httpbin:8000/get
13:05:32 I logger.go:127> Log level is now 3 Warning (was 2 Info)
Fortio 1.17.1 running at 0 queries per second, 2->2 procs, for 30 calls: http://httpbin:8000/get
Starting at max qps with 3 thread(s) [gomax 2] for exactly 30 calls (10 per thread + 0)
13:05:32 W http_client.go:806> [0] Non ok http code 503 (HTTP/1.1 503)
13:05:32 W http_client.go:806> [2] Non ok http code 503 (HTTP/1.1 503)
13:05:32 W http_client.go:806> [1] Non ok http code 503 (HTTP/1.1 503)
13:05:32 W http_client.go:806> [2] Non ok http code 503 (HTTP/1.1 503)
13:05:32 W http_client.go:806> [0] Non ok http code 503 (HTTP/1.1 503)
13:05:32 W http_client.go:806> [1] Non ok http code 503 (HTTP/1.1 503)
13:05:32 W http_client.go:806> [0] Non ok http code 503 (HTTP/1.1 503)
13:05:32 W http_client.go:806> [2] Non ok http code 503 (HTTP/1.1 503)
13:05:32 W http_client.go:806> [2] Non ok http code 503 (HTTP/1.1 503)
13:05:32 W http_client.go:806> [1] Non ok http code 503 (HTTP/1.1 503)
13:05:32 W http_client.go:806> [0] Non ok http code 503 (HTTP/1.1 503)
13:05:32 W http_client.go:806> [1] Non ok http code 503 (HTTP/1.1 503)
13:05:32 W http_client.go:806> [2] Non ok http code 503 (HTTP/1.1 503)
13:05:32 W http_client.go:806> [0] Non ok http code 503 (HTTP/1.1 503)
13:05:32 W http_client.go:806> [2] Non ok http code 503 (HTTP/1.1 503)
13:05:32 W http_client.go:806> [0] Non ok http code 503 (HTTP/1.1 503)
13:05:32 W http_client.go:806> [1] Non ok http code 503 (HTTP/1.1 503)
13:05:32 W http_client.go:806> [0] Non ok http code 503 (HTTP/1.1 503)
13:05:32 W http_client.go:806> [2] Non ok http code 503 (HTTP/1.1 503)
13:05:32 W http_client.go:806> [1] Non ok http code 503 (HTTP/1.1 503)
13:05:32 W http_client.go:806> [0] Non ok http code 503 (HTTP/1.1 503)
13:05:32 W http_client.go:806> [2] Non ok http code 503 (HTTP/1.1 503)
13:05:32 W http_client.go:806> [1] Non ok http code 503 (HTTP/1.1 503)
13:05:32 W http_client.go:806> [2] Non ok http code 503 (HTTP/1.1 503)
13:05:32 W http_client.go:806> [1] Non ok http code 503 (HTTP/1.1 503)
13:05:32 W http_client.go:806> [0] Non ok http code 503 (HTTP/1.1 503)
13:05:32 W http_client.go:806> [0] Non ok http code 503 (HTTP/1.1 503)
13:05:32 W http_client.go:806> [2] Non ok http code 503 (HTTP/1.1 503)
13:05:32 W http_client.go:806> [1] Non ok http code 503 (HTTP/1.1 503)
13:05:32 W http_client.go:806> [1] Non ok http code 503 (HTTP/1.1 503)
Ended after 8.257874ms : 30 calls. qps=3632.9
Aggregated Function Time : count 30 avg 0.00076742657 +/- 0.0002507 min 0.000307242 max 0.001269222 sum 0.023022797
# range, mid point, percentile, count
>= 0.000307242 <= 0.001 , 0.000653621 , 83.33, 25
> 0.001 <= 0.00126922 , 0.00113461 , 100.00, 5
# target 50% 0.000711351
# target 75% 0.000927838
# target 90% 0.00110769
# target 99% 0.00125307
# target 99.9% 0.00126761
Sockets used: 30 (for perfect keepalive, would be 3)
Jitter: false
Code 503 : 30 (100.0 %)
Response Header Sizes : count 30 avg 0 +/- 0 min 0 max 0 sum 0
Response Body/Total Sizes : count 30 avg 153 +/- 0 min 153 max 153 sum 4590
All done 30 calls (plus 0 warmup) 0.767 ms avg, 3632.9 qps
[root@k8s-master cricuit-breaking]#


 867
867


 被折叠的 条评论
为什么被折叠?
被折叠的 条评论
为什么被折叠?
 到【灌水乐园】发言


