


柱状图
双柱状图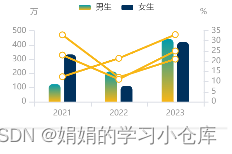
入参说明:
const chart1 = {
		// 绑定容器id
        idName: 'echart1',
        // 标志图名称
        legend: ['男生','女生'],
        // x轴名称
        xNameArr: ['2021','2022','2023'],
        // y轴单位,数组长度1只显示左边y轴,长度2显示两边y轴
        yUnits: ['万','%'],
        // 数据,二维数组,外层数组为一个组的柱子数量,内层数组与x轴对应
        dataAll: [['123','212','442'],['333','111','421']],
        // 颜色,为二维数组时可渐变,从上往下渐变,二位数组时最内层数组长度必须为二
        itemColors: [['#009BAE','#F8B616'],'#00315D'],
        // 折线数据,二维数组,外层数组为折线条数,内层数组与x轴对应,可不传
        lineAll:[['12.3','21.4','33.1'],['33','12','21'],['23','11','25']],
        // 折线颜色,为二维数组时,内层数组分别为折线颜色和折点颜色
        lineAllColors: [['#009BAE','#F8B616'],'#00315D','#00315D'],
      }
      this.initMoreDubYEchart(chart1)
js
  initMoreDubYEchart(newDataAll) {
    const defaultDataAll = {
      idName : '',
      legend : [],
      xNameArr : [],
      yUnits : ['%'],
      itemColors : [],
      dataAll : [], // 二维数组
      lineAll : [], // 二维数组
      lineAllColors : []
    }
    const dataAll = Object.assign(defaultDataAll,newDataAll)
    var chart = echarts.init(document.getElementById(dataAll.idName));
    var that = this

    const tempYAxis = []
    dataAll.yUnits.forEach(it=>{
      tempYAxis.push(
          {
            type: 'value',
            name: it,
            nameTextStyle: {
              color: '#999',
              fontSize: 8,
            },
            splitLine: {
              show: false
            },
            axisLine: {
              lineStyle: {
                color: '#DCDFE6', //轴线的颜色
              },
            },
            axisLabel: {
              show: true,
              textStyle: {
                color: '#999',
                fontSize: 8,
              },
              formatter: '{value}'
            },
          }
      )
    })

    const tempSeries = []
    dataAll.dataAll.forEach((it,index)=>{
      let color1 = '#F8B616'
      let color0 = 'rgba(248,182,22,0.4)'
      if (dataAll.itemColors.length > index) {
        if (Array.isArray(dataAll.itemColors[index]) && dataAll.itemColors[index].length === 2) {
          color1 = dataAll.itemColors[index][0]
          color0 = dataAll.itemColors[index][1]
        }  else if (typeof dataAll.itemColors[index] === "string") {
          color1 = dataAll.itemColors[index]
          color0 = dataAll.itemColors[index]
        }
      }
      tempSeries.push(
          {
            name: dataAll.legend[index],
            type: 'bar',
            tooltip: {
              valueFormatter: function (value) {
                return value;
              }
            },
            barWidth: 12, // 柱子宽度
            itemStyle: {
              barBorderRadius: [4, 4, 0, 0], // 圆角(左上、右上、右下、左下)
              color: new echarts.graphic.LinearGradient(0, 1, 0, 0,
                  [
                    {
                      offset: 0,
                      color: color0
                    },
                    {
                      offset: 1,
                      color: color1
                    }
                  ],
                  false
              ), // 渐变
              // color: dataAll.itemColors.length> index?dataAll.itemColors[index] : '#009BAE'
            },
            data: it
          }
      )
    })
    dataAll.lineAll.forEach((it,index)=>{
      let color1 = '#009BAE'
      let color0 = '#00315D'
      if (dataAll.lineAllColors.length > index) {
        if (Array.isArray(dataAll.lineAllColors[index]) && dataAll.lineAllColors[index].length === 2) {
          color1 = dataAll.lineAllColors[index][0]
          color0 = dataAll.lineAllColors[index][1]
        } else if (typeof dataAll.lineAllColors[index] === "string") {
          color1 = dataAll.lineAllColors[index]
          color0 = dataAll.lineAllColors[index]
        }
      }
      tempSeries.push(
          {
            name: dataAll.legend[index] + '同比',
            type: 'line',
            yAxisIndex: 1,
            tooltip: {
              valueFormatter: function (value) {
                return value + ' %';
              }
            },
            symbolSize: 6,   //折线点的大小
            itemStyle: {
              normal: {
                color: color0,//折线点的颜色
                lineStyle: {
                  color: color1//折线的颜色
                }
              }
            },
            // lineStyle: {
            //   normal: {
            //     width: 3,
            //   }
            // },
            data: it
          },
      )
    })

    chart.clear();
    var option = {
      title: {
        text: '',
        left: 'right',
        bottom: 5,
        textStyle: {
          color: '#999', //文字的颜色
          fontSize: 8,
        }
      },
      tooltip: {
        trigger: 'axis',
        axisPointer: {
          type: 'shadow',
          shadowStyle: {
            color: 'rgba(220, 223, 230, 1)',
          },
          z: 0,
        }
      },
      legend: {
        itemWidth: 12,// 标志图形的长度
        itemHeight: 5,// 标志图形的宽度
        textStyle: {
          //图例字体大小
          fontSize: 8,
        },
        data: dataAll.legend.length > 0 ? dataAll.legend : []
      },
      grid: {
        top: '25%',
        left: '3%',
        right: '3%',
        bottom: 10,
        containLabel: true
      },
      xAxis: [
        {
          type: 'category',
          data: dataAll.xNameArr,
          boundaryGap: true,
          axisLine: {
            lineStyle: {
              color: '#DCDFE6', //轴线的颜色
            },
          },
          axisLabel: {
            show: true,
            textStyle: {
              color: '#999',
              fontSize: 8,
            },
            interval: 0,
          },
          splitLine: {
            show: false
          },
          axisTick: {
            show: true
          },
        }
      ],
      yAxis: tempYAxis,
      dataZoom: dataAll.dataAll[0].length > 3 ? [{
        type: 'slider',
        show: true,
        xAxisIndex: [0],
        height: 10,//这里可以设置dataZoom的尺寸
        bottom: 0,
        startValue: 0,
        endValue: dataAll.dataAll[0].length,//初始化滚动条
      }] : '',
      series: tempSeries
    };
    chart.setOption(option);
    window.addEventListener("resize", function () {
      chart.resize();
    })
    chart.getZr().off('click')
    chart.getZr().on('click', (params) => {
      console.log(params, '====')
      const pointInPixel = [params.offsetX, params.offsetY];
      //点击第几个柱子
      let index;
      if (chart.containPixel('grid', pointInPixel)) {
        index = Math.abs(chart.convertFromPixel({ seriesIndex: 0 }, [params.offsetX, params.offsetY])[0]);
      }
      // console.log(index)
    })
  }
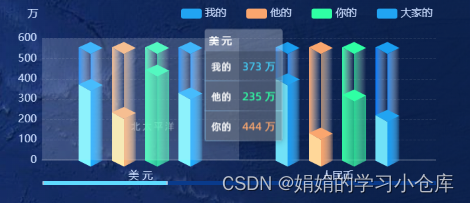
立体双柱状图(每组支持1~4根柱子)

<div id="dStereoBar" style="width: 628px;height: 282px;"></div>
::ng-deep.echarts_modal{
  height: 45px;
  //width: 132px;
  background: url(../../../../echarts_modal.png) no-repeat;
  background-size: 100% 100%;
  padding: 12px 10px 0;
  font-size: 15px;
  font-family: Alibaba PuHuiTi;
  font-weight: 400;
  color: #FFFFFF;
  span{
    margin-left: 17px;
    font-size: 17px;
    font-family: Alibaba PuHuiTi;
    font-weight: 400;
    color: #41D5FF;
  }
}
// 扩展柱子要同步扩展色卡:colorObj
const testData = [{
DATA:['373',401,556,'235',334],
YEAR_ID:'我的'
},{
DATA:['235',133,222,'145',224],
YEAR_ID:'他的'
},{
DATA:['444',321,551,'234',412],
YEAR_ID:'你的'
},{
DATA:['331',221,312,'412',123],
YEAR_ID:'大家的'
}]
this.initBarChartFn2('dStereoBar', testData, '万', ['美 元', '人民币', '日 元', '韩 元', '欧 元'])
initBarChartFn2(idName, DataArr, unit, xData) {
let maxDataItem = this.getMaxData(DataArr);
let lengendArr = [], maxData = []
for (let i = 0; i < DataArr.length; i++) {
lengendArr.push(DataArr[i].YEAR_ID)
}
for (let i = 0; i < xData.length; i++) {
maxData.push(maxDataItem)
}
let colorObj = {
"我的": {
backColorListLeft_0: '#0078FF',
backColorListLeft_1: 'rgba(255,255,255,0)',
backColorListRight_0: '#258AF2',
backColorListRight_1: 'rgba(255,255,255,0)',
backColorTop: '#199EF1',
colorListLeft_0: '#71E1F7',
colorListRight_0: 'rgba(25, 158, 241, 1)',
colorListRight_0_5: 'rgba(25, 158, 241, 0.5)',
colorListRight_1: 'rgba(25, 158, 241, 0.2)',
colorListTop_0: '#21A4F2',
},
"他的": {
backColorListLeft_0: '#FAA66E',
backColorListLeft_1: 'rgba(255,255,255,0)',
backColorListRight_0: '#AC866D',
backColorListRight_1: 'rgba(255,255,255,0)',
backColorTop: '#FAA66E',
colorListLeft_0: '#FFD799',
colorListRight_0: 'rgba(250, 166, 110, 1)',
colorListRight_0_5: 'rgba(250, 166, 110, 0.5)',
colorListRight_1: 'rgba(250, 166, 110, 0.2)',
colorListTop_0: '#FAA66E',
},
"你的": {
backColorListLeft_0: '#2fffa4',
backColorListLeft_1: 'rgba(255,255,255,0)',
backColorListRight_0: 'rgba(49,245,160,.7)',
backColorListRight_1: 'rgba(255,255,255,0)',
backColorTop: '#2fffa4',
colorListLeft_0: 'rgba(49,245,160,.7)',
colorListRight_0: 'rgba(49,245,160,.5)',
colorListRight_0_5: 'rgba(49,245,160,.5)',
colorListRight_1: 'rgba(49,245,160,.7)',
colorListTop_0: '#2fffa4',
},
"大家的": {
backColorListLeft_0: '#0078FF',
backColorListLeft_1: 'rgba(255,255,255,0)',
backColorListRight_0: '#258AF2',
backColorListRight_1: 'rgba(255,255,255,0)',
backColorTop: '#199EF1',
colorListLeft_0: '#71E1F7',
colorListRight_0: 'rgba(25, 158, 241, 1)',
colorListRight_0_5: 'rgba(25, 158, 241, 0.5)',
colorListRight_1: 'rgba(25, 158, 241, 0.2)',
colorListTop_0: '#21A4F2',
},
}
let legendData = []
for (let i = 0; i < lengendArr.length; i++) {
legendData.push({
name: lengendArr[i],
itemStyle: {
color: colorObj[lengendArr[i]]['colorListTop_0'],
}
})
}
var myChart = echarts.init(document.getElementById(idName));
let seriseData = []
for (let i = 0; i < DataArr.length; i++) {
// 柱体位置,支持4-根柱子,可继续扩展,如果柱子太多挤在一起缩小滚动条endValue参数
let position = [0, 0]
if (DataArr.length === 4){
position = i === 0 ? [-75, 10] : i === 1 ? [-25, 10] : i === 2 ? [25, 10] : [75, 10]
} else if (DataArr.length === 3){
position = i === 0 ? [-50, 10] : i === 1 ? [0, 10] : [50, 10]
} else if (DataArr.length === 2){
position = i === 0 ? [-25, 10] : [25, 10]
} else if (DataArr.length === 1){
position = [0, 10]
}
seriseData.push(
{
type: 'custom',
renderItem: function (params, api) {
const location = api.coord([api.value(0), api.value(1)])
return {
type: 'group',
children: [{
// 左背景
type: 'CubeLeft',
position: position,
shape: {
api,
xValue: api.value(0),
yValue: api.value(1),
x: location[0],
y: location[1],
xAxisPoint: api.coord([api.value(0), 0])
},
style: {
fill: new echarts.graphic.LinearGradient(1, 0, 0, 0, [{
offset: 0,
color: colorObj[DataArr[i].YEAR_ID]['backColorListLeft_1'] // 底部
}, {
offset: 1,
color: colorObj[DataArr[i].YEAR_ID]['backColorListLeft_0']// 顶部
}])
}
}, {
// 右侧边
type: 'CubeRight',
position: position,
shape: {
api,
xValue: api.value(0),
yValue: api.value(1),
x: location[0],
y: location[1],
xAxisPoint: api.coord([api.value(0), 0])
},
style: {
fill: new echarts.graphic.LinearGradient(1, 0, 0, 0, [{
offset: 0,
color: colorObj[DataArr[i].YEAR_ID]['backColorListRight_1'] // 底部
}, {
offset: 1,
color: colorObj[DataArr[i].YEAR_ID]['backColorListRight_0']// 顶部
}])
}
}, {
type: 'CubeTop',
position: position,
shape: {
api,
xValue: api.value(0),
yValue: api.value(1),
x: location[0],
y: location[1],
xAxisPoint: api.coord([api.value(0), 0])
},
style: {
fill: colorObj[DataArr[i].YEAR_ID]['backColorTop'] // 底部
}
}]
}
},
data: maxData
},
{
type: 'custom',
name: lengendArr[i],
renderItem: (params, api) => {
const location = api.coord([api.value(0), api.value(1)])
return {
type: 'group',
children: [{
type: 'CubeLeft',
position: position,
shape: {
api,
xValue: api.value(0),
yValue: api.value(1),
x: location[0],
y: location[1],
xAxisPoint: api.coord([api.value(0), 0])
},
style: {
fill: colorObj[DataArr[i].YEAR_ID]['colorListLeft_0']
}
}, {
type: 'CubeRight',
position: position,
shape: {
api,
xValue: api.value(0),
yValue: api.value(1),
x: location[0],
y: location[1],
xAxisPoint: api.coord([api.value(0), 0])
},
style: {
fill: new echarts.graphic.LinearGradient(1, 0, 0, 0, [{
offset: 0,
color: colorObj[DataArr[i].YEAR_ID]['colorListRight_1'] // 底部
}, {
offset: 0.25,
color: colorObj[DataArr[i].YEAR_ID]['colorListRight_0_5']// 顶部
}, {
offset: 1,
color: colorObj[DataArr[i].YEAR_ID]['colorListRight_0']// 顶部
}])
}
}, {
type: 'CubeTop',
position: position,
shape: {
api,
xValue: api.value(0),
yValue: api.value(1),
x: location[0],
y: location[1],
xAxisPoint: api.coord([api.value(0), 0])
},
style: {
fill: colorObj[DataArr[i].YEAR_ID]['colorListTop_0']
}
}]
}
},
data: DataArr[i].DATA
},
{
type: 'bar',
name: lengendArr[i],
label: {
normal: {
show: false,
position: 'top',
fontSize: 16,
color: '#fff',
offset: [2, -25]
}
},
itemStyle: {
color: 'transparent',
},
data: DataArr[i].DATA
}
)
}
// 绘制左侧面
const CubeLeft = echarts.graphic.extendShape({
shape: {
x: 0,
y: 0
},
buildPath: function (ctx, shape) {
// 会canvas的应该都能看得懂,shape是从custom传入的
const xAxisPoint = shape.xAxisPoint;
const c0 = [shape.x, shape.y];
const c1 = [shape.x - 18, shape.y - 10];
const c2 = [xAxisPoint[0] - 18, xAxisPoint[1] - 9];
const c3 = [xAxisPoint[0], xAxisPoint[1]];
ctx.moveTo(c0[0], c0[1]).lineTo(c1[0], c1[1]).lineTo(c2[0], c2[1]).lineTo(c3[0], c3[1]).closePath();
}
})
// 绘制右侧面
const CubeRight = echarts.graphic.extendShape({
shape: {
x: 0,
y: 0
},
buildPath: function (ctx, shape) {
const xAxisPoint = shape.xAxisPoint;
const c1 = [shape.x, shape.y];
const c2 = [xAxisPoint[0], xAxisPoint[1]];
const c3 = [xAxisPoint[0] + 18, xAxisPoint[1] - 9];
const c4 = [shape.x + 18, shape.y - 9];
ctx.moveTo(c1[0], c1[1]).lineTo(c2[0], c2[1]).lineTo(c3[0], c3[1]).lineTo(c4[0], c4[1]).closePath();
}
})
// 绘制顶面
const CubeTop = echarts.graphic.extendShape({
shape: {
x: 0,
y: 0
},
buildPath: function (ctx, shape) {
const c1 = [shape.x, shape.y];
const c2 = [shape.x + 18, shape.y - 9];
const c3 = [shape.x, shape.y - 18];
const c4 = [shape.x - 18, shape.y - 10];
ctx.moveTo(c1[0], c1[1]).lineTo(c2[0], c2[1]).lineTo(c3[0], c3[1]).lineTo(c4[0], c4[1]).closePath();
}
})
// 注册三个面图形
echarts.graphic.registerShape('CubeLeft', CubeLeft)
echarts.graphic.registerShape('CubeRight', CubeRight)
echarts.graphic.registerShape('CubeTop', CubeTop)
var option = {
legend: {
data: legendData,
textStyle: {
color: '#CADCFE',
fontSize: 16
},
right: 0,
top: 12,
itemWidth: 31,
itemHeight: 15,
itemGap: 30
},
tooltip: {
trigger: 'axis',
padding: 0,
borderWidth: 0,
backgroundColor: 'rgba(255,255,255,0.3)',
axisPointer: {
type: 'shadow'
},
formatter: function (params) {
let val = `<div style="font-size: 15px;padding:6px;font-family: AlibabaPuHuiTiR;font-weight: 400;color: #FFFFFF;">${params[0].name}</div>`
$(params).each(function (idx, itm) {
if (itm.seriesType == "bar") {
if (itm.seriesName == "我的") {
val += `<div class="echarts_modal">${itm.seriesName}<span>${itm.value} 万</span></div>`
}
if (itm.seriesName == "你的") {
val += `<div class="echarts_modal">${itm.seriesName}<span style="color: #FAA66E">${itm.value} 万</span></div>`
}
if (itm.seriesName == "他的") {
val += `<div class="echarts_modal">${itm.seriesName}<span style="color: #2fffa4">${itm.value} 万</span></div>`
}
}
});
return val;
}
},
grid: {
top: "22%",
left: "0%",
bottom: "2%",
right: "0%",
containLabel: true
},
xAxis: {
type: 'category',
data: xData,
axisLine: {
show: true,
lineStyle: {
color: 'rgba(252, 252, 252, 0.6)',
width: 1
}
},
axisTick: {
show: false,
},
axisLabel: {
fontSize: 16,
margin: 16,
color: '#CADCFE',
}
},
yAxis: {
name: unit,
type: 'value',
nameTextStyle: {
padding: [0, 28, 0, 0],
color: '#CADCFE',
fontSize: 16,
lineHeight: -8,
},
axisLine: {
show: false,
lineStyle: {
color: 'rgba(252, 252, 252, 0.3)',
type: 'solid', // 坐标轴的分割线类型还有其他关于轴线的样式自行开发吧
width: 2
},
},
splitLine: {
lineStyle: {
type: "dashed", //设置网格线类型 dotted:虚线 solid:实线
width: 1,
color: 'rgba(252, 252, 252, 0.1)'
},
show: true
},
axiosTick: {
show: false
},
axisLabel: {
fontSize: 16,
interval: 0,
color: '#CADCFE'
},
nameGap: 40
},
dataZoom: [{
xAxisIndex: [0],
height: 6,
type: 'slider',
startValue: 0,//默认为0
endValue: 1,//默认为100
showDataShadow: false,
show: true,
bottom: '0px',
borderColor: 'transparent',
backgroundColor: 'rgba(9, 58, 139, 1)',
fillerColor: 'rgba(95, 218, 255, 1)',
moveHandleSize: 0,
moveHandleStyle: {
color: 'rgba(0,0,0,0.0)',
shadowColor: 'rgba(0,0,0,0)',
borderCap: 'round',
},
showDetail: false
}],
series: seriseData
}
myChart.clear();
myChart.setOption(option);
window.addEventListener("resize", function (ev) {
myChart.resize();
})
}
饼图
3d动态饼图
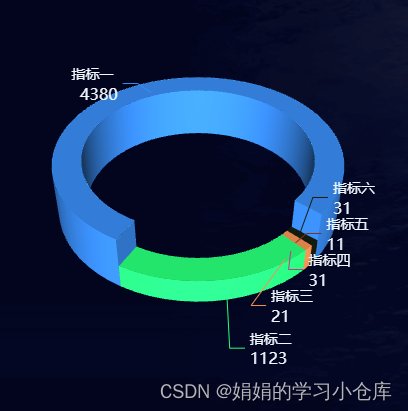
const data = [
                    {
                        itemStyle: {color: "#398BF1"},
                        name : "指标一",
                        value : 4380
                    },
                    {
                        itemStyle: {color: "#27FF78"},
                        name : "指标二",
                        value : 1123
                    },
                    {
                        itemStyle: {color: "#F29052"},
                        name : "指标三",
                        value : 21
                    },
                    {
                        itemStyle: {color: "#cc338b"},
                        name : "指标四",
                        value : 31
                    },
                    {
                        itemStyle: {color: "#80341f"},
                        name : "指标五",
                        value : 11
                    },
                    {
                        itemStyle: {color: "#161d10"},
                        name : "指标六",
                        value : 31
                    }
                ]
 				// 绑定div的id属性,显示数据
                PieThreeD('pieLoopChart',data);//默认政治面貌
js:
function PieThreeD(idName,pieOtionData) {
console.log(pieOtionData)
var option,
optionData = pieOtionData;
let hoveredIndex = "";
let curIndex = 0;
echarts4.init(document.getElementById(idName)).dispose();
//构建3d饼状图
let myChart = echarts4.init(document.getElementById(idName));
// 传入数据生成 option
option = getPie3D(optionData, 0.8);
myChart.clear();
myChart.setOption(option);
//是否需要label指引线,如果要就添加一个透明的2d饼状图并调整角度使得labelLine和3d的饼状图对齐,并再次setOption
option.series.push({
name: 'pie2d',
type: 'pie',
labelLine: {
length: 10,
length2: 15
},
label: {
normal: {
textStyle: {
color: '#595959', // 提示文字颜色
fontSize: 18 // 提示文字大小
}
}
},
startAngle: -20, //起始角度,支持范围[0, 360]。
clockwise: false,//饼图的扇区是否是顺时针排布。上述这两项配置主要是为了对齐3d的样式
minAngle: 5, //最小的扇区角度(0 ~ 360),用于防止某个值过小导致扇区太小影响交互
avoidLabelOverlap: true, //是否启用防止标签重叠策略
radius: ['30%', '40%'],
center: ['50%', '50%'],
data: optionData,
itemStyle: {
opacity: 0
}
});
// myChart.clear();
// myChart.setOption(option);
const highLight = (params) => {
let isSelected;
let isHovered;
let startRatio;
let endRatio;
let k;
// 如果触发 mouseover 的扇形当前已高亮,则不做操作
if (hoveredIndex === params.seriesIndex) {
return;
// 否则进行高亮及必要的取消高亮操作
} else {
// 如果当前有高亮的扇形,取消其高亮状态(对 option 更新)
if (hoveredIndex !== "") {
// 从 option.series 中读取重新渲染扇形所需的参数,将是否高亮设置为 false。
isSelected = option.series[hoveredIndex].pieStatus.selected;
isHovered = false;
startRatio = Number((option.series[hoveredIndex].pieData.startRatio).toFixed(2));
endRatio = Number((option.series[hoveredIndex].pieData.endRatio).toFixed(2));
k = option.series[hoveredIndex].pieStatus.k;
// 对当前点击的扇形,执行取消高亮操作(对 option 更新)
option.series[hoveredIndex].parametricEquation =
getParametricEquation(
startRatio,
endRatio,
isSelected,
isHovered,
k,
30
);
option.series[hoveredIndex].pieStatus.hovered = isHovered;
// 将此前记录的上次选中的扇形对应的系列号 seriesIndex 清空
hoveredIndex = "";
}
// 如果触发 mouseover 的扇形不是透明圆环,将其高亮(对 option 更新)
if (params.seriesName !== "mouseoutSeries") {
// 从 option.series 中读取重新渲染扇形所需的参数,将是否高亮设置为 true。
if (option.series[params.seriesIndex].pieStatus != undefined) {
isSelected = option.series[params.seriesIndex].pieStatus.selected;
// isHovered = true;
startRatio = Number((option.series[params.seriesIndex].pieData.startRatio).toFixed(2));
endRatio = Number((option.series[params.seriesIndex].pieData.endRatio).toFixed(2));
k = option.series[params.seriesIndex].pieStatus.k;
// 对当前点击的扇形,执行高亮操作(对 option 更新)
option.series[params.seriesIndex].parametricEquation =
getParametricEquation(
startRatio,
endRatio,
isSelected,
isHovered,
k,
80
);
option.series[params.seriesIndex].pieStatus.hovered = isHovered;
// 记录上次高亮的扇形对应的系列号 seriesIndex
hoveredIndex = params.seriesIndex;
}
}
// 使用更新后的 option,渲染图表
myChart.setOption(option);
}
}
let timer = null;
const pipeAnimation = async () => {
timer = setInterval(() => {
curIndex = curIndex + 1
if (curIndex === pieOtionData.length) curIndex = 0
highLight({
seriesIndex: curIndex,
seriesName: optionData[curIndex].name
})
}, 2000);
};
pipeAnimation()
myChart.clear();
myChart.setOption(option);
bindListen(myChart);
function bindListen(myChart) {
// 监听鼠标事件,实现饼图选中效果(单选),近似实现高亮(放大)效果。
let selectedIndex = '';
let hoveredIndex = '';
// 监听 mouseover,近似实现高亮(放大)效果
myChart.on('mouseover', function (params) {
clearTimeout(timer);
highLight(params)
});
myChart.on('mouseout', function (params) {
clearTimeout(timer);
pipeAnimation();
});
// 修正取消高亮失败的 bug
myChart.on('globalout', function () {
// 准备重新渲染扇形所需的参数
let isSelected;
let isHovered;
let startRatio;
let endRatio;
let k;
if (hoveredIndex !== '') {
// 从 option.series 中读取重新渲染扇形所需的参数,将是否高亮设置为 true。
isSelected = option.series[hoveredIndex].pieStatus.selected;
isHovered = false;
k = option.series[hoveredIndex].pieStatus.k;
startRatio = Number((option.series[params.seriesIndex].pieData.startRatio).toFixed(2));
endRatio = Number((option.series[params.seriesIndex].pieData.endRatio).toFixed(2));
// 对当前点击的扇形,执行取消高亮操作(对 option 更新)
option.series[hoveredIndex].parametricEquation = getParametricEquation(startRatio, endRatio,
isSelected,
isHovered, k, option.series[hoveredIndex].pieData.value);
option.series[hoveredIndex].pieStatus.hovered = isHovered;
// 将此前记录的上次选中的扇形对应的系列号 seriesIndex 清空
hoveredIndex = '';
}
// 使用更新后的 option,渲染图表
myChart.setOption(option);
});
}
function getPie3D(pieData, internalDiameterRatio) {
const series = [];
// 总和
let sumValue = 0;
let startValue = 0;
let endValue = 0;
const legendData = [];
const k =
typeof internalDiameterRatio !== "undefined"
? (1 - internalDiameterRatio) / (1 + internalDiameterRatio)
: 1 / 3;
// 为每一个饼图数据,生成一个 series-surface 配置
for (let i = 0; i < pieData.length; i += 1) {
sumValue += pieData[i].value;
const seriesItem = {
name:
typeof pieData[i].name === "undefined"
? `series${i}`
: pieData[i].name,
type: "surface",
parametric: true,
wireframe: {
show: false,
},
pieData: pieData[i],
pieStatus: {
selected: false,
hovered: false,
k,
},
};
if (typeof pieData[i].itemStyle !== "undefined") {
const {itemStyle} = pieData[i];
// eslint-disable-next-line @typescript-eslint/no-unused-expressions
typeof pieData[i].itemStyle.color !== "undefined"
? (itemStyle.color = pieData[i].itemStyle.color)
: null;
// eslint-disable-next-line @typescript-eslint/no-unused-expressions
typeof pieData[i].itemStyle.opacity !== "undefined"
? (itemStyle.opacity = pieData[i].itemStyle.opacity)
: null;
seriesItem.itemStyle = itemStyle;
}
series.push(seriesItem);
}
// 使用上一次遍历时,计算出的数据和 sumValue,调用 getParametricEquation 函数,
// 向每个 series-surface 传入不同的参数方程 series-surface.parametricEquation,也就是实现每一个扇形。
for (let i = 0; i < series.length; i += 1) {
endValue = startValue + series[i].pieData.value;
series[i].pieData.startRatio = startValue / sumValue;
series[i].pieData.endRatio = endValue / sumValue;
series[i].parametricEquation = getParametricEquation(
series[i].pieData.startRatio,
series[i].pieData.endRatio,
false,
false,
k,
// 我这里做了一个处理,使除了第一个之外的值都是10
30
);
startValue = endValue;
legendData.push(series[i].name);
}
// 准备待返回的配置项,把准备好的 legendData、series 传入。
const option = {
// animation: false,
label: {
show: true,
position: 'outside',
rich: {
b: {
color: 'rgba(240, 247, 255, 1)',
fontSize: 14,
lineHeight: 24
},
c: {
color: 'rgba(240, 247, 255, 1)',
fontSize: 16,
},
},
formatter: '{b|{b} \n}{c|{c}}',
},
tooltip: {
formatter: params => {
if (params.seriesName !== 'mouseoutSeries' && params.seriesName !== 'pie2d') {
let val = option.series[params.seriesIndex].pieData.value;
let bfb = ((option.series[params.seriesIndex].pieData.endRatio - option.series[params.seriesIndex].pieData.startRatio) *
100).toFixed(2);
return `${params.seriesName}<br/>` +
`<span style="display:inline-block;margin-right:5px;border-radius:10px;width:10px;height:10px;background-color:${params.color};"></span>` +
`${val} `+`(${bfb}%)`;
}
}
},
xAxis3D: {
min: -1,
max: 1,
},
yAxis3D: {
min: -1,
max: 1,
},
zAxis3D: {
min: -1,
max: 1,
},
grid3D: {
show: false,
viewControl: { //3d效果可以放大、旋转等,请自己去查看官方配置
alpha: 40, //角度
distance: 280,//调整视角到主体的距离,类似调整zoom
rotateSensitivity: 0, //设置为0无法旋转
zoomSensitivity: 0, //设置为0无法缩放
panSensitivity: 0, //设置为0无法平移
autoRotate: false //自动旋转
},
boxHeight: 5,
// top: "-20%",
// 后处理特效可以为画面添加高光、景深、环境光遮蔽(SSAO)、调色等效果。可以让整个画面更富有质感。
postEffect: {
// 配置这项会出现锯齿,请自己去查看官方配置有办法解决
enable: false,
bloom: {
enable: true,
bloomIntensity: 0.1,
},
SSAO: {
enable: true,
quality: "medium",
radius: 2,
},
// temporalSuperSampling: {
// enable: true,
// },
},
},
series,
};
return option;
}
// 生成扇形的曲面参数方程,用于 series-surface.parametricEquation
function getParametricEquation(startRatio, endRatio, isSelected, isHovered, k, h) {
// 计算
let midRatio = (startRatio + endRatio) / 2;
let startRadian = startRatio * Math.PI * 2;
let endRadian = endRatio * Math.PI * 2;
let midRadian = midRatio * Math.PI * 2;
// 如果只有一个扇形,则不实现选中效果。
if (startRatio === 0 && endRatio === 1) {
isSelected = false;
}
// 通过扇形内径/外径的值,换算出辅助参数 k(默认值 1/3)
k = typeof k !== 'undefined' ? k : 1 / 3;
// 计算选中效果分别在 x 轴、y 轴方向上的位移(未选中,则位移均为 0)
let offsetX = isSelected ? Math.cos(midRadian) * 0.1 : 0;
let offsetY = isSelected ? Math.sin(midRadian) * 0.1 : 0;
// 计算高亮效果的放大比例(未高亮,则比例为 1)
let hoverRate = isHovered ? 1.05 : 1;
// 返回曲面参数方程
return {
u: {
min: -Math.PI,
max: Math.PI * 3,
step: Math.PI / 32
},
v: {
min: 0,
max: Math.PI * 2,
step: Math.PI / 20
},
x: function (u, v) {
if (u < startRadian) {
return offsetX + Math.cos(startRadian) * (1 + Math.cos(v) * k) * hoverRate;
}
if (u > endRadian) {
return offsetX + Math.cos(endRadian) * (1 + Math.cos(v) * k) * hoverRate;
}
return offsetX + Math.cos(u) * (1 + Math.cos(v) * k) * hoverRate;
},
y: function (u, v) {
if (u < startRadian) {
return offsetY + Math.sin(startRadian) * (1 + Math.cos(v) * k) * hoverRate;
}
if (u > endRadian) {
return offsetY + Math.sin(endRadian) * (1 + Math.cos(v) * k) * hoverRate;
}
return offsetY + Math.sin(u) * (1 + Math.cos(v) * k) * hoverRate;
},
z: function (u, v) {
if (u < -Math.PI * 0.5) {
return Math.sin(u);
}
if (u > Math.PI * 2.5) {
return Math.sin(u) * h * .1;
}
return Math.sin(v) > 0 ? 1 * h * .1 : -1;
}
};
}
function fomatFloat(num, n) {
var f = parseFloat(num);
if (isNaN(f)) {
return false;
}
f = Math.round(num * Math.pow(10, n)) / Math.pow(10, n); // n 幂
var s = f.toString();
var rs = s.indexOf('.');
//判定如果是整数,增加小数点再补0
if (rs < 0) {
rs = s.length;
s += '.';
}
while (s.length <= rs + n) {
s += '0';
}
return s;
}
}


 1192
1192


 被折叠的 条评论
为什么被折叠?
被折叠的 条评论
为什么被折叠?
 到【灌水乐园】发言


