


之前使用QcustomPlot作图时,想实现数字示波器那种曲线动而网格线保持不动的效果,类似这种,参考连接http://t.csdn.cn/mz1Lg

但是单纯使用QcustomPlot库有关坐标轴网格线的函数均无法实现,于是自己找了个办法实现这种效果,红线为坐标轴的网格线,黑线为自己设置的网格线

过程如下:
1、声明一个Qcustomplot对象并设置一下网格线作为对照
    this->setGeometry(0,0,1280,800);//设置窗口大小
    QCustomPlot *customPlot = new QCustomPlot(this);
    this->setCentralWidget(customPlot);

    customPlot->setInteraction(QCP::iRangeDrag);//允许使用鼠标拖动坐标轴
    customPlot->xAxis->setTicks(false);//关闭坐标轴刻度
    customPlot->yAxis->setTicks(false);
    customPlot->xAxis->grid()->setPen(QPen(Qt::red));//设置网格线颜色,为了更好的作比较
    customPlot->yAxis->grid()->setPen(QPen(Qt::red));
2、定义一个画笔,用于自己网格线样式的修改,参考连接:http://t.csdn.cn/GI6pE,非常不错的方法,能够设置自己想要的线样式
    QPen pen;//定义一个画笔
    QVector<qreal> dashes;
    qreal space = 1;
    dashes<<0.5<<space;     //设置线条样式,点宽,空白宽
    pen.setDashPattern(dashes);     //向画笔载入线条样式
    pen.setWidth(2);    //线条宽度
    pen.setColor(QColor(Qt::black));
3、向图层添加线段或线
Qcustomplot默认有六个图层"background","grid","main","axes","legend","overlay",如果不想网格线遮住QCPGraph *即所画的曲线,那就需要在grid图层画网格线(background没试过)
    //窗口的宽度和高度,也可以使用customPlot->width();customPlot->height()读取,但是窗口未出现之前并不能读取到正确的数值
    int win_width = 1280;
    int win_height = 800;

    for(int i=0;i<=1280;i+=win_width/10)
    {
        //直线类对象,指定两个点就能画无限延长的线,也可以使用线段类QCPItemLine
        //QCPItemLine只是把point1和point2换为start和end
        QCPItemStraightLine *grid_line_y = new QCPItemStraightLine(customPlot);

        //point1和point2是以像素点来描述的,setCoords默认是坐标形式
        grid_line_y->point1->setType(QCPItemPosition::ptAbsolute);
        grid_line_y->point2->setType(QCPItemPosition::ptAbsolute);

        grid_line_y->point1->setCoords(i,0);
        grid_line_y->point2->setCoords(i,win_height);

        //修改直线样式
        grid_line_y->setPen(pen);
        //放在grid层
        grid_line_y->setLayer("grid");
    }
完整代码:
#include "mainwindow.h"
#include <QDebug>
#include "qcustomplot.h"
MainWindow::MainWindow(QWidget *parent)
    : QMainWindow(parent)
{
    this->setGeometry(0,0,1280,800);//设置窗口大小
    QCustomPlot *customPlot = new QCustomPlot(this);
    this->setCentralWidget(customPlot);

    customPlot->setInteraction(QCP::iRangeDrag);//允许使用鼠标拖动坐标轴
    customPlot->xAxis->setTicks(false);//关闭坐标轴刻度
    customPlot->yAxis->setTicks(false);
    customPlot->xAxis->grid()->setPen(QPen(Qt::red));//设置网格线颜色,为了更好的作比较
    customPlot->yAxis->grid()->setPen(QPen(Qt::red));

    QPen pen;//定义一个画笔
    QVector<qreal> dashes;
    qreal space = 1;
    dashes<<0.5<<space;     //设置线条样式,点宽,空白宽
    pen.setDashPattern(dashes);     //向画笔载入线条样式
    pen.setWidth(2);    //线条宽度
    pen.setColor(QColor(Qt::black));

    //窗口的宽度和高度,也可以使用customPlot->width();customPlot->height()读取,但是窗口未出现之前并不能读取到正确的数值
    int win_width = 1280;
    int win_height = 800;

    for(int i=0;i<=win_width;i+=win_width/10)
    {
        //直线类对象,指定两个点就能画无限延长的线,也可以使用线段类QCPItemLine
        //QCPItemLine只是把point1和point2换为start和end
        QCPItemStraightLine *grid_line_y = new QCPItemStraightLine(customPlot);

        //point1和point2是以像素点来描述的,setCoords默认是坐标形式
        grid_line_y->point1->setType(QCPItemPosition::ptAbsolute);
        grid_line_y->point2->setType(QCPItemPosition::ptAbsolute);

        grid_line_y->point1->setCoords(i,0);
        grid_line_y->point2->setCoords(i,win_height);

        //修改直线样式
        grid_line_y->setPen(pen);
        //放在grid层
        grid_line_y->setLayer("grid");
    }
}

MainWindow::~MainWindow()
{
}
额外的一点小东西:
1、如果想要把grid图层里面自己画的线清除,可以这样:
    foreach (QCPLayerable *grid_line, customPlot->layer("grid")->children()) {
        QCPItemStraightLine* line = dynamic_cast<QCPItemStraightLine*>(grid_line);
        if(line!=nullptr)
            customPlot->removeItem(line);
    }
遍历grid层的子对象,将每个子对象转换为将子项转换为 QCPItemStraightLine 类型,如果成功了就删除它,前提是QCPItemStraightLine*要和自己所画网格线类型对应起来,并且grid层中没有其他有用的QCPItemStraightLine 类型
2、如果不想坐标轴遮住你的网格线


可以这样:
grid_line_y->setClipToAxisRect(false);3、关于直线设置起点终点的细节
grid_line_y->point1->setCoords设置的像素点是相对于customPlot来说的,这与坐标轴包起来的范围有所区别
前者可以通过customPlot->width()获取,而后者是customPlot->axisRect()->width()
customPlot->axisRect()->setBackground(QBrush(Qt::gray));//设置坐标轴包起来的区域背景颜色为灰色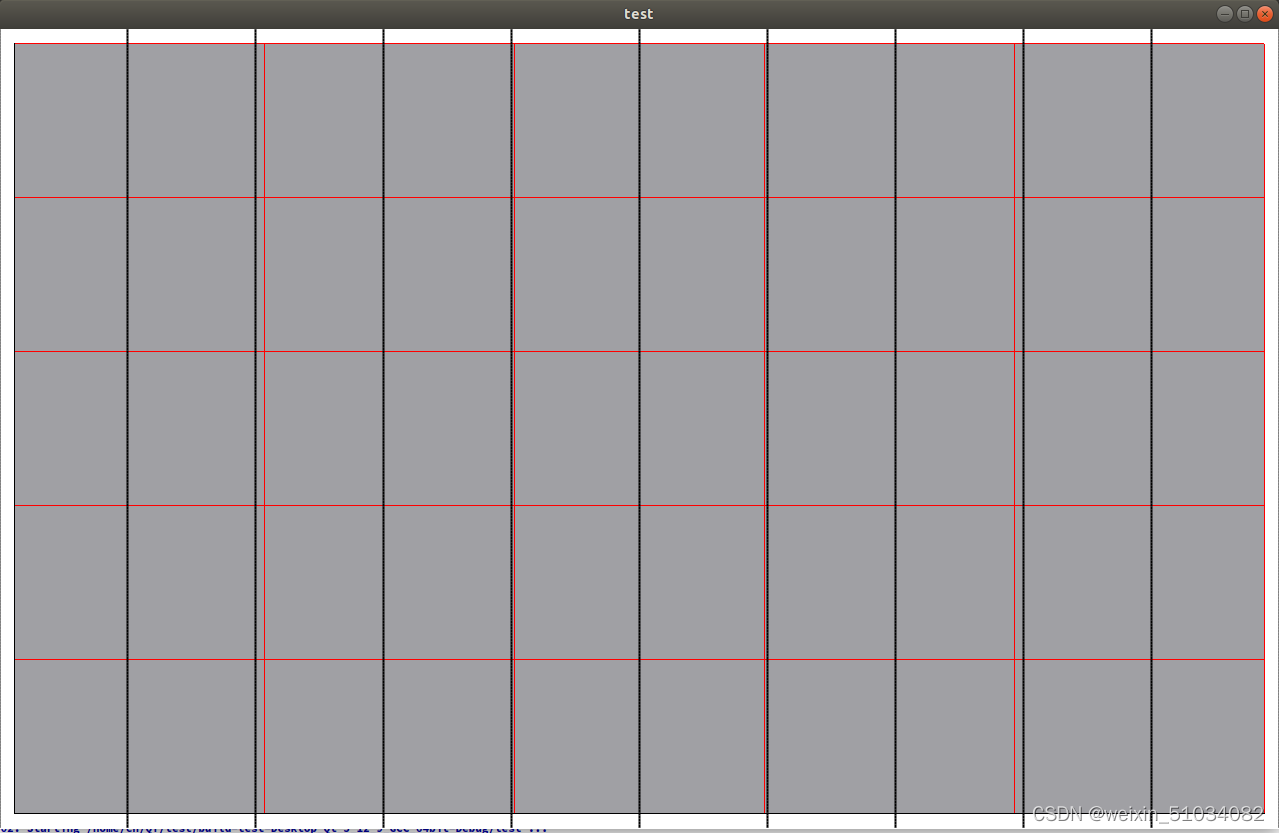
可以看到
customPlot->axisRect()范围是稍小于customPlot的


 3503
3503


 被折叠的 条评论
为什么被折叠?
被折叠的 条评论
为什么被折叠?
 到【灌水乐园】发言


