


目标:一个figure里包含两个子图,其中第一个子图只标纵标签,第二个横纵标签均标记。两个子图刻度间隔一致。
工具:matlab
第一版错误代码:
x1 = rand(1,20);
x2 = rand(1,20);

time = datetime(2000,1,1) + calmonths(1:20);

subplot(211)
plot(x1);
set(gca,"xtick",0:5:20,"xticklabel",[]);  %先设置刻度间隔,再隐藏刻度label
ylabel("x1");

subplot(212)
plot(time, x2);
set(gca,"xtick",0:5:20,"xticklabel",[]);  label
ylabel("x2");
报错:错误使用 matlab.graphics.axis.decorator.DatetimeRuler/validateTicks
值必须为包含递增的日期时间值的向量。
出错 matlab.graphics.axis.decorator.DatetimeRuler/setTicksDelegate
出错 test (line 14)
set(gca,“xtick”,0:5:20,“xticklabel”,[]);
实验多次,发现只要我的横坐标类型是datetime,用xticks设置刻度间隔就会报上述错误,且查了各种资料,均解决不了问题。猜想可能是数据类型的原因,通过查询matlab官方文档(https://ww2.mathworks.cn/help/releases/R2016b/matlab/ref/datetick.html?s_tid=doc_ta),文档建议只是plot二维折线图,用datetime就行,没必要用dateticks.但实际实验下来,datetime不能完全满足需求,接下来试了试dateticks.用下面三行代码生成x轴内容:
startDate = datenum(‘02-01-1962’);
endDate = datenum(‘11-15-2012’);
xData = linspace(startDate,endDate,50);
再plot(xDate, x2), 再通过xticks设置标签间隔。实验发现,依旧达不到效果,而且输出的图更为离谱,有时没有折线,有时直接没有第二个子图…看来,dateticks也不得行。
既然不能自动生成,那我只能手动了。通过手动生成时间的列表,然后指定其为x轴,再进行横坐标标签间隔设置。最后的代码如下:
x1 = rand(1,20);
x2 = rand(1,20);

time = [];
for year = 2000:2002
    for month = 1:12
        time = [time, num2str(year) + "-0" + num2str(month)];
    end
end

subplot(211)
plot(x1);
set(gca,"xtick",0:5:20,"xticklabel",[]);  %先设置刻度间隔,再隐藏刻度label
ylabel("x1");

subplot(212)
plot( x2);
set(gca,"xtick",0:5:20);
set(gca,"xticklabel",time(1:5:21));
xtickangle(45)
ylabel("x2");
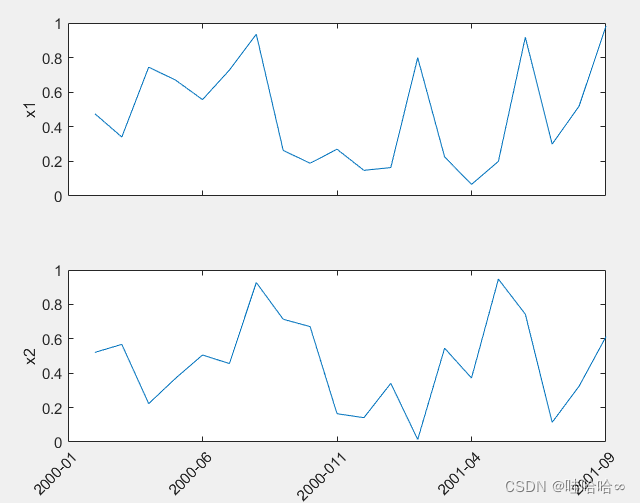
完成!


 1万+
1万+


 被折叠的 条评论
为什么被折叠?
被折叠的 条评论
为什么被折叠?
 到【灌水乐园】发言


