


———————————————————————————————
函数介绍

MATLAB官网描述:
https://ww2.mathworks.cn/help/matlab/ref/subplot.html?searchHighlight=subplot&s_tid=srchtitle_support_results_1_subplot
二子图
代码主体
clc;clear
%% 第一个子图窗口
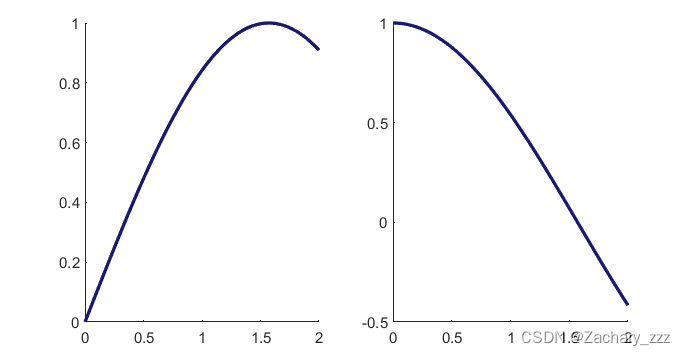
subplot(1,2,1); % 创建
hold on
x1 = linspace(0,2,400);
y1 = sin(x1);
l1 = plot(x1, y1,'Color','#191970','LineWidth',2);
%% 第二个子图窗口
subplot(1,2,2); % 创建
hold on
x2 = linspace(0,2,400);
y2 = cos(x2);
l2 = plot(x2, y2,'Color','#191970','LineWidth',2);
结果演示
———————————————————————————————
三子图
代码主体
%% 第一个子图窗口
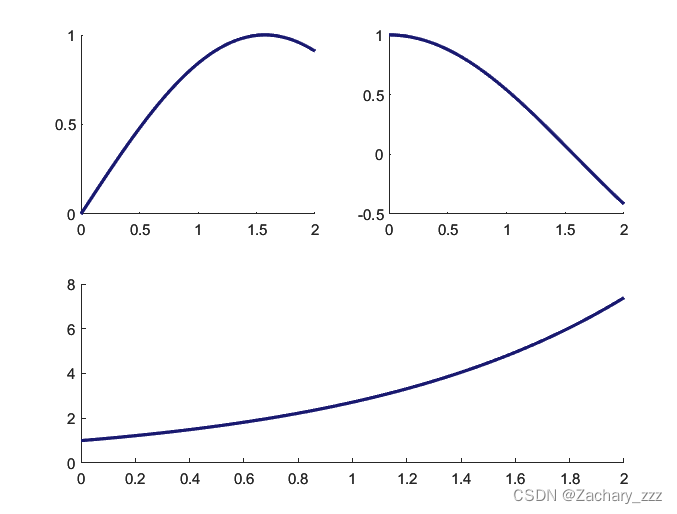
subplot(2,2,1); % 创建
hold on
x1 = linspace(0,2,400);
y1 = sin(x1);
l1 = plot(x1, y1,'Color','#191970','LineWidth',2);
%% 第二个子图窗口
subplot(2,2,2); % 创建
hold on
x2 = linspace(0,2,400);
y2 = cos(x2);
l2 = plot(x2, y2,'Color','#191970','LineWidth',2);
%% 第三个子图窗口
subplot(1,2,2); % 创建
hold on
x3 = linspace(0,2,400);
y3 = exp(x3);
l3 = plot(x3, y3,'Color','#191970','LineWidth',2);
结果演示
———————————————————————————————
四子图
代码主体
clc;clear
%% 第一个子图窗口
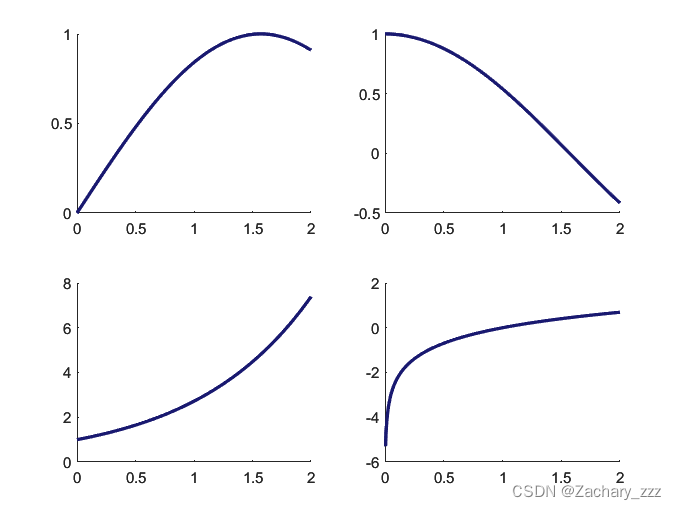
subplot(2,2,1); % 创建
hold on
x1 = linspace(0,2,400);
y1 = sin(x1);
l1 = plot(x1, y1,'Color','#191970','LineWidth',2);
%% 第二个子图窗口
subplot(2,2,2); % 创建
hold on
x2 = linspace(0,2,400);
y2 = cos(x2);
l2 = plot(x2, y2,'Color','#191970','LineWidth',2);
%% 第三个子图窗口
subplot(2,2,3); % 创建
hold on
x3 = linspace(0,2,400);
y3 = exp(x3);
l3 = plot(x3, y3,'Color','#191970','LineWidth',2);
%% 第四个子图窗口
subplot(2,2,4); % 创建
hold on
x4 = linspace(0,2,400);
y4 = log(x4);
l4 = plot(x4, y4,'Color','#191970','LineWidth',2);
结果演示
———————————————————————————————
四子图–进化
代码主体
clc;clear
%% 第一个子图窗口
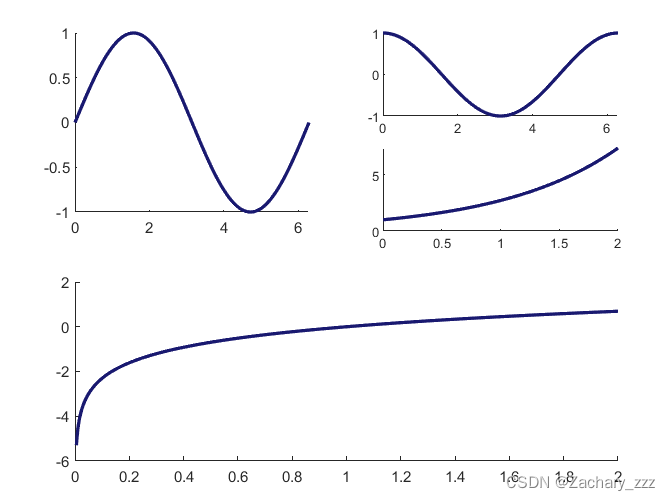
subplot(2,2,1); % 创建
hold on
x1 = linspace(0,2*pi,400);
y1 = sin(x1);
l1 = plot(x1, y1,'Color','#191970','LineWidth',2);
%% 第二个子图窗口
subplot(4,2,2); % 创建
hold on
x2 = linspace(0,2*pi,400);
y2 = cos(x2);
l2 = plot(x2, y2,'Color','#191970','LineWidth',2);
%% 第三个子图窗口
subplot(4,2,4); % 创建
hold on
x3 = linspace(0,2,400);
y3 = exp(x3);
l3 = plot(x3, y3,'Color','#191970','LineWidth',2);
%% 第四个子图窗口
subplot(2,1,2); % 创建
hold on
x4 = linspace(0,2,400);
y4 = log(x4);
l4 = plot(x4, y4,'Color','#191970','LineWidth',2);
结果演示
———————————————————————————————
下期预告
下期将介绍如何在一图窗内实现多子图同时动态绘制!
感兴趣的伙伴不要错过哦!
(原理:多张多子图的叠加)


 4818
4818


 被折叠的 条评论
为什么被折叠?
被折叠的 条评论
为什么被折叠?
 到【灌水乐园】发言


