


 color: function (params) {
                var colorList = ['#48E5E5', '#3254DD']
                if (params.dataIndex % 2 == 0) {
                  return colorList[0]
                } else {
                  return colorList[1]
                }
              },
只需要将此函数粘贴至 你想要实现的柱状图的 series => itemStyle => normal中
完整代码如下 粘贴至option中就可以使用
 return {
      tooltip: {},
      grid: {
        top: '20%',
        left: '9%',
        right: '9%',
        bottom: '20%',
      },
      xAxis: {
        data: ['区域1', '区域2', '区域3', '区域4', '区域5', '区域6'],
        type: 'category',
        axisLabel: {
          show: true,
          textStyle: {
            color: '#FFFFFF',
          },
        },
        splitLine: {
          show: true,
          lineStyle: {
            type: 'solid',
            color: '#BDBDBD15',
          },
        },
      },
      yAxis: {
        minInterval: 1,
        type: 'value',
        axisLabel: {
          show: true,
          textStyle: {
            color: '#FFFFFF',
          },
        },
        splitLine: {
          show: true,
          lineStyle: {
            type: 'solid',
            color: '#BDBDBD15',
          },
        },
      },
      series: [
        {
          name: '排行',
          type: 'bar',
          barWidth: 8,
          barMinHeight: 1,
          emphasis: {
            label: {
              // width:15,
            },
          },
          barWidth: 15,
          itemStyle: {
            normal: {
              barBorderRadius: 0,
              label: {
                show: true,
                position: 'right',
                color: '#4d4d4d',
              },
              // 将函数粘贴至此处
              color: function (params) {
                // 定义换色数组
                var colorList = ['#48E5E5', '#3254DD']
                if (params.dataIndex % 2 == 0) {
                  return colorList[0]
                } else {
                  return colorList[1]
                }
              },
            },
          },
          data: [75, 125, 175, 75, 125, 150],
        },
      ],
    }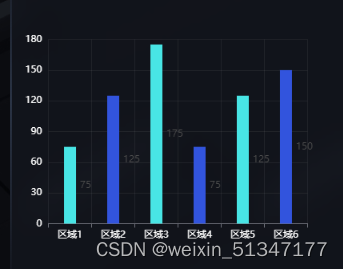
这是效果图


 1195
1195


 被折叠的 条评论
为什么被折叠?
被折叠的 条评论
为什么被折叠?
 到【灌水乐园】发言


