


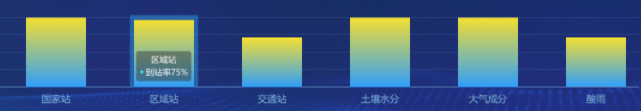
echart柱状图
渐变色柱子
通过series中 itemStyle color offset控制 可以有多个
series: [
          {

            name: '到站率',
            type: 'bar',
            barWidth: '60%',
            data: [100, 100, 70, 100, 100, 100],
            itemStyle: {

              normal: {

                color: new echarts.graphic.LinearGradient(0, 0, 0, 1, [{

                  offset: 0,
                  color: '#F5DF31'
                }, {

                  offset: 1,
                  color: '#2F9EFA'
                }]),
              }
            }
          }
        ]
一个柱子两个颜色
通过stack进行数据堆叠 相同数据会堆叠在一起
series: [
          {

            name: '到报率',
            type: 'bar',
            barWidth: '60%',
            stack: '数据',
            data: [100, 100
最低0.47元/天 解锁文章


 2750
2750


 被折叠的 条评论
为什么被折叠?
被折叠的 条评论
为什么被折叠?
 到【灌水乐园】发言


