


更多精彩内容请关注微信公众号:GEEer成长日记
上期我们介绍了Modis_LST产品MODIS/006/MOD11A1的时间序列,因为这款产品是官方已经经过各种矫正和处理的产品,精度较高,且范围广,排除了云雨条件等影响。
今天我们介绍Landsat_SR影像在LST计算方面的研究~
LANDSAT/LC08/C01/T1_SR
先看看官方介绍:This dataset is the atmospherically corrected surface reflectance from the Landsat 8 OLI/TIRS sensors. These images contain 5 visible and near-infrared (VNIR) bands and 2 short-wave infrared (SWIR) bands processed to orthorectified surface reflectance, and two thermal infrared (TIR) bands processed to orthorectified brightness temperature
These data have been atmospherically corrected using LaSRC and includes a cloud, shadow, water and snow mask produced using CFMASK, as well as a per-pixel saturation mask.
Strips of collected data are packaged into overlapping "scenes" covering approximately 170km x 183km using a standardized reference grid.
See also the USGS page on SR QA bands.
SR can only be produced for Landsat assets processed to the L1TP level
Data provider notes:
-
Although Surface Reflectance can be processed only from the Operational Land Imager (OLI) bands, SR requires combined OLI/Thermal Infrared Sensor (TIRS) product (LC8) input in order to generate the accompanying cloud mask. Therefore, OLI only (LO8), and TIRS only (LT8) data products cannot be calculated to SR.
-
SR is not run for a scene with a solar zenith angle greater than 76°.
-
Users are cautioned to avoid using SR for data acquired over high latitudes (> 65°).
-
The panchromatic band (ETM+ Band 7, OLI Band 8) is not processed to Surface Reflectance.
-
Efficacy of SR correction will be likely reduced in areas where atmospheric correction is affected by adverse conditions:
-
Hyper-arid or snow-covered regions
-
Low sun angle conditions
-
Coastal regions where land area is small relative to adjacent water
-
Areas with extensive cloud contamination
-
更多关于地表反射率产品的介绍请参考
https://www.usgs.gov/landsat-missions/landsat-collection-1-surface-reflectance
分辨率:30m
我们介绍两种计算时间序列的方法,一种是计算得到FeatureCollection,将Value值的时间序列进行展示。另一种是将时间序列的影像进行月平均,通过月平均影像的统计构建时间序列图表。
首先第一种,构建FeatureCollection从而得到时间序列。
//还是老样子哈,以广东省为目标
var geometry = ee.FeatureCollection('users/ZhengkunWang/guangdongsheng')
Map.centerObject(geometry,7)
// Define Star year and end year
var startYr = 2020;
var endYr = 2020;

// year sequence
var startDate = ee.Date.fromYMD(startYr,01,01);
var endDate = ee.Date.fromYMD(endYr+1,01,01);
//**NOTE: the end date in .filterDate() is exclusive, so this allows all days in 2019 to be included

// Define the mskL8sr funciton for masking clouds, etc.
function maskL8sr(image) {
  /// Bits 3 and 5 are cloud shadow and cloud, respectively.
  var cloudShadowBitMask = (1 << 3);
  var cloudsBitMask = (1 << 5);
  // Get the pixel QA band.
  var qa = image.select('pixel_qa');
  // Both flags should be set to zero, indicating clear conditions.
  var mask = qa.bitwiseAnd(cloudShadowBitMask).eq(0)
                 .and(qa.bitwiseAnd(cloudsBitMask).eq(0));
  return image.updateMask(mask);
}


// Load the collection
var l8 = ee.ImageCollection("LANDSAT/LC08/C01/T1_SR");
// Filter the dates
var l8lst = l8.filterDate(startDate, endDate)
              .filterBounds(geometry)
               // To mask clouds and shadows from this collection
               .map(maskL8sr);


//** Visualization parameters
var vizParams = {
  bands: ['B6', 'B5', 'B4'],
  min: 0,
  max: 3200,
  gamma: 1.4,
};
Map.addLayer(l8lst.mean().clip(geometry),vizParams,'l8 imagery');
//--------------------------------------

//Projection of Landsat imagery,
//it shows an error if bands of the image don't have all the same
var l8proj = ee.Image(l8lst.first()).projection();
// print('l8proj:', l8proj);


//** Calculate number of months withiin the specified time period
var dateDiff = endDate.difference(startDate,'month');
var noMonths = ee.Number(dateDiff).round().subtract(1);

//** Create list of dates, one for each month in the time period
var allMonths = ee.List.sequence(0,noMonths,1);
var dateList = allMonths.map(function(monthNo){
  return startDate.advance(monthNo,'month');
});
// print(dateList);

//** FUNCTION: for calculating monthly LST values
var calcMonthlyLST = function(date){

  //** Filter collection by month
  var start = ee.Date(date);
  var end = start.advance(1,'month');
  var collection = l8lst.filterDate(start,end);

  //** Create median composite for that month
  var monthMed = collection.median();

  //** Create NDVI and Thermal Band images from composite
  var ndvi = monthMed.normalizedDifference(['B5','B4']);
  var thermalImg = monthMed.select('B10').multiply(0.1);

  //*8 Calculate min and max NDVI
  var minNDVI = ee.Number(ndvi.reduceRegion({
  reducer: ee.Reducer.min(),
  geometry: geometry,
  scale: 30,
  maxPixels: 1e13
  }).values().get(0));

  var maxNDVI = ee.Number(ndvi.reduceRegion({
  reducer: ee.Reducer.max(),
  geometry: geometry,
  scale: 30,
  maxPixels: 1e13
  }).values().get(0));

  //** Fraction of vegetation (use 'if' statement so that where entire image is masked and
  //    minNDVI and maxNDVI are null, produce a null image)
  var fv = ee.Algorithms.If({
    condition: minNDVI && maxNDVI,
    trueCase: ndvi.subtract(minNDVI).divide(maxNDVI.subtract(minNDVI)).rename('FV'),
    falseCase: ee.Image()
  });
  //** Recast to ee.Image object
  fv = ee.Image(fv);

  //** Emissivity (again use 'if' statement for cases of null inputs)
  var a = ee.Number(0.004);
  var b = ee.Number(0.986);
  var EM = ee.Algorithms.If({
    condition: fv.bandNames(),
    trueCase: fv.multiply(a).add(b).rename('EMM'),
    falseCase: ee.Image()
  });
  //** Recast to ee.Image object
  EM = ee.Image(EM);

  //** Land surface temperature (again use 'if' statement for cases of null inputs)
  var LST = ee.Algorithms.If({
    condition: EM.bandNames(),
    trueCase: thermalImg.expression(
    '(Tb/(1 + (0.0010895* (Tb / 1.438))*log(Ep)))-273.15', {
      'Tb': thermalImg.select('B10'),
      'Ep': EM.select('EMM')
    }).rename('LST'),
    falseCase: ee.Image().rename('LST')
  });

  //**  Use reduceRegion() to extract per-region value for this month
  var meanVal = ee.Image(LST).reduceRegion({
    reducer: ee.Reducer.mean(),
    geometry: geometry,
    scale: 30,
  maxPixels: 1e13,
    crs: l8proj
  });

  //** Create feature with desired data/properties and empty geometry, for charting by feature
  var ft = ee.Feature(null, {
    'system:time_start': date,
    'date': date.format('YYYY-MM-dd'),
    'value': meanVal.get('LST')
  });
  return ft;
};

//** Create feature collection, one for each month, wherein a property 'status' is
//    added to indicate whether there is an empty collection for that month
var dateFeats = dateList.map(function(date){
  var thisColl = l8lst.filterDate(ee.Date(date), ee.Date(date).advance(1,'month'));
  return ee.Algorithms.If({
    condition: thisColl.first(),
    trueCase: ee.Feature(null, {'date':date, 'status':1}),
    falseCase: ee.Feature(null, {'date':date, 'status':0})
  });
});
dateFeats = ee.FeatureCollection(dateFeats);
// print('dateFeats:', dateFeats);

//** Map over date features and create per-month/year mean LST composites
var perYrMonthlyLST = dateFeats.map(function(feature){
  var startDate = ee.Date(feature.get('date'));

  //** If month represented by this feature has imagery for it,
  //    calculate per-monnth LST; otherwise set LST to 0 (can't be 'null' for charting)
  var outFeat = ee.Algorithms.If({
    condition: ee.Number(feature.get('status')).eq(1),
    trueCase: ee.Feature(calcMonthlyLST(startDate)),
    falseCase: ee.Feature(null, {
      'system:time_start': startDate.millis(),
      'date': startDate,
      'value': 0
    })
  });
  return outFeat;
});
perYrMonthlyLST = ee.FeatureCollection(perYrMonthlyLST);
print('perYrMonthlyLST',perYrMonthlyLST);

//** Create new graph for monthly temperatures over multiple years
var multiYrGraph = ui.Chart.feature.byFeature({
  features:perYrMonthlyLST,
  xProperty:'system:time_start',
  yProperties: 'value'});

//** Print graph to console
print(multiYrGraph.setChartType("ColumnChart")
          .setOptions({vAxis: {title: 'LST [deg. C]'},
                        hAxis: {title: 'Date'}}));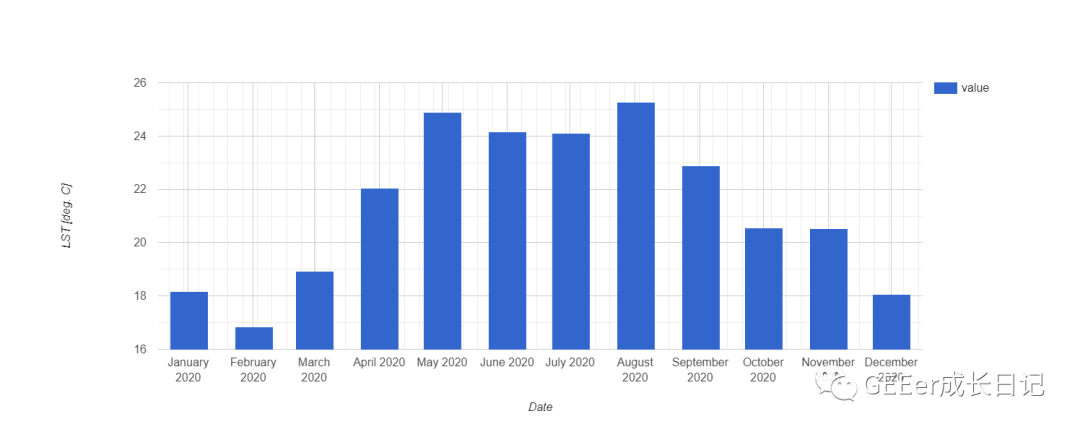
计算地表温度的方法步骤:
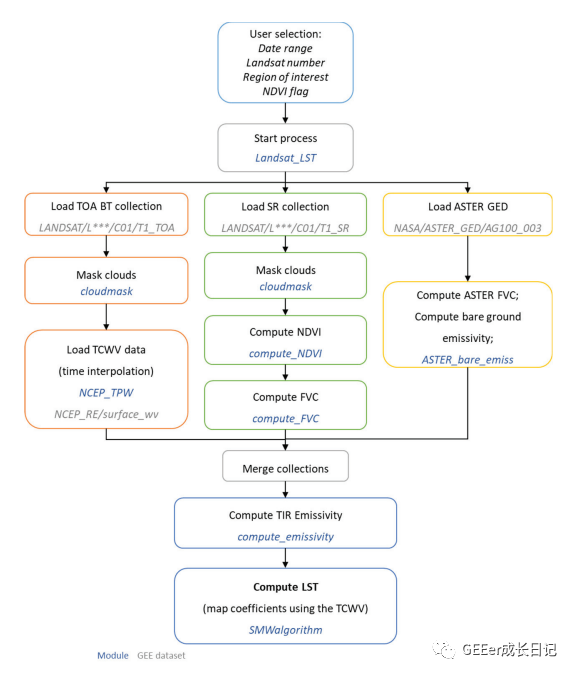
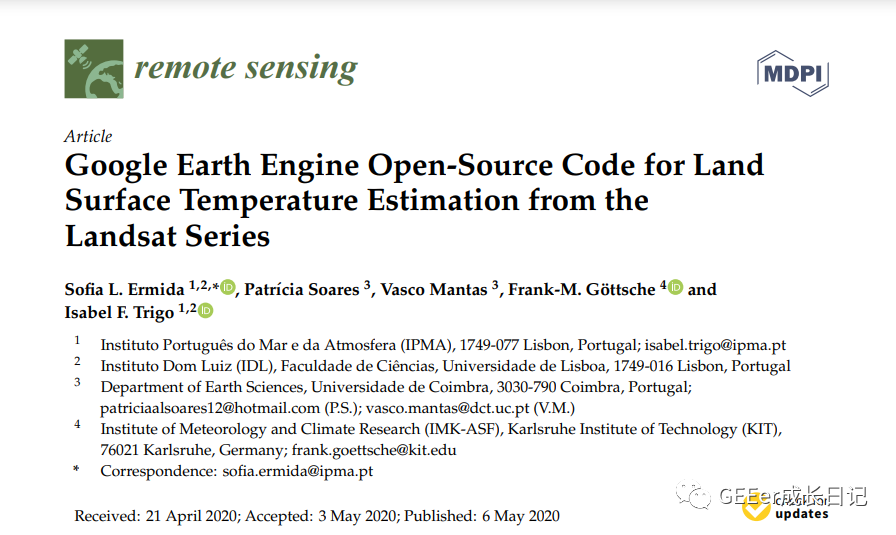
这篇文章对此介绍的很详细,大家可以去好好研读。
第二种则是通过生成月均值影像,通过统计的方法计算得到地表温度时间序列。我们计算了2016-2020五年的月均值进行分析。
// 具体计算LST的流程和上述步骤一样,就不过多介绍了
// 这边主要介绍一下月均值影像的生成和时间序列的计算
var years = ee.List.sequence(2016, 2020);
var months = ee.List.sequence(1, 12);
var monthlyLST =  ee.ImageCollection.fromImages(
  years.map(function (y) {
    return months.map(function(m) {
    return LST.filter(ee.Filter.calendarRange(y,y, 'year')).filter(ee.Filter.calendarRange(m, m, 'month')).mean().set('year', y).set('month', m).set('system:time_start', ee.Date.fromYMD(y, m, 1))
    .set('system:index',y+m);
    });
  }).flatten()
);
print(monthlyLST)
var monthlychart = ui.Chart.image.series(monthlyLST.select('LST'), geometry,ee.Reducer.mean(),500)
              .setChartType('LineChart').setOptions({
                interpolateNulls: true,
                title: 'LST monthly time series',
                hAxis: {title: 'Date'},
                vAxis: {title: 'LST',viewWindowMode: 'explicit', gridlines: {count: 10,}},
                trendlines: { 0: {title: 'LST_trend',type:'linear', showR2: true,  color:'red', visibleInLegend: true}}});
// Display.
print(monthlychart);
Map.addLayer(monthlyLST.select('LST'),{min: -30, max: 32, palette: ['white','blue','green','yellow' ,'red']},'LST_Monthly');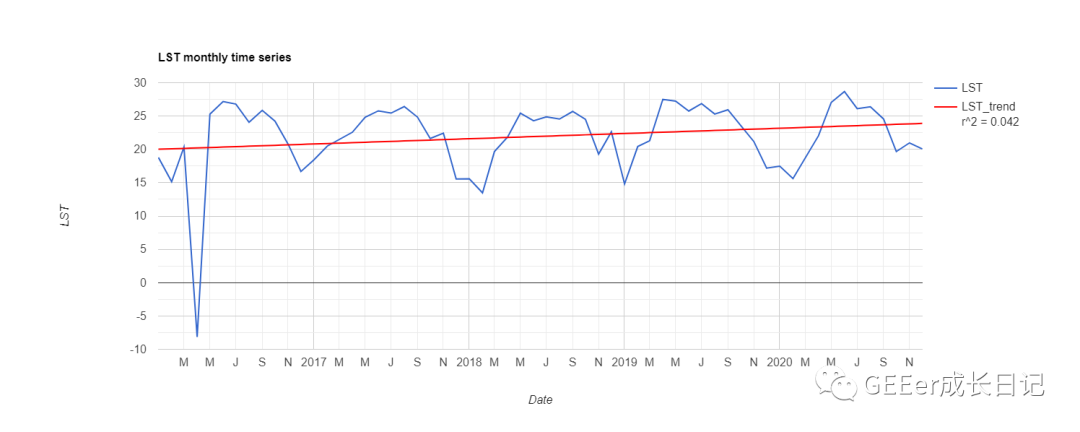
本期我们介绍了两种地表温度的时间序列。第一种方法适用于只得到图表,不下载影像,而第二种方法则可以加入下载影像的代码,边生成时间序列边下载影像分析。
获取第一种方法的代码请在公众号回复:010401 ;
获取第二种方法的代码请在公众号回复:010402。
如果真的可以帮到你,记得给小编点个赞哦~
参考博客:
官方论坛资深用户Jen Hird


 被折叠的 条评论
为什么被折叠?
被折叠的 条评论
为什么被折叠?
 到【灌水乐园】发言


