


一、查看服务器资源使用情况
top #查看服务器资源使用情况二、获取Mysql资源使用情况
ps -ef | grep -i mysql //获取mysql进程
top -p 3129 -H // 获取sql的线程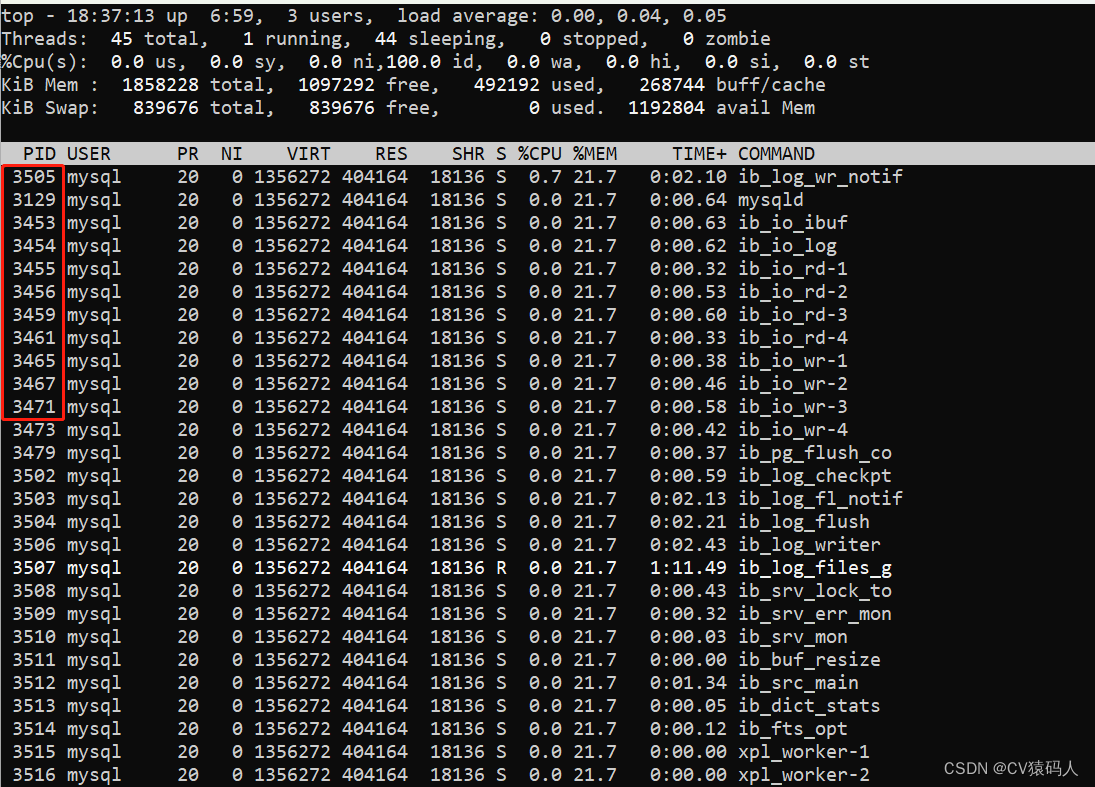
将这些Mysql的io进程id保存一下,后续会用到。
三、查看异常SQL
select sql_text from performance_schema.events_statements_current where thread_id = (select
thread_id from performance_schema.threads where thread_os_id = 3505 ) \G
thread_os_id = 获取到的io进程。会获取到异常的SQL。
*************************** 1. row ***************************
sql_text: select * from (SELECT
 sum( a2.THIS_PERIOD_VALUE ) 总收入,
 sum(a3.CLOSING_VALUE),
 sum(a3.OPENING_VALUE)
FROM
 IPSCOMFSREPORT a1
 LEFT JOIN IPSCOMFSREPORTPL2022 a2 ON a1.id = a2.fs_report_id
 LEFT JOIN (
 SELECT
  a1.id,
  a2.CLOSING_VALUE,
  a2.OPENING_VALUE
 FROM
  IPSCOMFSREPORT a1
 LEFT JOIN IPSCOMFSREPORTBS2022 a2 ON a1.id = a2.fs_report_id
 ) a3 ON a1.id = a3.id)T  limit 0,200
1 row in set (0.00 sec)
分析SQL的是否合理,或用explain来做结构分析。
四、kill掉异常的SQL进程
select name ,PROCESSLIST_ID from performance_schema.threads
    where thread_os_id = 3505;
正常的话上面的sql会将此条io线程所执行的进程查询出来。

kill 66089; # kill PROCESSLIST_ID


 1217
1217


 被折叠的 条评论
为什么被折叠?
被折叠的 条评论
为什么被折叠?
 到【灌水乐园】发言


