


(一)QCustomPlot常见属性设置、多曲线绘制、动态曲线绘制、生成游标、矩形放大等功能实现-CSDN博客
关键代码:
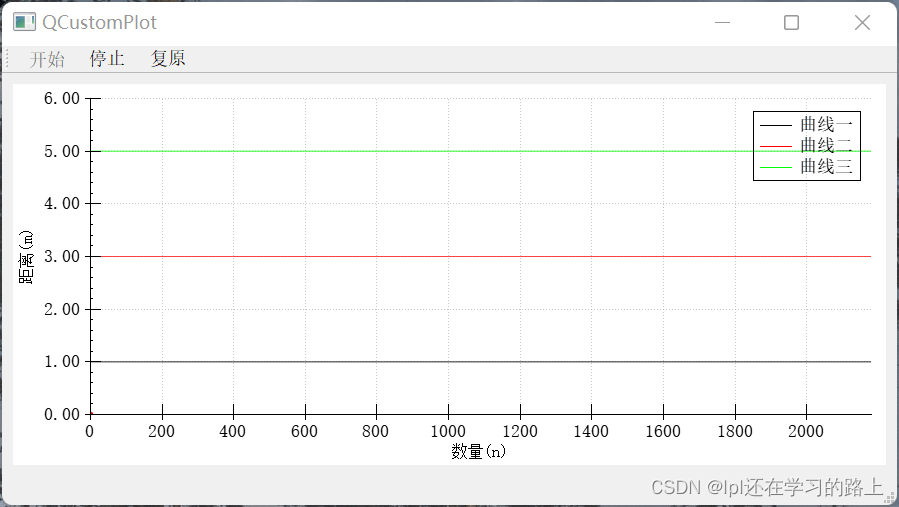
QT += core gui printsupport使用上面文章中的代码跑起来的程序效果图:
我的学习过程:
最开始初始化后:QCustomPlot对象显示图:

1.x轴名称和刻度值
m_Multichannel->xAxis->setLabel("x轴"); m_Multichannel->xAxis->setNumberFormat("f"); //x轴刻度值格式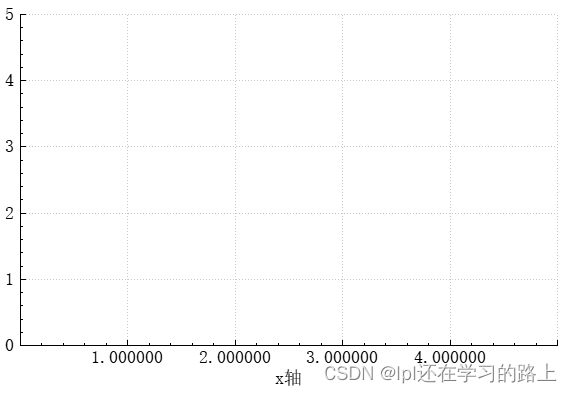
2. 刻度值精度
m_Multichannel->xAxis->setNumberPrecision(3); //刻度值精度 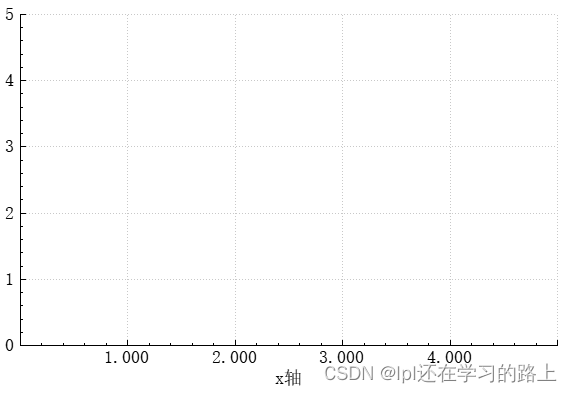
3. x轴标签的字体
m_Multichannel->xAxis->setLabelFont(QFont(font().family(),20)); //设置标签字体大小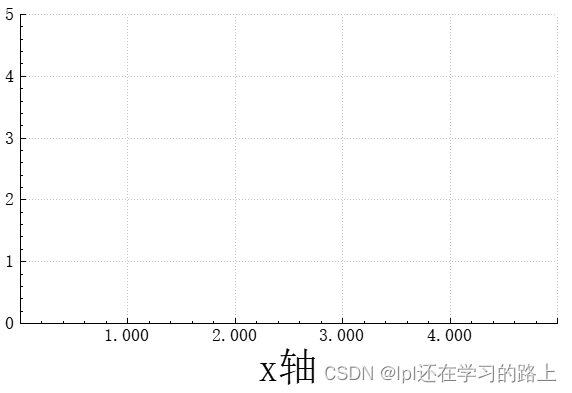
4. x轴刻度数量和刻度范围
m_Multichannel->xAxis->ticker()->setTickCount(11); //刻度数量m_Multichannel->xAxis->setRange(0,10,Qt::AlignLeft); //范围
0---9
其实一共11个刻度
0,1,2,3,4
5,6,7,8,9
10 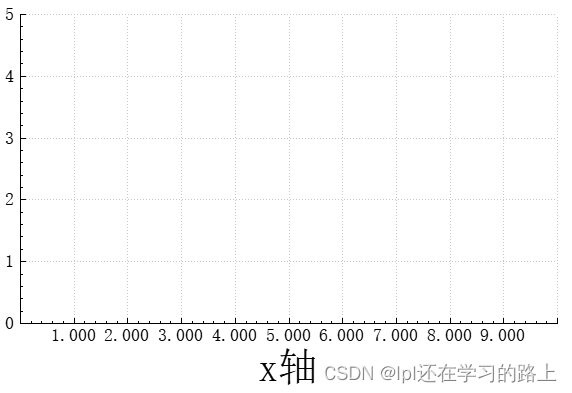
5. x轴刻度范围
m_Multichannel->xAxis->setRange(0,20,Qt::AlignLeft);              //范围
0---20
11个刻度
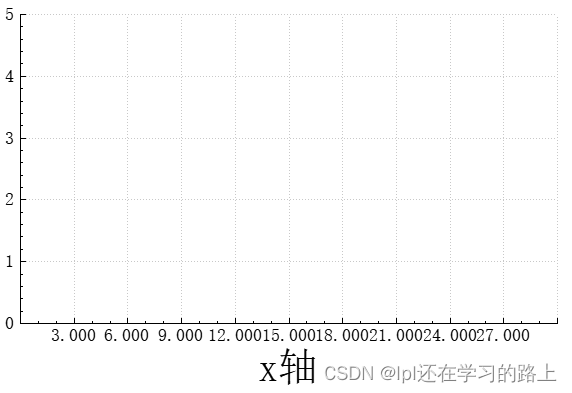
6. x轴刻度范围
m_Multichannel->xAxis->setRange(0,30,Qt::AlignLeft);0---30
11个刻度
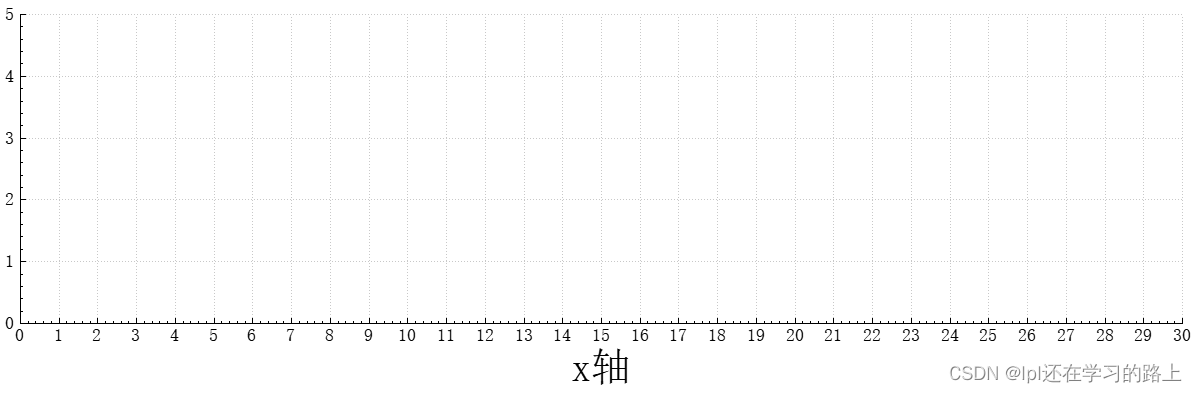
7. x轴属性集合
    m_Multichannel->xAxis->ticker()->setTickCount(21);                //刻度数量
    m_Multichannel->xAxis->setNumberFormat("f");                      //x轴刻度值格式
    m_Multichannel->xAxis->setNumberPrecision(0);                     //刻度值精度
    m_Multichannel->xAxis->setRange(0,30,Qt::AlignLeft);              //范围
    0---30
    21个刻度
不知道为什么,显示出来是这样:
8. x轴子刻度长度
m_Multichannel->xAxis->setSubTickLength(0,0); //子刻度长度 setSubTickLength(int inside, int outside)
Sets the length of the subticks in pixels. \a inside is the length the subticks will reach inside
the plot and \a outside is the length they will reach outside the plot. If \a outside is greater
than zero, the tick labels and axis label will increase their distance to the axis accordingly,
so they won't collide with the ticks.以像素为单位设置子刻度的长度。
inside是子刻度将到达的图表内的长度
outside是它们到达plot外的长度。如果outside>0,刻度label和轴label将相应地增加到轴的距离,
这样它们就不会和ticks相撞。plot:图表
9. x轴子刻度长度
m_Multichannel->xAxis->setSubTickLength(5,0); //子刻度长度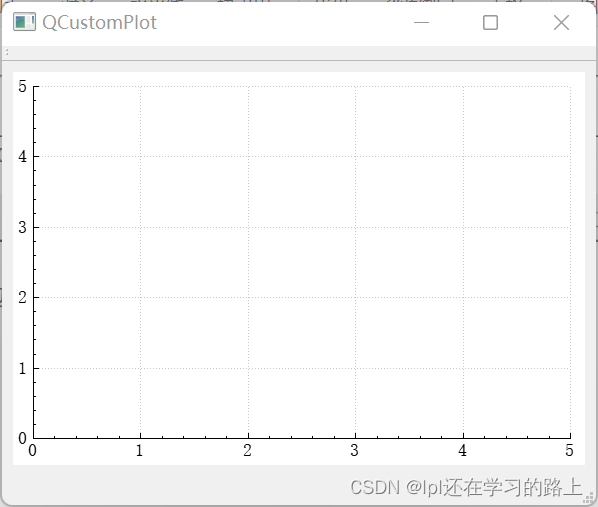
10. x轴子刻度长度
m_Multichannel->xAxis->setSubTickLength(20,0); //子刻度长度
11. x轴子刻度长度
m_Multichannel->xAxis->setSubTickLength(0,20); //子刻度长度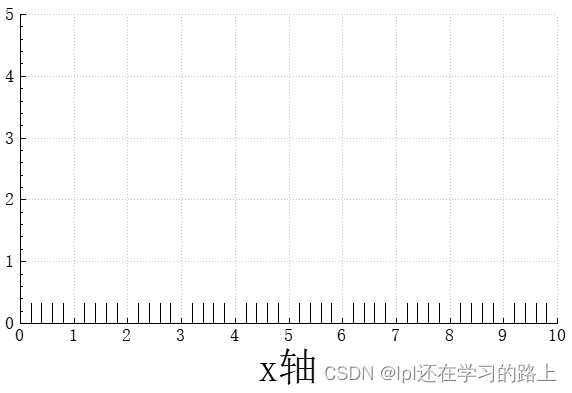
12. x轴子刻度长度
m_Multichannel->xAxis->setSubTickLength(10,10); //子刻度长度
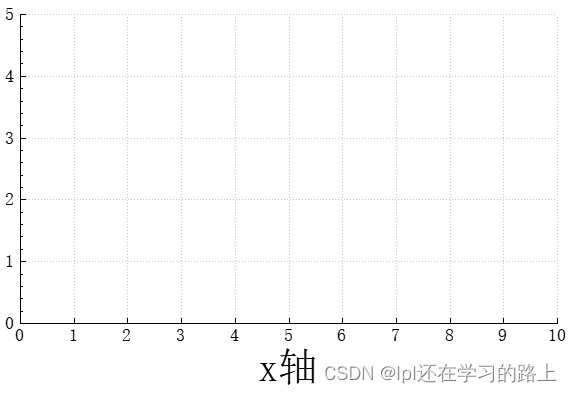
13. x轴和y轴
    m_Multichannel=ui->widget;

    QSharedPointer<QCPAxisTickerFixed> intTicker_M(new QCPAxisTickerFixed);
    intTicker_M->setTickStep(1);
    intTicker_M->setScaleStrategy(QCPAxisTickerFixed::ssMultiples);

    m_Multichannel->xAxis->setTicker(intTicker_M);
    m_Multichannel->xAxis->setLabel("x轴");
    m_Multichannel->xAxis->ticker()->setTickCount(11);                //刻度数量
    m_Multichannel->xAxis->setNumberFormat("f");                      //x轴刻度值格式
    m_Multichannel->xAxis->setNumberPrecision(0);                     //刻度值精度
    m_Multichannel->xAxis->setLabelFont(QFont(font().family(),20));    //设置标签字体大小
    m_Multichannel->xAxis->setRange(0,10,Qt::AlignLeft);              //范围
    m_Multichannel->xAxis->setSubTickLength(0,0);                     //子刻度长度


    m_Multichannel->yAxis->setNumberFormat("f");
    m_Multichannel->yAxis->setNumberPrecision(2);
    m_Multichannel->yAxis->setLabel("y轴");
    m_Multichannel->yAxis->setLabelFont(QFont(font().family(),10));
    m_Multichannel->yAxis->setRange(0,5);
    m_Multichannel->yAxis->setTickLength(10,5);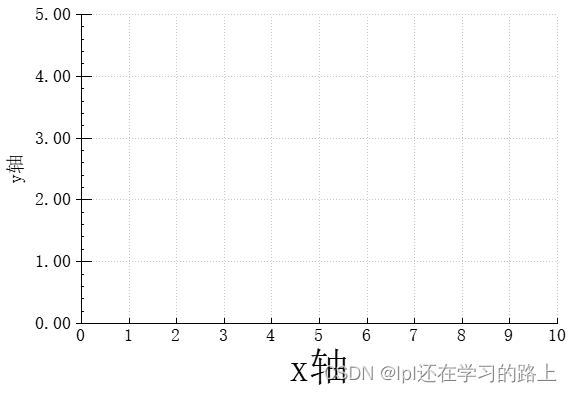
14. 背景
ui->plotWidget->setBackground(QBrush(QColor("#404040")));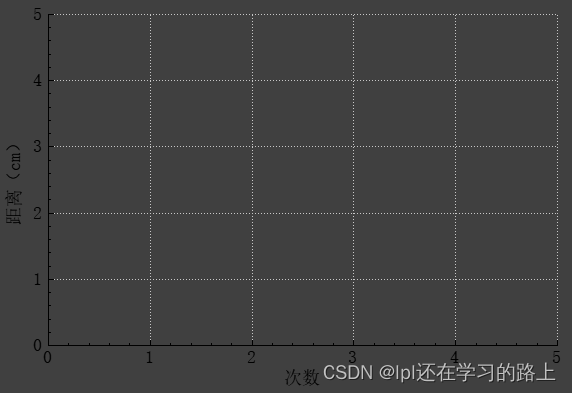
15. 坐标轴标签颜色
       ui->plotWidget->xAxis->setLabelColor(QColor(Qt::red));
       ui->plotWidget->yAxis->setLabelColor(QColor(Qt::red));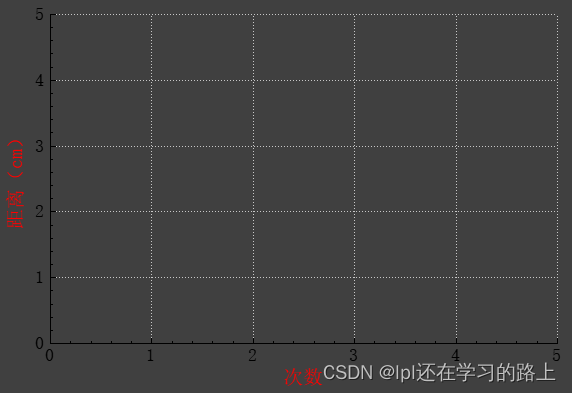
16. 坐标轴数字标签颜色
       ui->plotWidget->xAxis->setTickLabelColor(QColor(Qt::green));
       ui->plotWidget->yAxis->setTickLabelColor(QColor(Qt::green));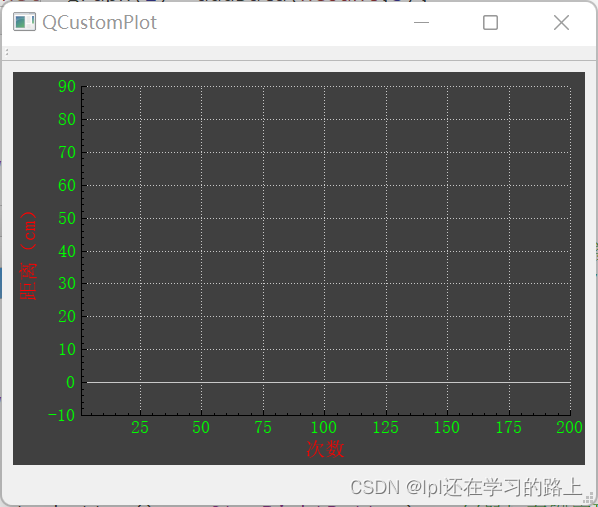
17. 坐标轴基线颜色
       ui->plotWidget->xAxis->setBasePen(QPen(QColor(Qt::yellow), 2, Qt::SolidLine));
       ui->plotWidget->yAxis->setBasePen(QPen(QColor(Qt::yellow), 2, Qt::SolidLine));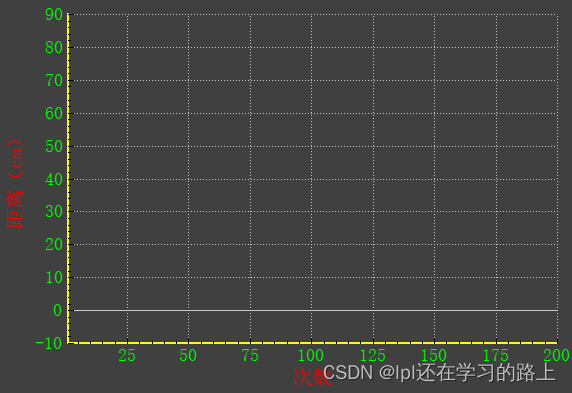
18. 坐标轴tick颜色
       ui->plotWidget->xAxis->setTickPen(QPen(QColor("#ff00ff")));
       ui->plotWidget->yAxis->setTickPen(QPen(QColor("#ff00ff")));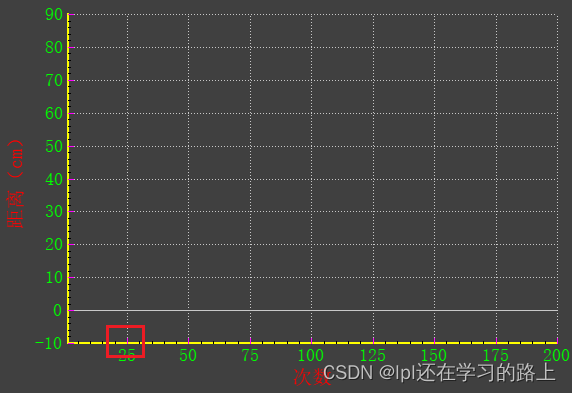
19. 坐标轴subtick颜色
       ui->plotWidget->xAxis->setSubTickPen(QPen(QColor("#00ffff")));
       ui->plotWidget->yAxis->setSubTickPen(QPen(QColor("#00ffff")));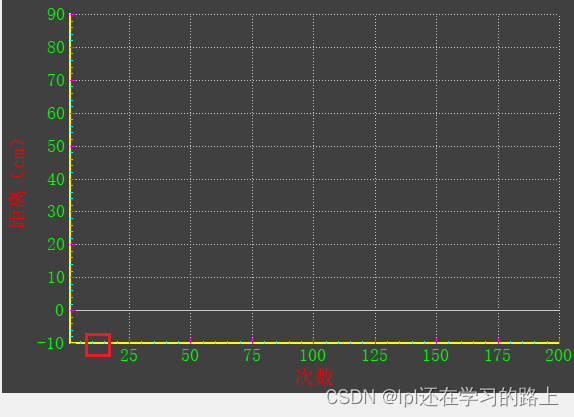
20. grid()颜色
       ui->plotWidget->xAxis->grid()->setPen(QPen(QColor(Qt::darkRed), 1, Qt::DotLine));
       ui->plotWidget->yAxis->grid()->setPen(QPen(QColor(Qt::darkGreen), 1, Qt::DotLine));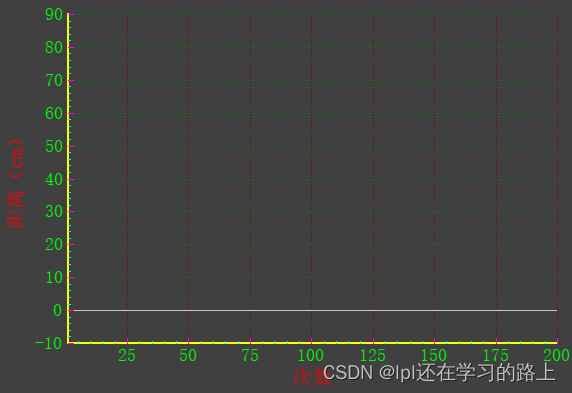
21. 示例1
       #define PT_CNT       200    // 点数
       QVector<double> keys, values;
       for (int i = 1; i <= PT_CNT; i++)
       {
           keys.push_back(i);
           values.push_back(rand() % 100 - 10);
       }
       ui->plotWidget->addGraph();
       ui->plotWidget->graph(0)->addData(keys, values);
       ui->plotWidget->graph(0)->setPen(QColor(Qt::blue));
       ui->plotWidget->graph(0)->setAntialiasedFill(true);
       ui->plotWidget->replot();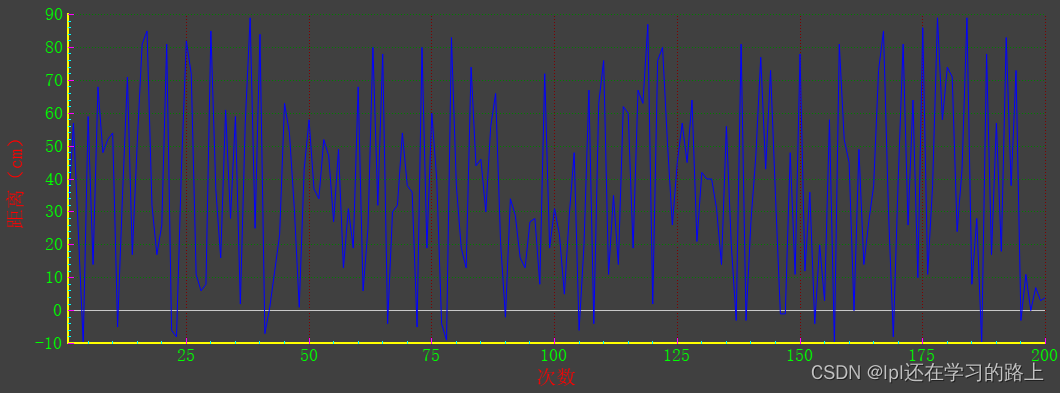
22. 刷新图层
    ui->plotWidget->graph(0)->data()->clear();
    ui->plotWidget->replot();
重新添加数据:
    QVector<double> keys, values;
    for (int i = 1; i <= PT_CNT; i++)
    {
        keys.push_back(i);
        values.push_back(rand() % 100 - 10);
    }
    ui->plotWidget->graph(0)->addData(keys, values);
    ui->plotWidget->graph(0)->setPen(QColor(Qt::blue));
    ui->plotWidget->graph(0)->setAntialiasedFill(true);
    ui->plotWidget->replot();
23. 拖拽+缩放
ui->plotWidget->setInteractions(QCP::iRangeDrag | QCP::iRangeZoom);
24. qcustomplot的帮助文档
我希望在QtCreator中使用qcustomplot的帮助文档,可以参考下面的文章。
QCustomPlot使用手册(一)_qcustom手册-CSDN博客
【QCustomPlot】1.1 - Qt .qch帮助文档导入使用-CSDN博客
25.示例2
      //最开始初始化
       for (int i=0; i<101; ++i)
       {
         double m,m1;
         m= i/50.0 - 1;
         m1 = m*m;
         x<<m;
         x1<<m;
         y<<m1;
         y1<<-m1;
       }

       one=ui->plotWidget->addGraph();
       init_graph(0);

       two=ui->plotWidget->addGraph();

       ui->plotWidget->graph(1)->addData(x1, y1);
       ui->plotWidget->graph(1)->setPen(QColor(Qt::red));
       ui->plotWidget->graph(1)->setAntialiasedFill(true);
       ui->plotWidget->replot();
       init_graph(1);
//初始化图层
void MainWindow::init_graph(int current_index)
{
if(current_index==0){
ui->plotWidget->graph(current_index)->addData(x, y);
ui->plotWidget->graph(current_index)->setPen(QColor(Qt::blue));
}
else {
ui->plotWidget->graph(current_index)->addData(x1, y1);
ui->plotWidget->graph(current_index)->setPen(QColor(Qt::red));
}
ui->plotWidget->graph(current_index)->setAntialiasedFill(true);
ui->plotWidget->replot();
}
//清理图层
void MainWindow::on_pushButton_clicked()
{
int current_index=ui->spinBox->value();
ui->plotWidget->graph(current_index)->data()->clear();
ui->plotWidget->replot();
}
//添加数据
void MainWindow::on_pushButton_2_clicked()
{
int current_index=ui->spinBox->value();
init_graph(current_index);
}


 1168
1168


 被折叠的 条评论
为什么被折叠?
被折叠的 条评论
为什么被折叠?
 到【灌水乐园】发言


