


prometheus学习
启动node-exporter
docker run -d \
-p 9100:9100    -v "/proc:/host/proc:ro" \
-v "/sys:/host/sys:ro"    -v "/:/rootfs:ro"  prom/node-exporter
启动prometheus
添加yaml文件
mkdir /opt/prometheus
vi /opt/prometheus/prometheus.yml
global:
  scrape_interval: 60s
  evaluation_interval: 60s

scrape_configs:
  - job_name: prometheus
    static_configs:
      - targets: ['localhost:9090']
        labels:
          instance: prometheus

  - job_name: linux
    static_configs:
      - targets: ['localhost:9100']
        labels:
          instance: localhost
docker run -d -p 9090:9090  \
-v /opt/prometheus/prometheus.yml:/etc/prometheus/prometheus.yml \
prom/prometheus
promql基本语法
# 查看1天前的5小时的请求
prometheus_http_requests_total{}[5h] offset 1d
#聚合
sum(prometheus_http_requests_total{})
#通过标签过滤
{code="200"}
安装grafana
mkdir /opt/grafana-storage
chmod 777 /opt/grafana-storage
docker run -d \
-p 3000:3000 \
--name=grafana \
-v /opt/grafana-storage:/var/lib/grafana \
grafana/grafana

用户名密码默认均为admin
配置prom
添加data source
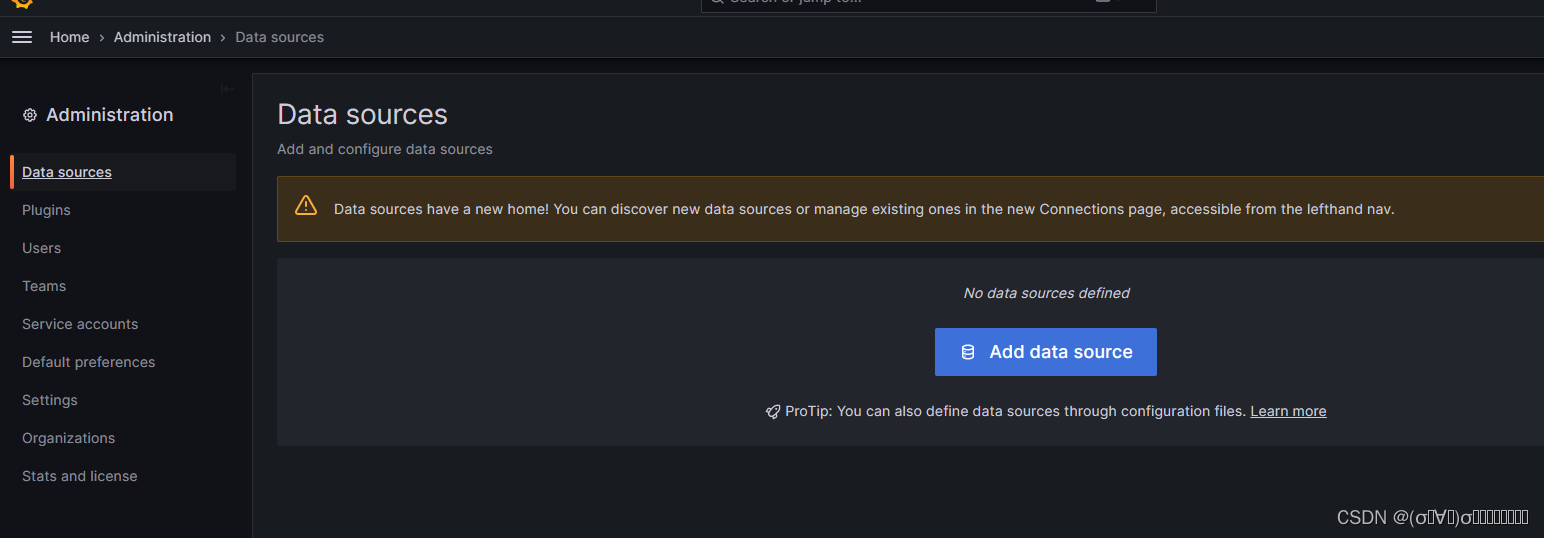
选择prometheus
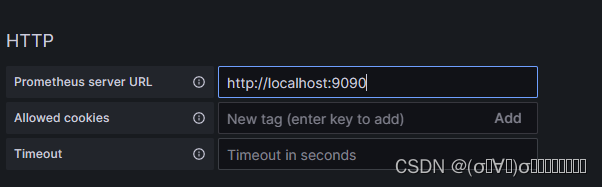
配置url
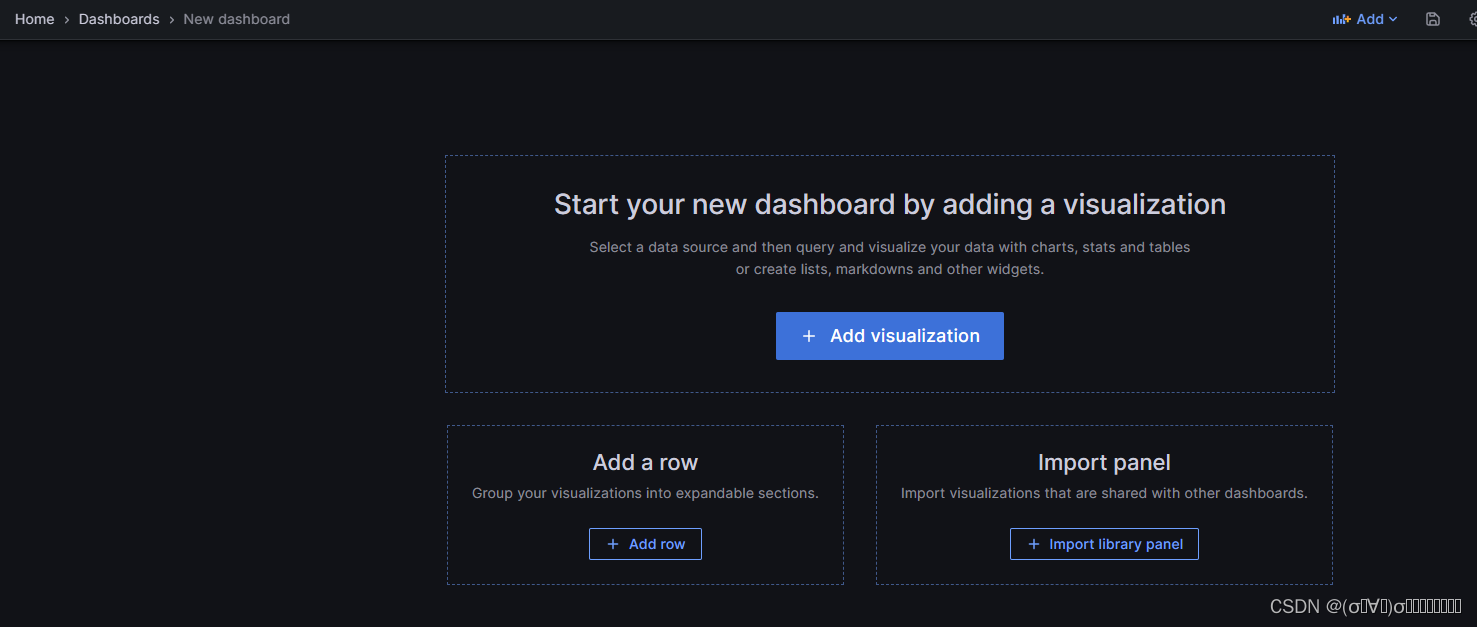
添加dashboard
metric中选择requests_total后点击run queries即可生成图表

点击右上角apply

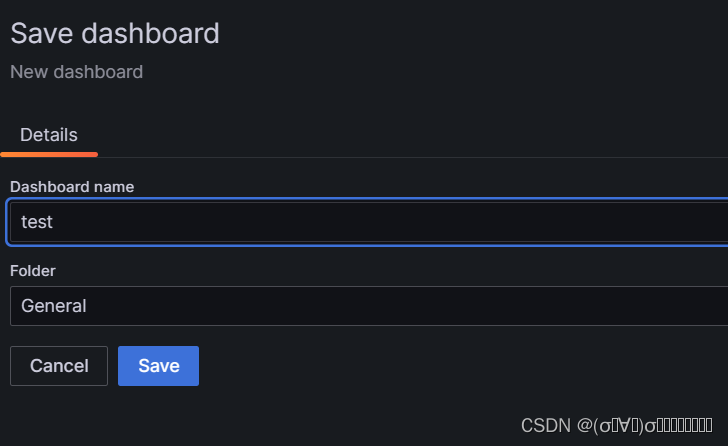
点击save dashboard图标
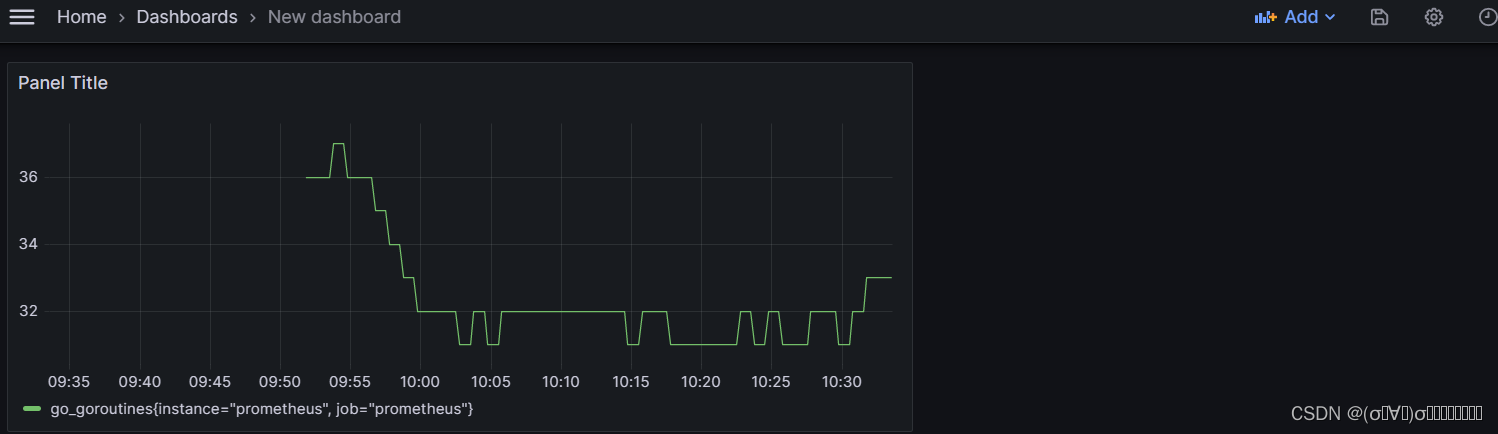
完成保存
打开新创建的dashboard,点击add下的row
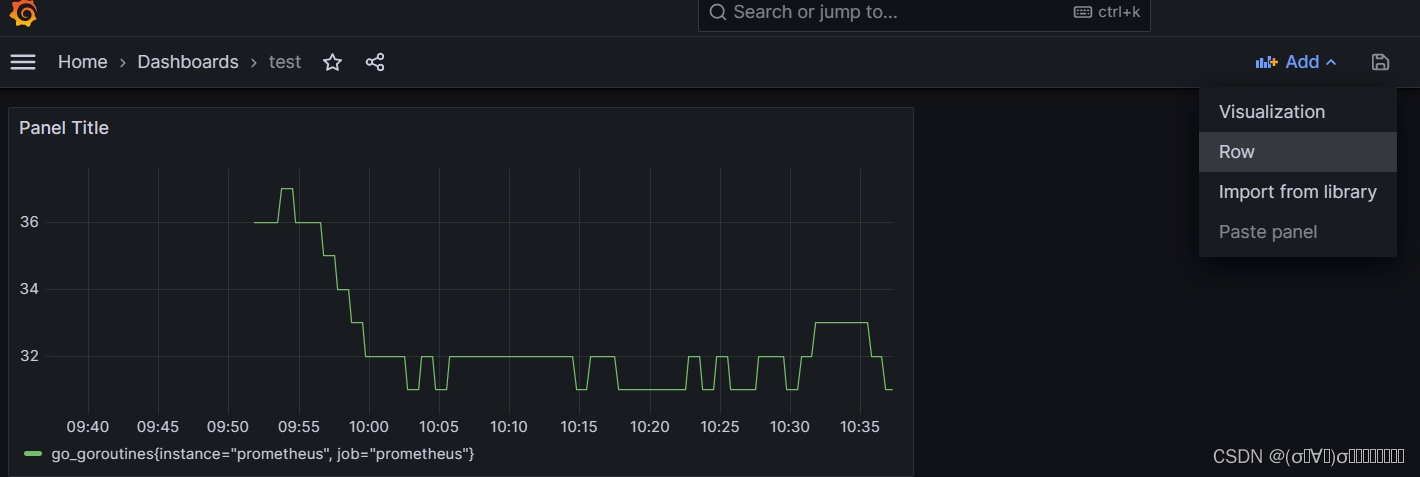
点击visual并选择metric后apply

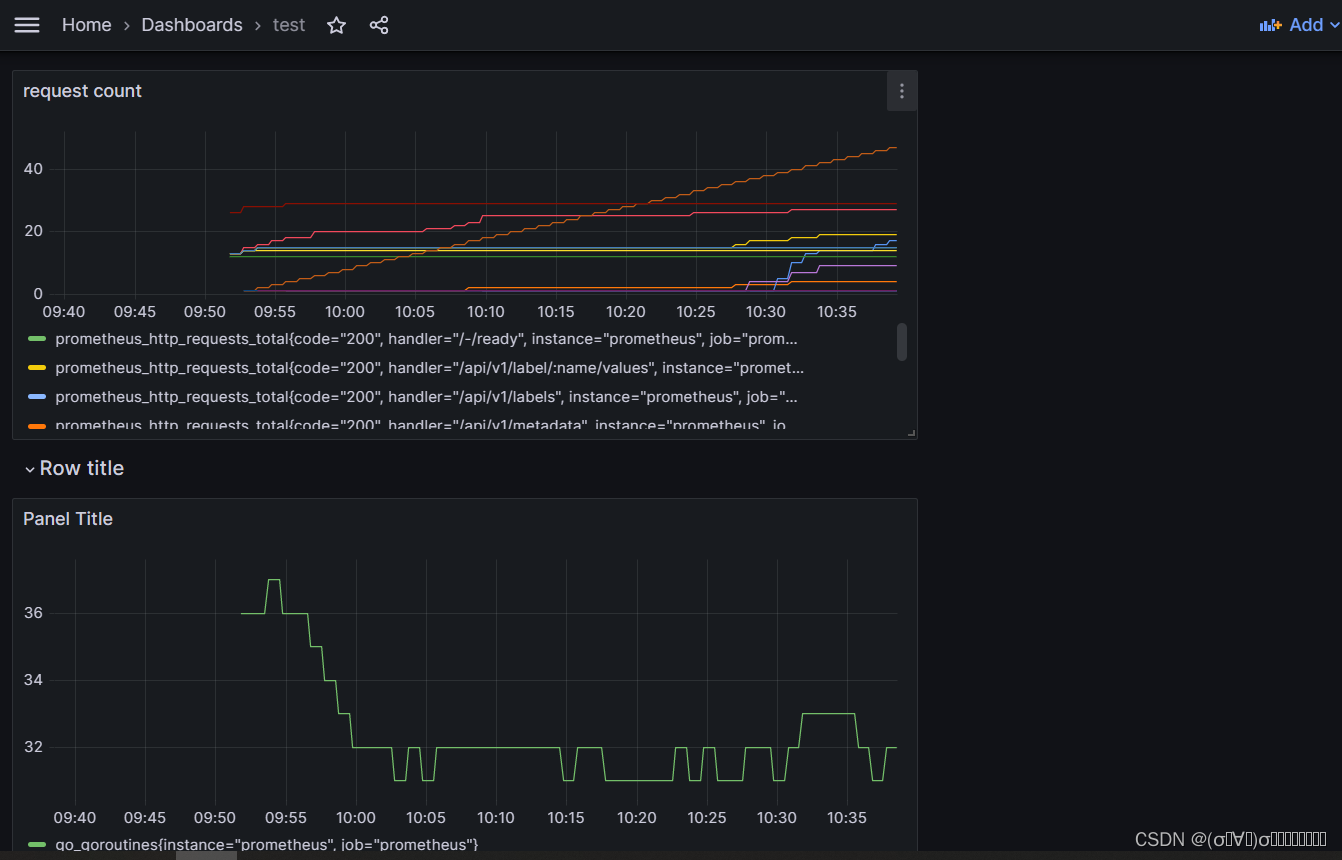
将上面dashboard调整位置并保存
导入grafana模板
grafana模板
搜索模板并下载json

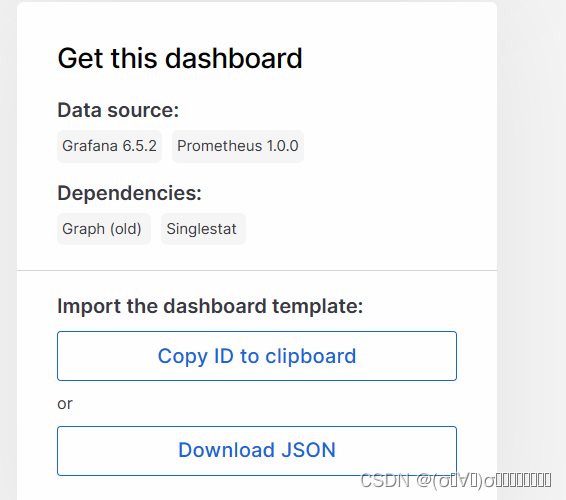
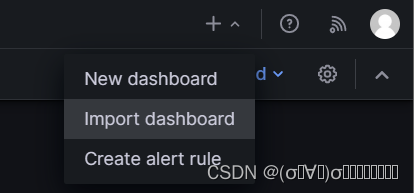
导入json,选择import dashboard
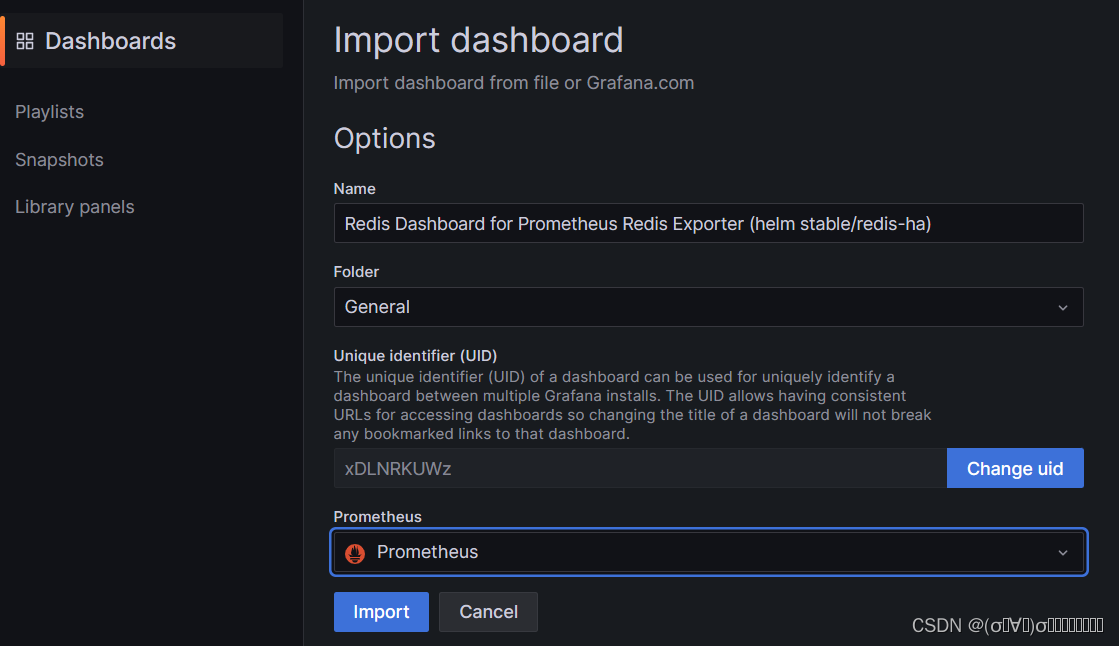
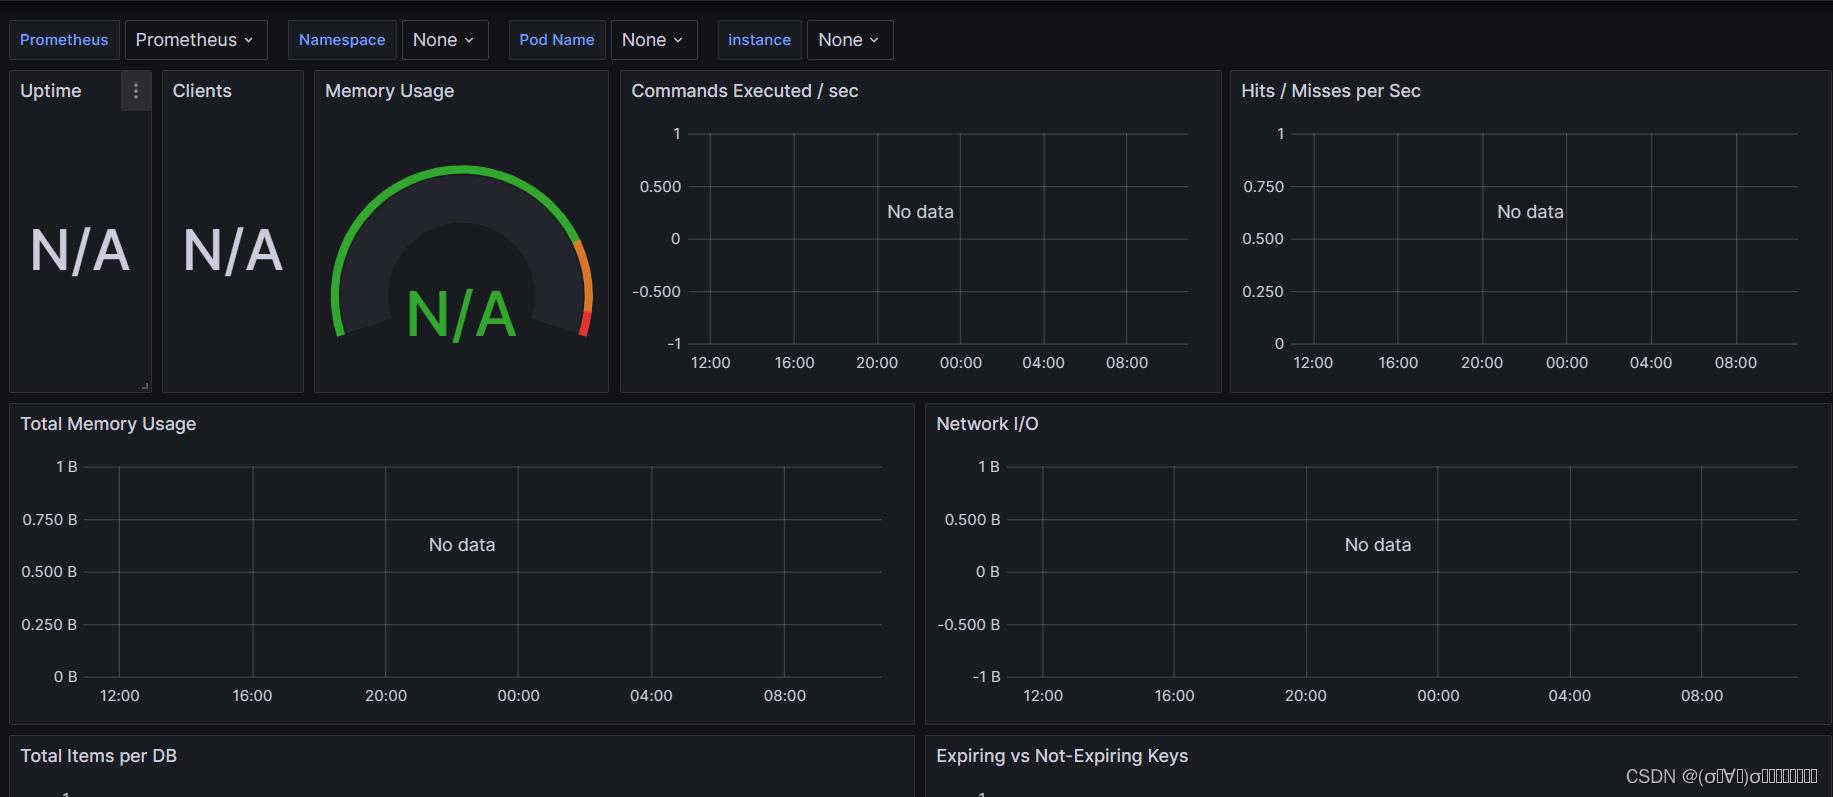
即可完成对redis监控的dashboard
遇到问题:Panel plugin not found: grafana-piechart-panel
wget  https://grafana.com/api/plugins/grafana-piechart-panel/versions/latest/download -O /opt/grafana-piechart-panel.zip
unzip /opt/grafana-piechart-panel.zip
mv grafana-piechart-panel grafana-storage/plugins/


 459
459


 被折叠的 条评论
为什么被折叠?
被折叠的 条评论
为什么被折叠?
 到【灌水乐园】发言


