


本节主要介绍Series和DataFrame的基本操作,包括:Series 和 DataFrame创建、属性、索引及切片、数据修改(增删数据)、数学运算、排序排名、统计分析。
目录
目录
一、 pd.Series
1.1 Series 创建
通过pd.Series创建Series:
>> data=np.arange(5)

>> index=list('ABCDE')

>> s1=pd.Series(data,index)

>> s1

[out]:A    0

      B    1

      C    2

      D    3

      E    4

      dtype: int32

>> s2=pd.Series({'A':0,'B':1,'C':2,'D':3,'E':4})   #输入数据如果为dictionary,则会将其key作为索引

>> s2
1.2 Series属性
* Series的index和values属性
>> s1.values

[out]:array([0, 1, 2, 3, 4])

>> s1.index

[out]:Index(['A', 'B', 'C', 'D', 'E'], dtype='object')
* Series 和 Series.Index的name属性
>> s1.name='test'

>> s1.index.name='sequence'

>> s1

[out]:sequence

          A    0

          B    1

          C    2

          D    3

          E    4

          Name: test, dtype: int32
1.3 Series的切片/索引
Series的切片、索引原理与ndarray相同。Series既可以通过位置序号索引,也可以通过Index索引。
>> s1[[0,2,3]]

[out]:sequence

            A    0

            C    2

            D    3

            Name: test, dtype: int32

>> s1[['A','C']]

[out]:sequence

            A    0

            C    2

            Name: test, dtype: int32
1.4 Series检查缺失值
* 检查index/value是否在Series中
>> 'A'in s1

[out]:True

>> 0 in s1.values

[out]:True

>> 0 in s1

[out]:False
* 检查缺失数据pd.isnull,pd.notnull
>> pd.isnull(s1)

[out]:sequence

        A    False

        B    False

        C    False

        D    False

        E    False

        Name: test, dtype: bool

 >> pd.notnull(s1)

 [out]:sequence

            A    True

            B    True

            C    True

            D    True

            E    True

            Name: test, dtype: bool
二、pd.DataFrame
2.1 DataFrame 创建
通过pd.DataFrame创建DataFrame,构造函数的有效数据输入有多种形式,最常见的几种包括:
* 通过ndarray构造DataFrame:
>>  df1=pd.DataFrame(np.arange(12).reshape(3,4),index=range(1,4),columns=list('ABCD'))

>> df1

[out]:  A B C D

1 0 1 2 3

2 4 5 6 7

3 8 9 10 11
* 通过数组、列表、元组构成的字典构造DataFrame:
>> data={'state':['A','B','C','D'],'year':[2000,2001,2002,2003],'population':[1,2,3,4]}

>> df2=pd.DataFrame(data,columns=['year','state','population'])

>> df2

[out]:year state population

0 2000 A 1

1 2001 B 2

2 2002 C 3

3 2003 D 4
* 通过字典构成的字典构造DataFrame:
>> pop={'A':{'2000':1,'2001':2,'2002':3,'2003':4},'B':{'2000':5,'2001':6,'2002':7,'2003':8}}

>> df3=pd.DataFrame(pop)

>> df3

[out]:  A B

2000 1 5

2001 2 6

2002 3 7

2003 4 8
* 通过Series构成的字典构造DataFrame
>> df4=pd.DataFrame({'A':df1['A'][:-1],'B':df1['B'][:-1]})

>> df4

[out]:  A B

1 0 1

2 4 5
2.2 DataFrame 属性
* DataFrame的index/columns 和 values 属性
>> df1.index

[out]:RangeIndex(start=1, stop=4, step=1)

>> df1.columns

[out]:Index(['A', 'B', 'C', 'D'], dtype='object')

>> df1.values

[out]:array([[ 0,  1,  2,  3],

       [ 4,  5,  6,  7],

       [ 8,  9, 10, 11]])
* DataFrame的index/columns的name属性
>> df1.index.name='Number'

>> df1.columns.name='Pupulation'

>> df1

[out]:Pupulation A B C D

Number

1             0 1 2 3

2             4 5 6 7

3             8 9 10 11
2.3 DataFrame 的索引对象
DataFrame 在进行df.index或df.columns操作时,会生成Index对象,该索引对象具有一些集合方法和属性,但允许数据重复。
>> type(df2.columns)

[out]:pandas.core.indexes.base.Index

>> df2.columns.append(pd.Index(['num1','num2']))

[out]:Index(['year', 'state', 'population', 'num1', 'num2'], dtype='object')
索引对象的常用方法和属性:
| 方法 | 描述 |
| append | 将额外的索引对象粘贴到原索引对象后,产生一个新索引 |
| difference | 计算两个索引的差集 |
| intersection | 计算两个索引的交集 |
| union | 计算两个索引的并集 |
| isin | 判断是否在索引中 |
| delete | 删除元素 |
| insert | 插入元素 |
| is_monotonic | 如果索引按序列递增,则返回True |
| is_unique | 如果序列值唯一,则返回True |
| unique | 计算索引的唯一序列 |
2.4 DataFrame 重建索引
pd.DataFrame.reindex(self, labels=None, index=None, columns=None, axis=None, method=None, copy=True, level=None, fill_value=nan, limit=None, tolerance=None)
| 参数 | 描述 |
| index/columns | 重建作为索引的序列 |
| method | 填充方式,pad / ffill,backfill / bfill |
| fill_value | 填充值 |
| limit | 连续填充数量 |
>> frame=pd.DataFrame(np.random.randint(1,18,(3,3)),index=['0','2','4'],columns=['A','B','D'])

>> frame

[out]:  A B D

0 2 6 13

2 5 6 17

4 7 14 8

>> frame.reindex(columns=['A','B','C','D'],method='ffill')

[out]:  A B C D

0 2 6 6 13

2 5 6 6 17

4 7 14 14 8
2.5 DataFrame 增删列/(行)
2.5.1 增加列
通过直接赋值增加列:
>> df2['num']=df2.population>1

>> df2

[out]:year state population num

0 2000 A 1 False

1 2001 B 2 True

2 2002 C 3 True

3 2003 D 4 True
2.5.2 DataFrame 连接
pd.DataFrame.join(self, other, on=None, how='left', lsuffix='', rsuffix='', sort=False)
Join columns with other DataFrame either on index or on a key column. Efficiently join multiple DataFrame objects by index at once by passing a list.
参数说明如下:
| 参数 | 说明 |
| other: DataFrame, Series, or list of DataFrame | 拟连接的数据 |
| on: str, list of str, or array-like, optional | 数据连接的方式为两种: 一种为通过index连接,默认; 一种通过on参数连接,需要指定键列 |
| how: {‘left’, ‘right’, ‘outer’, ‘inner’}, default ‘left’ | 数据连接的形式分为四种: * 左连接:用calling DataFrame 的索引或者键列 * 右连接:用other的索引或者键列 * 外连接:用calling DataFrame和other的索引并集 * 内连接:用calling DataFrame和other的索引交集 |
| lsuffix、rsuffix 即left suffix、right suffix | * lsuffix:左侧重复列的后缀(即calling df ) * rsuffix: 右侧重复列的后缀(即other) |
| sort: bool, default False | 按照字典顺序对结果在连接键上排序。如果为False,连接键的顺序取决于连接类型(关键字) |
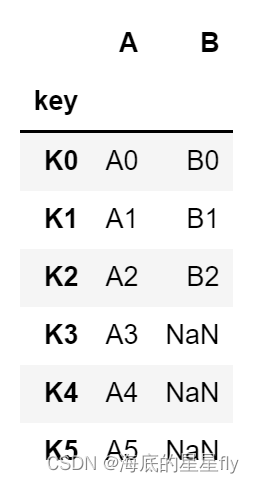
* 通过index进行连接:
>> df = pd.DataFrame({'key': ['K0', 'K1', 'K2', 'K3', 'K4', 'K5'],
                   'A': ['A0', 'A1', 'A2', 'A3', 'A4', 'A5']})
>> other = pd.DataFrame({'key': ['K0', 'K1', 'K2'],
                      'B': ['B0', 'B1', 'B2']})
>> df.join(other, lsuffix='_caller', rsuffix='_other')
输出结果为:

* 通过键列进行连接
# 通过键列连接,一种方式是可以将DataFrame和other列的key列设置为index
>> df.set_index('key').join(other.set_index('key'))
输出结果为:
# 通过键列连接,另一种方式是可以直接设置on参数连接
>> df.join(other.set_index('key'),on='key') # 必须把other的key列设置为index,否则会报错;因为默认是左连接,相当于on参数设置了key列为索引列
输出结果为:

2.5.3 删除列
2.5.2.1 通过del方法删除列
>> del df2['num']

>> df2.columns

[out]:Index(['year', 'state', 'population'], dtype='object')
2.5.2.2 通过drop删除列/行
pd.DataFrame.drop(self, labels=None, axis=0, index=None, columns=None, level=None, inplace=False, errors='raise')
使用drop删除行/列可使用两种方式:
* 直接输入要删除的行/列:
>> df2.drop(columns=['year'])

[out]:state population

0 A 1

1 B 2

2 C 3

3 D 4

>> df2.drop(index=[0,2])

[out]:year state population

1 2001 B 2

3 2003 D 4
* 输入行/列名,并指定axis轴向
>> df2.drop(['year'],axis=1)

[out]:state population

0 A 1

1 B 2

2 C 3

3 D 4
2.5.2.3 del 与 drop 的区别
在Python中,del 和drop方法都能够删除dataframe中的列数据,但两者也有着些许区别。
首先 del 属于 Python的内置函数函数,drop属于pandas中的内置函数
* drop对列和行都可进行操作;del仅可对列进行操作。
* drop一次可以处理多个项目;del一次只能操作一个。
* drop可以就地操作或返回副本;del仅是就地操作。
两种函数在执行效率上很接近,但是在较大数据上,drop函数优势更明显,尤其实在处理多列数据时
在Python中del 和drop方法都能够删除dataframe中的列数据,但两者也有着些许区别。
2.6 DataFrame 索引、切片与过滤
DataFrame选择数据的方式汇总如下:
>> df=pd.DataFrame(np.arange(16).reshape(4,4),index=range(4),columns=['one','two','three','four'])

>> df

[out]: one two three four

0 0 1 2 3

1 4 5 6 7

2 8 9 10 11

3 12 13 14 15| 方法 | 描述 | 示例 |
| df[val] | * 选择(索引/切片)列 | df['one'] df[['one','two']] |
| * 切片行 | df[:2] 切片前2行 df[2]索引第二行会报错 | |
| * 通过布尔值或布尔数组过滤行 | df[df>5] | |
| df.loc[val] | 使用轴标签(loc)可选择单行或多行 | df.loc[2] 会选择轴标签值为2的行 |
| df.loc[:,val] | 可选择列 | df.loc[:,'one'] |
| df.iloc[where] | 根据整数标签(iloc)位置索引行 | df.iloc[2] 会按存储顺序选择位置为2的行 |
| df.iloc[:,where] | 根据整数位置选择列 | df.iloc[:,2] |
| df.iloc[where_i,where_j] | 根据整数位置选择行和列 | df.iloc[1,2] |
| df.at[label_i,label_j] | 根据行、列标签选择单个标量值 | df.at[0,'two'] |
| df.iat[i,j] | 根据行列位置整数选择单个标量值 | df.iat[0,1] |
**注:因DataFrame 和 Series 中,存在轴标签值(0,1,2,...,n),会与位置序号存在重合,则df[:2]作为整数索引,容易存在误解,见下面三个例子:**
>> df[:2]  # 同numpy,取出前两行

[out]: one two three four

0 0 1 2 3

1 4 5 6 7

>> df.loc[:2]  # 与numpy不同,取出轴标签为2之前的所有行

[out]:one two three four

0 0 1 2 3

1 4 5 6 7

2 8 9 10 11

>> df.iloc[:2]  # 使用整数标签索引,取出前两行,同numpy

[out]:one two three four

0 0 1 2 3

1 4 5 6 7
基于以上例子,可以得出结论:在DataFrame 和 Series 中,如涉及整数索引,则最好使用轴标签(loc)和整数标签(iloc)进行区分。
三、DataFrame 和 Series 运算
3.1 算术运算
DataFrame 和 Series 的算术计算,计算规则和广播规则与numpy总体相同。不同的是,对于索引值相同的行/列,会直接进行算术计算;对于索引值不同的行/列,则会生成NA。
| 方法 | 描述 |
| add(df1,df2,fill_value) | 计算df1+df2 |
| radd(df1,df2,fill_value) | 计算df2+df1 |
| sub,rsub | 减法 |
| div,rdiv | 除法 |
| floordiv,rfloordiv | 整除(//) |
| mul,rmul | 乘法 |
| pow,rpow | 幂次方(**) |
3.2 函数运算
3.2.1 一元通用函数
numpy的一元通用函数,可直接适用于DataFrame.
3.2.2 行/列应用函数
pd.DataFrame.apply(self, func, axis=0, raw=False, result_type=None, args=(),**kwds) Apply a function along an axis of the DataFrame. 将函数作用于DataFrame的行/列。
>> df1=pd.DataFrame(np.random.randint(1,20,(3,4)),columns=list('abcd'))

>> df1.apply(lambda x:x.max()-x.min())

[out]:a    4

       b    6

       c    3

       d    6

       dtype: int64

>> def f(x):

    return pd.Series([x.max(),x.min()],index=['max','min'])

>> df1.apply(f,axis=1)

[out]: max min

       0 10 1

       1 14 3

       2 11 7
3.2.3 元素应用函数
对于自定义函数,可通过applymap应用于DataFrame的每个元素。
pd.DataFrame.applymap(self, func) -> 'DataFrame' Apply a function to a Dataframe elementwise.
# 将df的数据精确为两位数

>> format=lambda x:'%.2f' % x

>> df1.applymap(format)

[out]:a b c d

0 10.00 1.00 7.00 5.00

1 14.00 3.00 9.00 3.00

2 11.00 7.00 10.00 9.00
四、DataFrame 和 Series 排序和排名
4.1 排序
4.1.1 按索引排序
函数:DataFrame.sort_index(axis=0, level=None, ascending=True, inplace=False, kind='quicksort', na_position='last', sort_remaining=True, ignore_index=False, key=None),参数如下:
| 参数 | 值 | 说明 |
| axis | {0 or 'index', 1 or 'columns'}, default 0 | 选择按行或列进行排序 |
| level | int or level name | 选择要排序的索引级别 |
| ascending | bool | 选择升序或降序排列,默认升序 |
| inplace | bool | 选择是否对原df执行替换操作 |
| kind | {'quicksort', 'mergesort', 'heapsort'}, default 'quicksort' | 指定排序算法 |
| na_position | {'first', 'last'}, default 'last' | 选择将NA值排序在最开始还是最结束 |
| sort_remaining | bool | 指定是否也按其他级别排序 |
4.1.2 按元素值排序
函数:DataFrame.sort_values(by, axis=0, ascending=True, inplace=False, kind='quicksort', na_position='last', ignore_index=False, key=None),参数如下:
| 参数 | 值 | 说明 |
| by | str or list of str | 指定列名(选择axis=0或’index’时)或行索引值(选择axis=1或’columns’时) |
| axis | {0 or 'index', 1 or 'columns'}, default 0 | 选择按行或列进行排序 |
| ascending | bool | 选择升序或降序排列,默认升序 |
| inplace | bool | 选择是否对原df执行替换操作 |
| kind | {'quicksort', 'mergesort', 'heapsort'}, default 'quicksort' | 指定排序算法 |
| na_position | {'first', 'last'}, default 'last' | 选择将NA值排序在最开始还是最结束 |
4.2 排名
函数:pd.DataFrame.rank(self, axis=0, method, numeric_only= None, na_option:, ascending= True, pct = False),排名中的平级关系处理方法method参数如下:
| 参数 | 说明 |
| average | average rank of the group,取平均数的方法 |
| min | lowest rank in the group,取最小值 |
| max | highest rank in the group,取最大值 |
| first | ranks assigned in order they appear in the array,取首次出现的顺序 |
| dense | like 'min', but rank always increases by 1 between groups |
五、 DataFrame 和 Series 常用统计函数
| 统计方法 | 统计函数 |
| 计算非NA值个数 | pd.DataFrame.count(self, axis=0, level=None, numeric_only=False) Count non-NA cells for each column or row. |
| 统计描述汇总 | pd.DataFrame.describe Generate descriptive statistics. |
| 最大、最小值 | pd.DataFrame.max/min(self, axis=None, skipna=None, level=None, numeric_only=None, **kwargs) Return the maximum/minimum of the values for the requested axis. |
| 计算Series极值所在索引位置 | pd.Series.argmax/argmin(self, axis=None, skipna=True, *args, **kwargs) Return int position of the largest/smallest value in the Series. |
| 计算DataFrame极值所在索引标签 | pd.DataFrame.idxmax/idxmin(self, axis=0, skipna=True) Return index of first occurrence of maximum/minimum over requested axis. |
| 求和 | pd.DataFrame.sum(self, axis=None, skipna=None, level=None, numeric_only=None, min_count=0, **kwargs) Return the sum of the values for the requested axis. |
| 均值 | mean(self, axis=None, skipna=None, level=None, numeric_only=None, **kwargs) Return the mean of the values for the requested axis. |
| 中位数 | median(self, axis=None, skipna=None, level=None, numeric_only=None, **kwargs) Return the median of the values for the requested axis. |
| 平均绝对误差 | pd.DataFrame.mad(self, axis=None, skipna=None, level=None) Return the mean absolute deviation of the values for the requested axis. |
| 乘积 | pd.DataFrame.prod(self, axis=None, skipna=None, level=None, numeric_only=None, min_count=0, **kwargs) Return the product of the values for the requested axis. |
| 方差 | pd.DataFrame.var(self, axis=None, skipna=None, level=None, ddof=1, numeric_only=None, **kwargs) Return unbiased variance over requested axis. |
| 标准差 | pd.DataFrame.std(self, axis=None, skipna=None, level=None, ddof=1, numeric_only=None, **kwargs) Return sample standard deviation over requested axis. |
| 样本偏度值 | pd.DataFrame.skew(self, axis=None, skipna=None, level=None, numeric_only=None, **kwargs) Return unbiased skew over requested axis. |
| 样本峰度值 | pd.DataFrame.kurt(self, axis=None, skipna=None, level=None, numeric_only=None, **kwargs) Return unbiased kurtosis over requested axis. |
| 累计值 | cumsum\cummin\cummax\cumprod 计算累计值:累加值、累计最小值、累计最大值、累乘 |
| 百分比 | pd.DataFrame.pct_change(self, periods=1, fill_method='pad', limit=None, freq=None, **kwargs) Percentage change between the current and a prior element. |
| 协方差 | pd.DataFrame.cov Compute pairwise covariance of columns, excluding NA/null values. |
| 相关系数 | pd.DataFrame.corr(self, method='pearson', min_periods=1) Compute pairwise correlation of columns, excluding NA/null values. |
| 相关系数 | pd.DataFrame.corrwith(self, other, axis=0, drop=False, method='pearson') Compute pairwise correlation. |
| 判断元素值是否在指定数据中 | pd.DataFrame.isin(self, values) Whether each element in the DataFrame is contained in values. |
| 正则表达式匹配 | pd.Series.str.match(self, pat, case=True, flags=0, na=nan) Determine if each string starts with a match of a regular expression. |
| 计算唯一值 | pd.Series.unique(self) Return unique values of Series object. |
| 计算唯一值的数量 | pd.DataFrame.value_counts(self, subset, normalize, sort, ascending) Return a Series containing counts of unique rows in the DataFrame. |
注明:
平均绝对误差:
样本偏度值:偏度 ( skewness )是度量分布函数不对称程度的统计量;样本峰度值:峰度反应的是图像的尖锐程度。[样本偏度和峰度](https://www.cnblogs.com/jiaxin359/p/8977333.html)
六、布尔型DataFrame的any/all方法
布尔型DataFrame的any/all方法用于判断布尔数组在行/列轴向上的逻辑运算情况,any即或运算,任何一个元素为真即为真;all即并运算,全部元素为真即为真。
pd.DataFrame.any(self, axis=0, bool_only=None, skipna=True, level=None, **kwargs)
Return whether any element is True over requested axis.
pd.DataFrame.all(self, axis=0, bool_only=None, skipna=True, level=None, **kwargs)
Return whether all elements are True, potentially over an axis.


 2881
2881


 被折叠的 条评论
为什么被折叠?
被折叠的 条评论
为什么被折叠?
 到【灌水乐园】发言


