


就医提醒
我们通过定时任务,每天8点执行,提醒就诊
搭建service-task服务
pom配置文件
<dependencies>
    <dependency>
        <groupId>com.atguigu</groupId>
        <artifactId>rabbit_util</artifactId>
        <version>0.0.1-SNAPSHOT</version>
    </dependency>
</dependencies>
application.properties
# 服务端口
server.port=8207
# 服务名
spring.application.name=service-task
# 环境设置:dev、test、prod
spring.profiles.active=dev

# nacos服务地址
spring.cloud.nacos.discovery.server-addr=127.0.0.1:8848

#rabbitmq地址
spring.rabbitmq.host=192.168.44.165
spring.rabbitmq.port=5672
spring.rabbitmq.username=guest
spring.rabbitmq.password=guest
在rabbit-util模块com.atguigu.yygh.common.constant.MqConst类添加
public static final String EXCHANGE_DIRECT_TASK = "exchange.direct.task";
public static final String ROUTING_TASK_8 = "task.8";
//队列
public static final String QUEUE_TASK_8 = "queue.task.8";
启动类
@SpringBootApplication(exclude = DataSourceAutoConfiguration.class)//取消数据源自动配置
@EnableDiscoveryClient
public class ServiceTaskApplication {
    public static void main(String[] args) {
        SpringApplication.run(ServiceTaskApplication.class, args);
    }
}
建立service
@Component
@EnableScheduling
@Slf4j
public class ScheduledTask {

    @Autowired
    private RabbitService rabbitService;

    //每天八点执行方法,就医提醒
    //0 0 8 * * ?
    //每第30s开始执行
    @Scheduled(cron = "0 0 8 * * ?")
    public void taskPatient() {
        Date date = new Date();
        SimpleDateFormat sdf = new SimpleDateFormat("yyyy/MM/dd HH:mm");
        log.info("定时任务开始执行" + sdf.format(date));
        rabbitService.sendMessage(MqConst.EXCHANGE_DIRECT_TASK, MqConst.ROUTING_TASK_8, "start");
    }
}
order建立监听模块
@Component
@Slf4j
public class OrderReceiver {

    @Autowired
    private OrderService orderService;

    @RabbitListener(bindings = @QueueBinding(
            value = @Queue(value = MqConst.QUEUE_TASK_8, durable = "true"),
            exchange = @Exchange(value = MqConst.EXCHANGE_DIRECT_TASK),
            key = {MqConst.ROUTING_TASK_8}
    ))
    public void patientTips(String str) {
        log.info("收到信息" + str);
        orderService.patientTips();
    }

}
orderService
@Override
public void patientTips() {
    QueryWrapper<OrderInfo> queryWrapper = new QueryWrapper<>();
    queryWrapper.eq("reserve_date", new DateTime().toString("yyyy-MM-dd"));
    queryWrapper.ne("order_status", OrderStatusEnum.CANCLE.getStatus());
    List<OrderInfo> orderInfos = baseMapper.selectList(queryWrapper);
    for (OrderInfo orderInfo : orderInfos) {
        //短信提示
        MsmVo msmVo = new MsmVo();
        msmVo.setPhone(orderInfo.getPatientPhone());
        String reserveDate = new DateTime(orderInfo.getReserveDate()).toString("yyyy-MM-dd") + (orderInfo.getReserveTime() == 0 ? "上午" : "下午");
        Map<String, Object> param = new HashMap<String, Object>() {{
            put("title", orderInfo.getHosname() + "|" + orderInfo.getDepname() + "|" + orderInfo.getTitle());
            put("reserveDate", reserveDate);
            put("name", orderInfo.getPatientName());
        }};
        msmVo.setParam(param);
        rabbitService.sendMessage(MqConst.EXCHANGE_DIRECT_MSM, MqConst.ROUTING_MSM_ITEM, msmVo);
    }
}
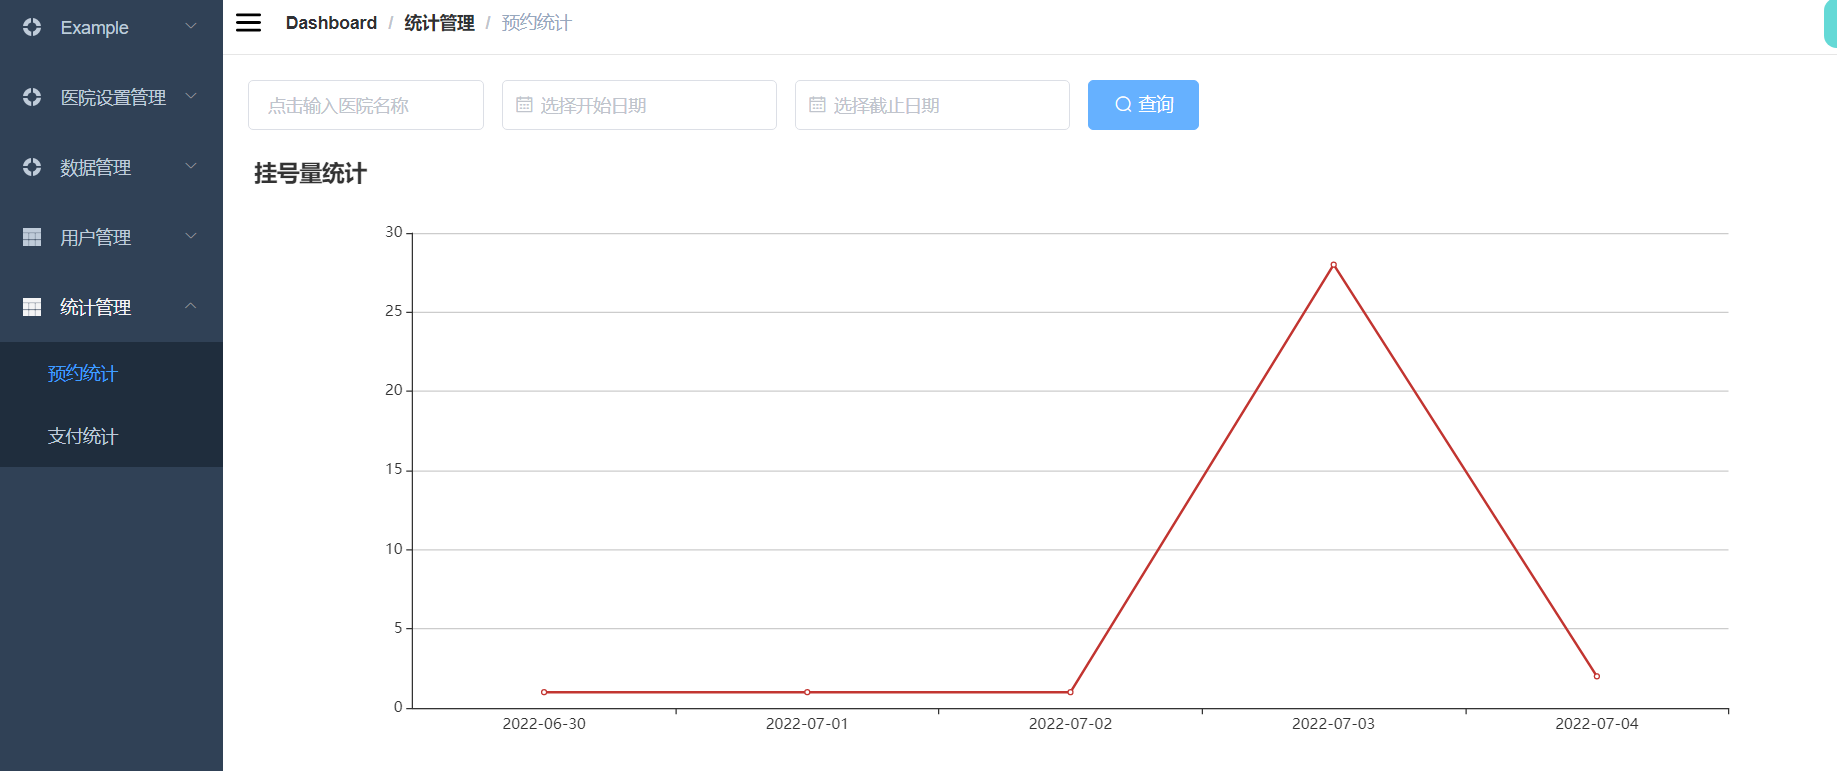
预约统计
我们要再管理页面添加一个可以展示每天预约数的折线图.
这里我们用到了ECharts来做
思路分析
1.前端发送一带有查询数据的请求,到sta模块
2.sta调用feign请求order模块,
3.order模块获取每日预约数
Echarts
ECharts是百度的一个项目,后来百度把Echart捐给apache,用于图表展示,提供了常规的折线图、柱状图、散点图、饼图、K线图,用于统计的盒形图,用于地理数据可视化的地图、热力图、线图,用于关系数据可视化的关系图、treemap、旭日图,多维数据可视化的平行坐标,还有用于 BI 的漏斗图,仪表盘,并且支持图与图之间的混搭。
官方网站:https://echarts.apache.org/zh/index.html
(1)引入ECharts
<!-- 引入 ECharts 文件 -->
<script src="echarts.min.js"></script>
(2)定义图表区域
<!-- 为ECharts准备一个具备大小(宽高)的Dom -->
<div id="main" style="width: 600px;height:400px;"></div>
(3)渲染图表(折线图)
<script>
var myChart = echarts.init(document.getElementById('main'));

var option = {

    //x轴是类目轴(离散数据),必须通过data设置类目数据

    xAxis: {

        type: 'category',

        data: ['Mon', 'Tue', 'Wed', 'Thu', 'Fri', 'Sat', 'Sun']

    },

    //y轴是数据轴(连续数据)

    yAxis: {

        type: 'value'

    },

    //系列列表。每个系列通过 type 决定自己的图表类型

    series: [{

        //系列中的数据内容数组

        data: [820, 932, 901, 934, 1290, 1330, 1320],

        //折线图

        type: 'line'

    }]

};

myChart.setOption(option);
项目集成EChart
npm install --save echarts@4.1.0
Order模块
添加接口Mapper
@Mapper
public interface OrderMapper extends BaseMapper<OrderInfo> {
    List<OrderCountVo> selectOrderCount(@Param("vo") OrderCountQueryVo orderCountQueryVo);

    List<OrderAmountVo> selectOrderAmount(@Param("vo") OrderCountQueryVo orderCountQueryVo);
}
添加mapper.xml
<?xml version="1.0" encoding="UTF-8" ?>
<!DOCTYPE mapper PUBLIC "-//mybatis.org//DTD Mapper 3.0//EN"
"http://mybatis.org/dtd/mybatis-3-mapper.dtd">
<mapper namespace="com.example.yygh.order.mapper.OrderMapper">
<!--查询每日的预约数-->
<select id="selectOrderCount" resultType="com.example.yygh.vo.order.OrderCountVo">
select reserve_date as reserveDate, count(reserve_date) as count
from order_info
<where>
<if test="vo.hosname != null and vo.hosname != ''">
and hosname like CONCAT('%',#{vo.hosname},'%')
</if>
<if test="vo.reserveDateBegin != null and vo.reserveDateBegin != ''">
and reserve_date >= #{vo.reserveDateBegin}
</if>
<if test="vo.reserveDateEnd != null and vo.reserveDateEnd != ''">
and reserve_date <= #{vo.reserveDateEnd}
</if>
and is_deleted = 0
</where>
group by reserve_date
order by reserve_date
</select>
<!--查询每日的预约数-->
<select id="selectOrderAmount" resultType="com.example.yygh.vo.order.OrderAmountVo">
select reserve_date as reserveDate, sum(amount) as amount
from order_info
<where>
<if test="vo.hosname != null and vo.hosname != ''">
and hosname like CONCAT('%',#{vo.hosname},'%')
</if>
<if test="vo.reserveDateBegin != null and vo.reserveDateBegin != ''">
and reserve_date >= #{vo.reserveDateBegin}
</if>
<if test="vo.reserveDateEnd != null and vo.reserveDateEnd != ''">
and reserve_date <= #{vo.reserveDateEnd}
</if>
and is_deleted = 0
</where>
group by reserve_date
order by reserve_date
</select>
</mapper>
建立FeignClient
@FeignClient("service-order")
public interface OrderFeignClient {
    /**
     * 统计每天的预约数
     * @param orderCountQueryVo
     * @return
     */
    @PostMapping("/api/order/orderInfo/inner/getCountMap")
    public Map<String, Object> getCountMap(@RequestBody OrderCountQueryVo orderCountQueryVo);

    /**
     * 统计每天的挂号金额
     * @param orderCountQueryVo
     * @return
     */
    @PostMapping("/api/order/orderInfo/inner/getAmount")
    public Map<String, Object> getAmunt(@RequestBody OrderCountQueryVo orderCountQueryVo);

}
sta模块
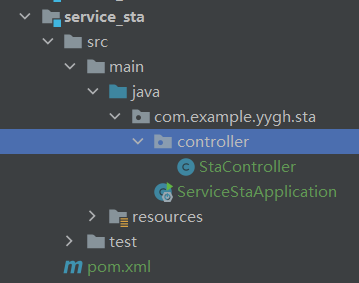
controller
@RestController
@RequestMapping("/admin/sta")
public class StaController {
    @Autowired
    private OrderFeignClient orderFeignClient;

    @ApiOperation(value = "获取订单统计数据")
    @GetMapping("getCountMap")
    public Result getCountMap(@ApiParam(name = "orderCountQueryVo", value = "查询对象", required = false) OrderCountQueryVo orderCountQueryVo) {
        return Result.ok(orderFeignClient.getCountMap(orderCountQueryVo));
    }

    @ApiOperation(value = "获取金额统计数据")
    @GetMapping("getAmount")
    public Result getAmount(@ApiParam(name = "orderCountQueryVo", value = "查询对象", required = false) OrderCountQueryVo orderCountQueryVo) {
        return Result.ok(orderFeignClient.getAmunt(orderCountQueryVo));
    }
}
前端
修改src/router/index.js
{
path: '/statistics',
component: Layout,
redirect: '/statistics/order/index',
name: 'BasesInfo',
meta: { title: '统计管理', icon: 'table' },
alwaysShow: true,
children: [
{
path: 'order/index',
name: '预约统计',
component: () => import('@/views/statistics/order/index'),
meta: { title: '预约统计' }
},
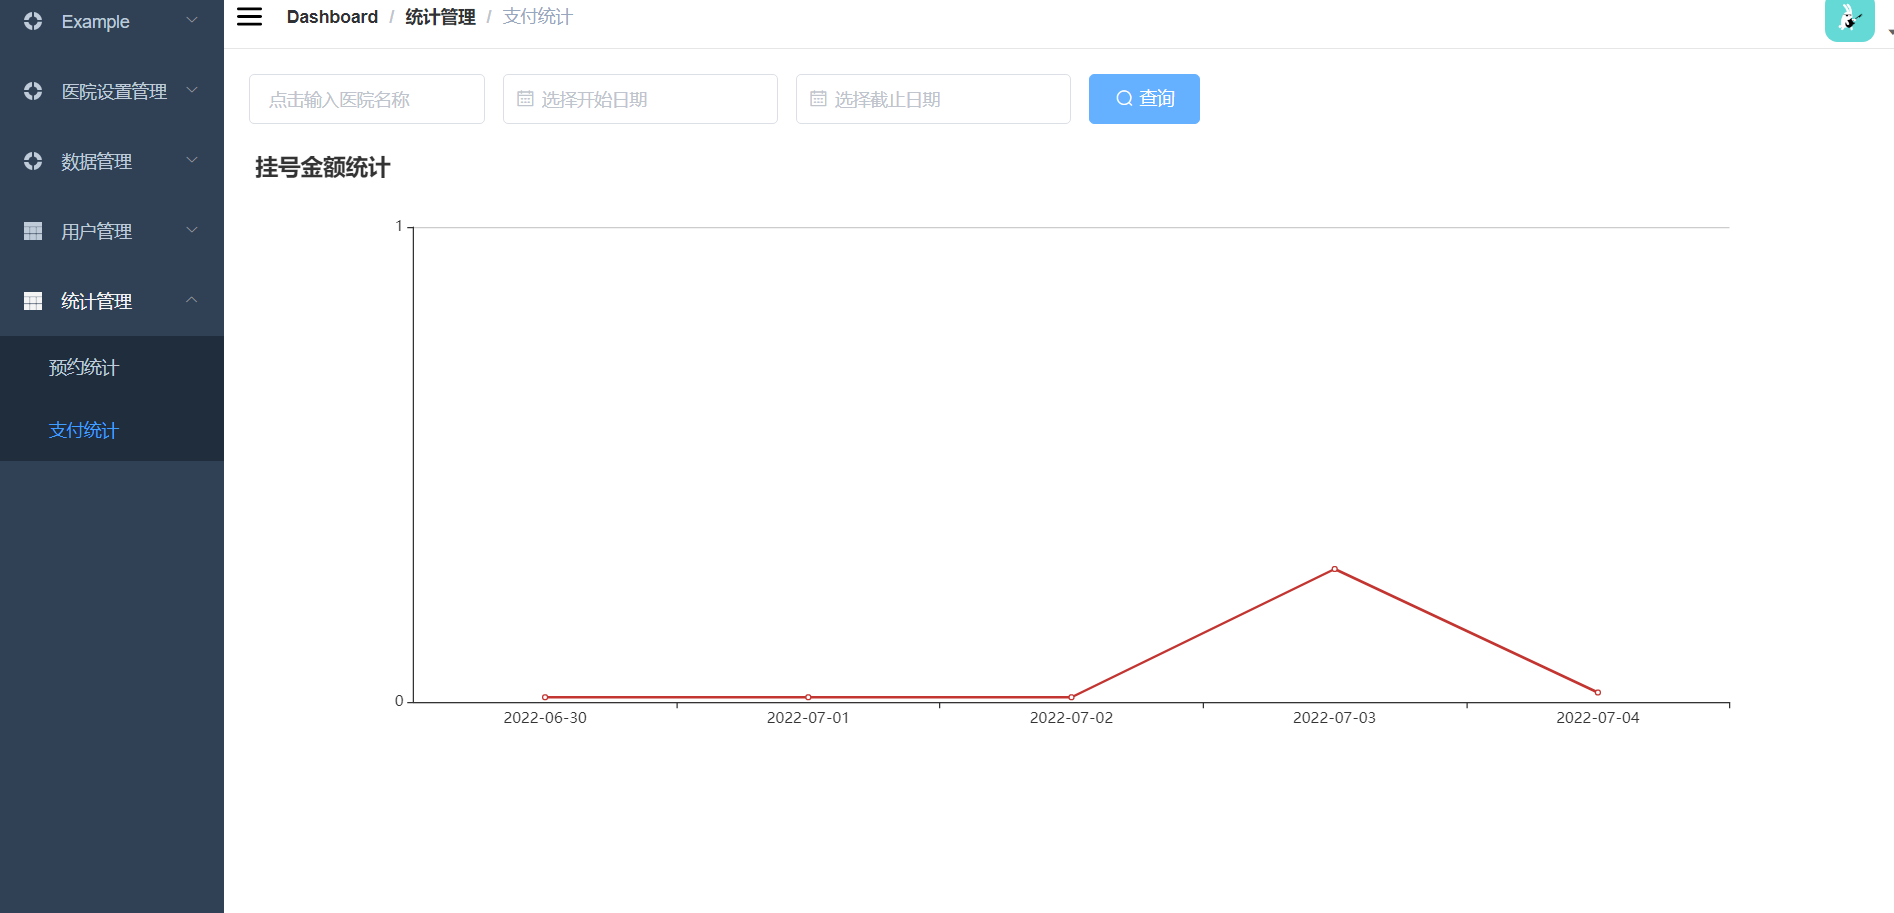
{
path: 'order/pay',
name: '支付统计',
component: () => import('@/views/statistics/order/amount'),
meta: { title: '支付统计' }
}
]
},
添加src/api/orderStatistics.js
export default {

  getCountMap(searchObj) {
    return request({
      url: `${api_name}/getCountMap`,
      method: 'get',
      params: searchObj
    })
  },
  getAmount(searchObj) {
    return request({
      url: `${api_name}/getAmount`,
      method: 'get',
      params: searchObj
    })
  }
}
添加src/views/statistics/order/index.vue
<template>
  <div class="app-container">
    <!--表单-->
    <el-form :inline="true" class="demo-form-inline">
      <el-form-item>
        <el-input v-model="searchObj.hosname" placeholder="点击输入医院名称"/>
      </el-form-item>

      <el-form-item>
        <el-date-picker
          v-model="searchObj.reserveDateBegin"
          type="date"
          placeholder="选择开始日期"
          value-format="yyyy-MM-dd"/>
      </el-form-item>
      <el-form-item>
        <el-date-picker
          v-model="searchObj.reserveDateEnd"
          type="date"
          placeholder="选择截止日期"
          value-format="yyyy-MM-dd"/>
      </el-form-item>
      <el-button
        :disabled="btnDisabled"
        type="primary"
        icon="el-icon-search"
        @click="showChart()">查询</el-button>
    </el-form>

    <div class="chart-container">
      <div id="chart" ref="chart"
           class="chart" style="height:500px;width:100%"/>
    </div>
  </div>
</template>

<script>
import echarts from 'echarts'
import statisticsApi from '@/api/orderStatistics'

export default {

  data() {
    return {
      searchObj: {
        hosname: '',
        reserveDateBegin: '',
        reserveDateEnd: ''
      },
      btnDisabled: false,
      chart: null,
      title: '',
      xData: [], // x轴数据
      yData: [] // y轴数据
    }
  },

  methods: {
    // 初始化图表数据
    showChart() {
      statisticsApi.getCountMap(this.searchObj).then(response => {
        this.yData = response.data.countList
        this.xData = response.data.dateList
        this.setChartData()
      })
    },

    setChartData() {
      // 基于准备好的dom,初始化echarts实例
      var myChart = echarts.init(document.getElementById('chart'))
      // 指定图表的配置项和数据
      var option = {
        title: {
          text: this.title + '挂号量统计'
        },
        tooltip: {},
        legend: {
          data: [this.title]
        },
        xAxis: {
          data: this.xData
        },
        yAxis: {
          minInterval: 1
        },
        series: [{
          name: this.title,
          type: 'line',
          data: this.yData
        }]
      }

      // 使用刚指定的配置项和数据显示图表。
      myChart.setOption(option)
    },
  }
}
</script>
效果图


 1481
1481


 被折叠的 条评论
为什么被折叠?
被折叠的 条评论
为什么被折叠?
 到【灌水乐园】发言


