


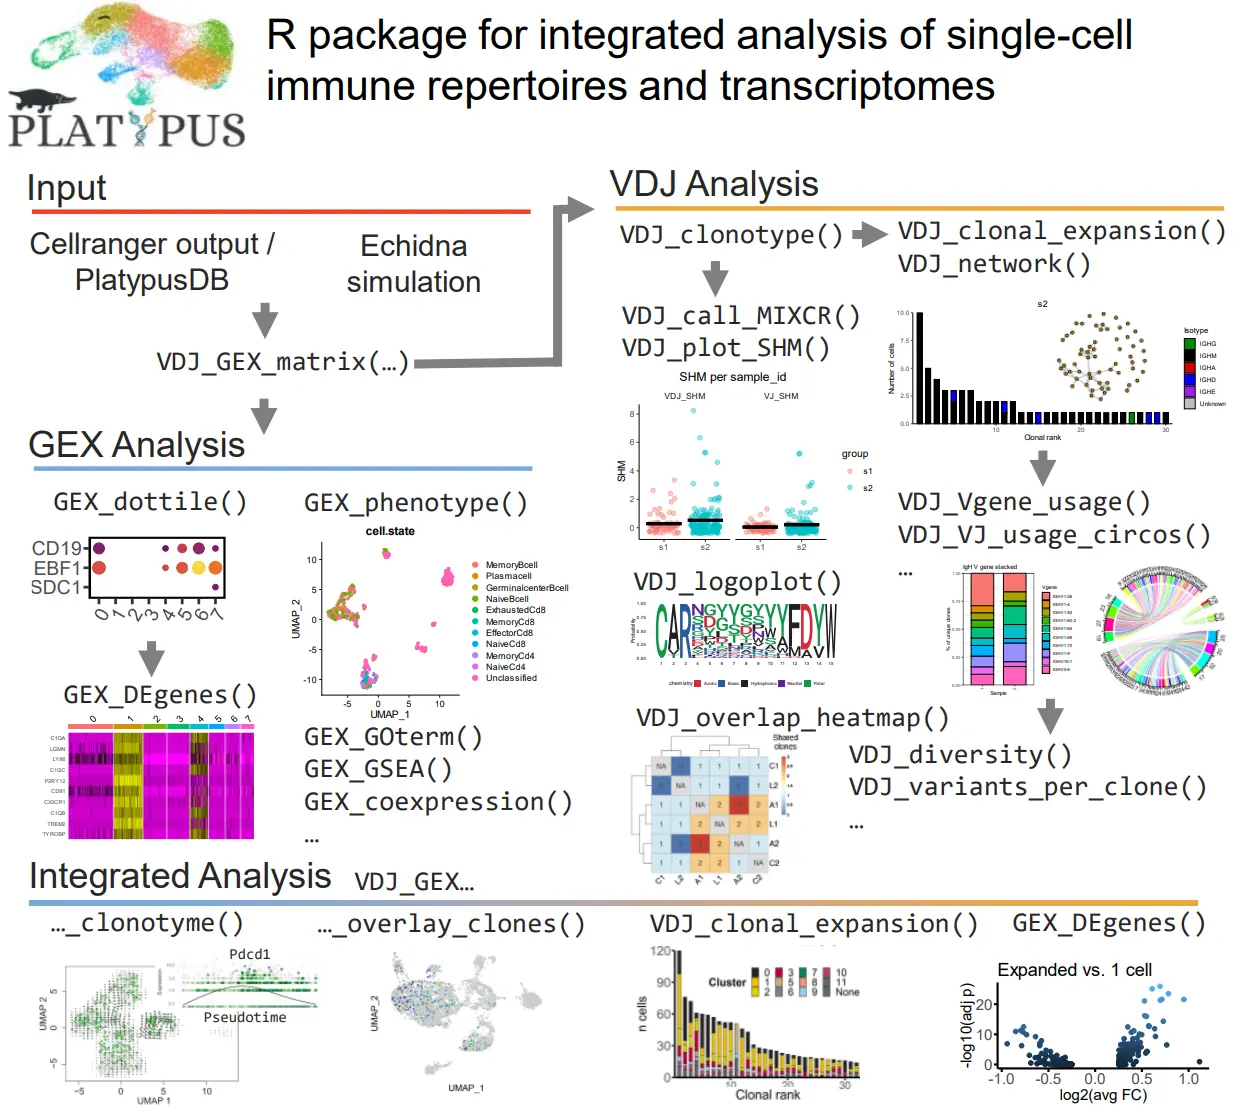
 本文分享了10X单细胞和VDJ联合分析方法PlatypusDB。该方法最新升级,围绕VDJ_GEX_matrix函数重建。Platypus可单独或集成分析基因表达和免疫受体库数据,还介绍了基因表达分析、VDJ分析及两者信息整合的具体操作,强调关注VDJ氨基酸序列。
hello,大家好,今天我们来分享一个10X单细胞和VDJ联合分析的方法,PlatypusDB,关于转录组和VDJ联合分析的方法,之前也分享了不少了,这篇文章参考于Platypus: an open-access software for integrating lymphocyte single-cell immune repertoires with transcriptomes,2021年6月发表于NAR Genomics and Bioinformatics,方法值得一看,今天我们就来分享这个方法。首先强调一句,一定要关注VDJ氨基酸的序列。
当然,这个方法最新才升级,由于最近 Cellranger(第 5 版和第 6 版)中默认克隆分型策略的变化,目前重建 Platypus 的 v3 以围绕 VDJ_GEX_matrix 函数。 该函数集成了VDJ repertoire和转录组信息,并将作为包未来迭代中所有次要函数的输入。 这样做的好处是在每个细胞水平上拥有所有的repertoire和转录组信息。
Platypus 是一个包,旨在促进单细胞免疫组库测序实验的分析。 该软件包可用于单独分析基因表达 (GEX) 或免疫受体库 (VDJ) 测序数据,此外还可以集成两个数据集以将表型特征与repertoire分析相结合。 该软件包旨在主要分析 10x 基因组细胞管理器的输出(来自 GEX 和 VDJ 计数的输出,用于丰富的免疫受体库)。 假设正确添加了输入列,这些函数可以与其他基于条形码的 scSeq 技术一起使用。 基因表达分析在很大程度上依赖于 Seurat,这是一种常用的单细胞测序 (scSeq) R 包。
### Removing any previous versions of the package
#First can ensure that there is no previous version installed locally
#detach("package:Platypus", unload=TRUE)
#remove.packages("Platypus")

### Dependencies
#install.packages("stringr")

### Downloading and installing Platypus

# First we need to download the most recent version from the master branch at https://github.com/alexyermanos/Platypus we can install the package using the following command.
# WARNING: This needs to be replaced with your own directory where the downloaded package is found

# For MacOS users it may look like this
#install.packages("~/Downloads/Platypus_3.0.tar.gz", repos = NULL, type="source")

# For windows it will likely look something like this.
# WARNING: You will need to replace 'YourPCName' with your user name for the windows account in the directory.
# install.packages("C:\Users\YourPCName\Downloads\Platypus_3.0.tar.gz", repos = NULL, type="source")

# Now we can load the installed package into the R environment. In case of problems with installing other R packages that are used in Platypus, please see the README file at the https://github.com/alexyermanos/Platypus, where we outline how to install the other R packages for both Windows and MacOS.
#library(Platypus)

# The individual R functions can additionally be found on the github in the Functions branch. Within this branch, there is a folder "R" which contains the individual functions. This can similarly be downloaded and loaded into the R environment in case not all functions are desired. These functions are actively updated and may include more features than the in original tar.gz file.
Extracting and integrating repertoire data with VDJ_GEX_matrix (Platypus v3),其实这一步就是在提取免疫细胞的转录组和VDJ数据。
### Downloading the test data for VDJ_GEX_matrix
# While the Platypus manuscript uses the COVID-19 data, the vignette for Platypus v3 will use the data from B cells in the aged CNS, which can be found at the following link https://polybox.ethz.ch/index.php/s/fxQJ3NrRSwiPSSo This small dataset contains VDJ (separate libraries for B) and GEX libraries from the central nervous system of two murine samples. More information can be found https://doi.org/10.1098/rspb.2020.2793

# After downloading the zip file named "Platypus_CNS_data.zip", please unzip the file and find the path to the newly formed folder. Typically this will be in the Downloads folder, so the code below should work on MacOS. For windows please uncomment the code and change the user name to match your PC.

VDJ.out.directory.list <- list() ### Set directory to the outs folder of cellranger vdj
VDJ.out.directory.list[[1]] <- c("~/Downloads/Platypus_CNS_data/VDJ_S1/")
VDJ.out.directory.list[[2]] <- c("~/Downloads/Platypus_CNS_data/VDJ_S2/")

GEX.out.directory.list <- list() ### Set directory to the outs folder of cellranger count
GEX.out.directory.list[[1]] <- c("~/Downloads/Platypus_CNS_data/GEX_S1/")
GEX.out.directory.list[[2]] <- c("~/Downloads/Platypus_CNS_data/GEX_S2/")

# For windows:
#directory_to_covid_patients_gex[[1]] <- c("C:\Users\YourPCName\Downloads\PlatypusTestData\Patient1_GEX")
#directory_to_covid_patients_gex[[2]] <- c("C:\Users\YourPCName\Downloads\PlatypusTestData\Patient2_GEX")

# We will call the output vgm (short for Vdj_Gex_Matrix) - this object can be supplied as input to downstream functions in v3 of the package.
vgm <- Platypus::VDJ_GEX_matrix(VDJ.out.directory.list = VDJ.out.directory.list,
                               GEX.out.directory.list = GEX.out.directory.list,
                               GEX.integrate = T,
                               VDJ.combine = T,
                               integrate.GEX.to.VDJ = T,
                               integrate.VDJ.to.GEX = T,
                               exclude.GEX.not.in.VDJ = F,
                               filter.overlapping.barcodes.GEX = F,
                               filter.overlapping.barcodes.VDJ = F,
                               get.VDJ.stats = T,
                               parallel.processing = "none",
                               subsample.barcodes = F,
                               trim.and.align = F,
                               group.id = c(1,2))
## The output will be a list -
# vgm[[1]] corresponds to the VDJ master dataframe
# vgm[[2]] corresponds to the GEX in the form of a seurat object
# vgm[[3]] corresponds to the output of VDJ_stats subfunction - which provides information about the number of chains, sequencing reads, etc
# vgm[[4]] holds the input parameters
# vgm[[5]] holds the sessionInfo output at the time of function call
接下来首先是单独分析,Gene expression analysis (Platypus v2)
cellranger 的 count 函数的输出以表达矩阵、条形码和基因标识符的形式返回基因表达信息。函数automated_GEX 使我们能够自动对来自 cellranger 的基因表达文库进行转录分析。输入目录应设置为包含这三个文件的目录:barcodes.tsv.gz、features.tsv.gz、matrix.mtx.gz。如果需要分析多个不同的转录组(例如,在单独的 UMAP 空间上),这些目录应进入单独的列表对象。例如,如果有 20 个repertoires并且想要分别分析它们(20 个单独的 UMAP,20 个单独的repertoires),那么输入目录的每个外部列表元素将包含各个repertoires/GEX 文件的目录。此函数的输出是一个 Seurat 对象,类似于 Seurat 注释中演示的标准管道。这涉及缩放、归一化、聚类和执行降维(默认为 tSNE 和 UMAP)。在这个阶段,没有纳入repertoires特征,需要使用 Platypus 中的后续功能进行集成。
当然, Platypus集成了Seurat的功能。(我们简单看看)
### Removing any previous versions of the package
#First, ensure there is no previous version installed locally
#detach("package:Platypus", unload=TRUE)
#remove.packages("Platypus")

### Downloading and installing Platypus

# Download most recent version from master branch at https://github.com/alexyermanos/Platypus We can install the package using the following command.
# WARNING: This needs to be replaced with your own directory where the downloaded package is found

# For MacOS users it may look like this:
#install.packages("~/Downloads/Platypus_2.0.5.tar.gz", repos = NULL, type="source")

# For windows it will likely look something like this:
# WARNING: You will need to replace 'YourPCName' with your user name for the windows account in the directory.
# install.packages("C:\Users\YourPCName\Downloads\Platypus_2.0.6.tar.gz", repos = NULL, type="source")

# Now we can load the installed package into the R environment. In case of problems with installing other R packages that are used in Platypus, please see the README file at the https://github.com/alexyermanos/Platypus, where we outline how to install the other R packages for both Windows and MacOS.
library(Platypus)

# Individual R functions can additionally be found on the github Functions branch. Within this branch, there is a folder "R" which contains the individual functions. This can similarly be downloaded and loaded into the R environment in case not all functions are desired. These functions are actively updated and may include more features than the in original tar.gz file.

### Downloading the test data
# The COVID-19 data (~136 MB size of the zip file) can be found at the following link https://polybox.ethz.ch/index.php/s/fxQJ3NrRSwiPSSo This dataset contains VDJ (separate libraries for B and T cells) and GEX libraries from two convalescent COVID-19 patients.

# After downloading the zip file named "PlatypusTestData.zip", please unzip the file and find the path to the newly formed folder. Typically this will be in the Downloads folder, so the code below should work on MacOS. For Windows please uncomment the code and change the user name to match your PC.

directory_to_covid_patients_gex <- list()
directory_to_covid_patients_gex[[1]] <- c("~/Downloads/PlatypusTestData/Patient1_GEX/")
directory_to_covid_patients_gex[[2]] <- c("~/Downloads/PlatypusTestData/Patient2_GEX/")

# For Windows:
#directory_to_covid_patients_gex[[1]] <- c("C:\Users\YourPCName\Downloads\PlatypusTestData\Patient1_GEX")
GEX_automate 允许我们在一行代码中执行标准的 Seurat 管道,并能够更改 Seurat 使用的参数,包括最小读取数、线粒体基因百分比、cluster分辨率等。此外,我们可以从 通过简单地将 VDJ.gene.filter 参数设置为 TRUE,数据集不会让克隆影响转录聚类。
covid_gex_patients_not_integrated <- Platypus::GEX_automate(GEX.outs.directory.list = directory_to_covid_patients_gex,integration.method = "scale.data",mito.filter = 20,cluster.resolution = 0.5,VDJ.gene.filter = T)
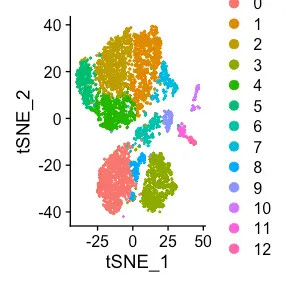
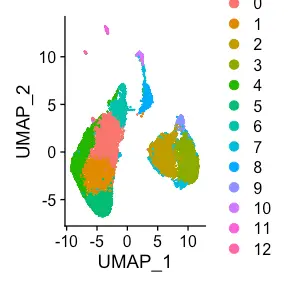
现在可以单独可视化每个患者的二维图。 默认情况下,对象中包含 UMAP、PCA 和 TSNE 缩减。 在默认参数下,这将显示来自 Patient1 的 GEX 库中的所有cell。 通过更改为第二个列表元素,我们可以查看来自 Patient2 的cell。
Seurat::DimPlot(covid_gex_patients_not_integrated[[1]],reduction = "umap")

Seurat::DimPlot(covid_gex_patients_not_integrated[[1]],reduction = "pca")

Seurat::DimPlot(covid_gex_patients_not_integrated[[1]],reduction = "tsne")

# UMAP for the second patient
Seurat::DimPlot(covid_gex_patients_not_integrated[[2]],reduction = "umap")
如果有兴趣合并转录组(对应于两个不同的基因表达库),则将这两个目录提供给单个列表元素。 GEX_automate 的输出(这次对应于单个 Seurat 对象列表元素)包含一个列,其中包含基于输入目录顺序的样本来源信息。 此外,如果存在生物重复,则可以按组标记不同的样本。 在这种情况下,只需将患者设置为 group1 和 group2 .
directory_to_covid_patients_integrated <- list()
directory_to_covid_patients_integrated[[1]] <- c("~/Downloads/PlatypusTestData/Patient1_GEX/",
                                                 "~/Downloads/PlatypusTestData/Patient2_GEX/")

## Here we use the previous version of automate_GEX to produce the identical UMAP seen in the manuscript.
covid_gex <- Platypus::automate_GEX(GEX.outs.directory.list = directory_to_covid_patients_integrated[1:1],integration.method = "scale.data",mito.filter = 20,cluster.resolution = 0.5,VDJ.gene.filter = T)

Seurat::DimPlot(covid_gex[[1]],reduction = "umap")
当然,后面还有标准的差异富集结果,大家应该都很了解,我们接下来看看VDJ的分析。
VDJ Repertoire anaylsis
读取数据
现在可以在集成 GEX 库之前分析 VDJ 曲目数据。 如果只对 VDJ 文库进行了测序而没有附带的基因表达数据,这可能很有用。 首先根据默认的 10x cellranger 克隆分型策略读取克隆型,并增加包含克隆型信息的数据帧中的克隆信息量。 第一步是在 cellranger vdj 的输出目录上使用 VDJ_analyze 函数。 可以删除较大的 BAM 文件以节省空间,因为当前管道不需要这些文件。
#Read in the directories
VDJ.out.directory.list <- list()
VDJ.out.directory.list[[1]] <- "~/Downloads/PlatypusTestData/Patient1_BCR/"
VDJ.out.directory.list[[2]] <- "~/Downloads/PlatypusTestData/Patient2_BCR/"

#Run VDJ_analyze
covid_vdj_repertoire_bcells <- Platypus::VDJ_analyze(VDJ.out.directory =VDJ.out.directory.list, filter.1HC.1LC = T)
VDJ_analyze 的输出包含各种信息,包括哪些条形码构成克隆家族,nt_clone_ids(以防使用 VDJ_clonotype 函数更改克隆分型方法)。 此外,每个克隆家族的多数种系基因是从重叠群文件中提取的。
Changing the clonotype strategy
考虑到体细胞超突变可能发生在 CDR3 区域,通常配对的核苷酸 CDRH3 和 CDRL3 克隆分型可能不是最佳策略。因此,可能存在高度相似的克隆,它们可能结合正式属于不同克隆家族的相同抗原。为了解决这个问题,我们添加了一个允许各种启发式克隆分型策略的函数。这涉及通过相同的氨基酸 CDRH3 + CDRL3 序列、相同的种系使用或序列同源性要求进行克隆分型。然后,这将通过使用用于克隆分型的新氨基酸(或其他策略)更新 clonotype_id 列来更新来自 VDJ_analyze 的原始克隆分型对象。同样,新的克隆家族决定因素可以在 new_unique_clone 中找到。在下面的例子中,new_unique_clone 将包含粘贴在一起的重链和轻链的氨基酸序列。如果通过更改克隆分型策略合并多个核苷酸克隆,则可以在“条形码”列中找到它们的条形码。
covid_vdj_aminoacid_clonotype <- Platypus::VDJ_clonotype(clonotype.list=covid_vdj_repertoire_bcells,
                                                         clone.strategy = "cdr3.aa")

covid_vdj_germline_clonotype <- Platypus::VDJ_clonotype(clonotype.list=covid_vdj_repertoire_bcells,
                                                         clone.strategy = "hvj.lvj")
We can see that the clonotype_id column now contains the new ids based on this clonotyping strategy. We can always recover the nucleotide ids by looking at the nt_clones_ids.
Getting clonal information at the level of the single cell
到目前为止,这些函数都处于克隆水平,因此忽略了可能在克隆家族中有所不同的细胞特定特征,例如同种型、序列变异等。 VDJ_per_clone 函数将通过返回嵌套列表来提供此信息,其中外部list 元素对应于曲目(例如,list[[1]] 是第一个目录,作为 VDJ_analyze 函数的输入)。内部列表元素对应于每个克隆的数据帧。在此数据框中,可以提取诸如重链和轻链的种系基因使用等信息(例如,HC_Vgene 是抗体 IGH 的 V 基因或 T 细胞 TRB 的 V 基因)。此外,可以根据 cellranger 的输出提取每个细胞条形码的重链和轻链的完整序列。一个问题是从 cellranger 的 fasta 文件返回的序列超出了 FR1 到 FR4 区域(例如恒定区、信号肽),这可能对下游实验验证/表达造成问题。germline序列也会发生同样的情况 - 再次由 cellranger 确定。germline信息可以在内部列表元素的 full_HC_germline 和 full_LC_germline 列中找到。要获得可克隆的 B/TCR 序列,可以继续使用 call_MIXCR 函数或导出序列并使用不同的比对工具。
covid_single_cell <- Platypus::VDJ_per_clone(clonotype.list = covid_vdj_repertoire_bcells,VDJ.out.directory =VDJ.out.directory.list)

covid_single_clone_tcells <- Platypus::VDJ_per_clone(clonotype.list = covid_vdj_repertoire_tcells,VDJ.out.directory =VDJ.out.directory.list_TCR)
Extracting full-length sequences from the VDJRegion
为了量化体细胞变异的数量或提取用于表达的全长序列,从框架区 1 (FR1) 到框架区 4 (FR4) 的核苷酸序列通常很有用。使用 call_MIXCR 函数,可以将全长 VDJRegion 序列添加到克隆信息中,然后轻松提取。此功能适用于 UNIX/Mac,此外还要求 mixcr 已在本地下载(有许可协议)。只需在 call_MIXCR 函数中为可执行文件提供目录,如下所示。分别用于小鼠和人类的“mmu”或“hsa”。同样,格式与输入类似,其中外部列表对应于单个曲目,内部列表是具有各种信息的数据帧,包括全长 VDJ 序列(例如,VDJ.AA.LC 和 VDJ.AA .HC 表示轻链和重链氨基酸序列)。人们会注意到生殖系序列仍然很长(例如,在下面的示例中,“full_HC_germline”长度超过 600 个核苷酸)。这将使用单独的函数 VDJ_extract_germline 填充。
### WARNING: You will need to download MiXCR and change the mixcr.directory to the location of MiXCR
covid_vdj_region <- Platypus::call_MIXCR(VDJ.per.clone = covid_single_cell,mixcr.directory = "~/Downloads/mixcr-3.0.12/mixcr",species = "hsa")
Extracting full-length germline sequence corresponding to the VDJRegion
提取germline column 可以使用 VDJ_extract_germline 来完成,它采用由 cellranger 确定的germline column 。 输出包含给定的数据帧格式的所有种系序列。 原始克隆型标识符可以在 descrR1 列中找到repertoire。
extracted_covid_germline <- Platypus::VDJ_extract_germline(VDJ.per.clone=covid_single_cell,mixcr.directory="~/Downloads/mixcr-3.0.12/mixcr",extract.VDJRegion=T,species = "hsa")
Extracting trimmmed VDJ region sequence and germline
在 all_contig_annotations.json 文件可用的情况下,函数 VDJ_per_clone 额外提供修剪过的 VDJ 序列和相应的修剪过的种系序列。 这对于计算克隆型中单细胞的 VDJ 区域的体细胞超突变率非常有用。 名为“full_seq_”、“sequence_”和“trimmed_ref_”的列代表从cellranger的fasta文件返回的序列,在VDJ区域修剪的序列,在VDJ区域修剪的生殖系序列(后面是HC for Heavy Chain 和轻链的 LC)。 此数据不需要 MiXCR 对齐,但是,它不一定从 Framework1 开始,因此如果未来计划涉及克隆 BCR/TCR,请谨慎使用。 已经对此进行了注释,因为当时测试数据不包括 JSON 文件。
#covid_single_clone_with_JSON <- VDJ_per_cell(clonotype.list = covid_vdj_repertoire_bcells,VDJ.out.directory =VDJ.out.directory.list,JSON = T)

# covid_single_cell was the object from VDJ_per_clone

#print(covid_single_clone_with_JSON[[1]][[1]]$trimmed_HC_sequence[1])  # trimmmed sequence
#print(covid_single_clone_with_JSON[[1]][[1]]$trimmed_HC_germline[1])  # trimmmed germline sequence

#stringdist::stringdist(covid_single_clone_with_JSON[[1]][[1]]$sequence_HC[1], VDJ.per.cell[[1]][[1]]$trimmed_ref_HC[1])
Organizing full-length sequences into clonal lineages easily exportable for phylogenetics.
在提取germline序列和全长 VDJRegion 序列后,我们可以结合这些信息并将序列分组为克隆谱系,这些谱系可以单独导出用于下游系统发育学,或导入 Platypus 中的 VDJ_tree 函数。 输出列表类似于其他 VDJ 函数的输出,其中外部列表元素对应于曲目,内部列表元素对应于各个克隆/克隆家族。 此处重链和轻链已粘贴在一起,但如果您想将它们分开,可以在 VDJ_extract_germline 函数的输出中找到该信息。 例如,上面 VDJ_extract_germline 函数的输出是extracted_covid_germline[[1]][[1]]$VDJ.AA.HC.LC[2]。 在这个序列中,重链和轻链序列的末端有一个“”。所以可以将“”处的字符串分开,并使用这个序列来创建系统发育树。
covid_clonal_lineages <- Platypus::VDJ_clonal_lineages(call_MIXCR.output=covid_vdj_region, VDJ_extract_germline.output=extracted_covid_germline,as.nucleotide=F,with.germline=T)
Neighbor-joining phylogenetic trees
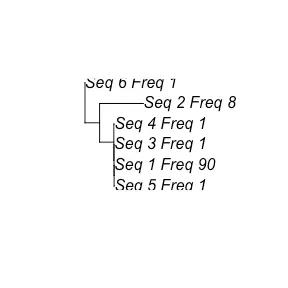
VDJ_clonal_lineage 函数的输出可用作 VDJ_tree 的输入,以生成快速、相邻的系统发育树。 考虑 VDJRegion(或来自 10x 的序列已被修剪)很重要,因为此函数不涉及多字符串对齐 - 而是从所有序列创建距离矩阵。 可以指定独特序列的最小数量(例如,如果克隆谱系中有 50 个细胞,但只有一个独特的抗体序列,则不会生成此树)。 类似地,可以指定最大序列数,这将导致从所有序列中随机采样。 绘制第一棵树,可以看到有一个变体(名为 Seq_1)有 90 个细胞(由 Freq_90 看到)并且它非常接近生殖系(Seq_6_Freq_1)。 我们知道它是种系,因为它是最高序列的变体,它被设置为根。
covid_trees <- Platypus::VDJ_tree(clonal.lineages = covid_clonal_lineages,with.germline=T,min.sequences = 5,max.sequences = 30,unique.sequences = T)
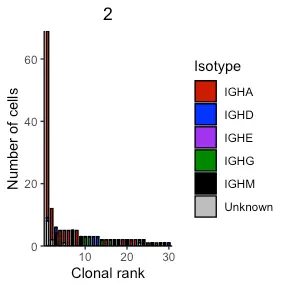
Plotting per-cell isotype information
其他 VDJ 功能包括绘制每个克隆的同种型分布。 这可以通过 VDJ_isotypes_per_clone 函数并设置要显示的克隆数来执行。 以下代码提取并绘制了前 30 个克隆的同种型分布。 当使用默认的克隆分型策略时,可以看到第一个患者的前四个克隆中大部分有明确的 IgA 同种型。 还可以使用新的克隆分型策略来比较克隆定义的变化如何影响克隆扩增谱。 只是提供 VDJ_clonotype 的输出。
covid_isotypes <- Platypus::VDJ_isotypes_per_clone(VDJ_clonotype_output = covid_vdj_repertoire_bcells, VDJ_per_clone_output = covid_single_cell, clones = 30)

covid_isotypes_aa_clonotype <- Platypus::VDJ_isotypes_per_clone(VDJ_clonotype_output = covid_vdj_germline_clonotype, VDJ_per_clone_output = covid_single_cell, clones = 30)

covid_isotypes_germline_clonotype <- Platypus::VDJ_isotypes_per_clone(VDJ_clonotype_output = covid_vdj_aminoacid_clonotype, VDJ_per_clone_output = covid_single_cell, clones = 30)

print(covid_isotypes[[1]])
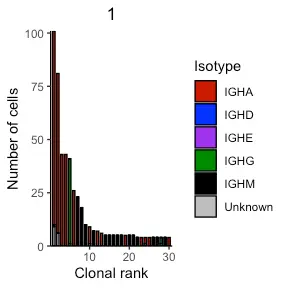
In the second patient (second repertoire entered in original VDJ_analyze) we also see a similarly expanded IgA clone with over 60 cell barcodes.
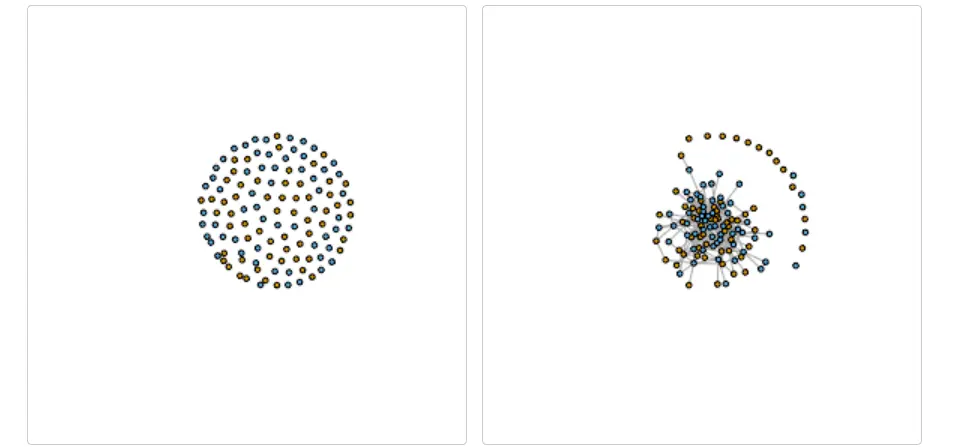
Sequence similarity networks
其他功能是专门为库分析量身定制的 - 例如 VDJ_network,它通过将具有序列相似性的克隆连接起来,在库之间或库内创建序列相似性网络。 该函数依赖 igraph 来可视化地显示和构建图形——这意味着具有大量序列的网络将不容易显示。 在以下示例中,从 VDJ_analyze 的输出中取出前 60 个扩展最多的克隆,并将其用作网络构建函数的输入。 将 per.mouse 参数设置为 false 表示应该为多个曲目生成一个网络。
## Take the output from VDJ_analyze (or subsample as in this case the top 60 clones)
network_clones_covid <- list()
network_clones_covid[[1]] <- covid_vdj_repertoire_bcells[[1]][1:60,]
network_clones_covid[[2]] <- covid_vdj_repertoire_bcells[[2]][1:60,]
network_clones_covid <- list()
network_clones_covid[[1]] <- covid_vdj_repertoire_tcells[[1]][1:60,]
network_clones_covid[[2]] <- covid_vdj_repertoire_tcells[[2]][1:60,]

covid_bcell_igraph <- Platypus::VDJ_network(network_clones_covid[1:2],per.sample = F,distance.cutoff = 10,connected = F)
covid_bcell_igraph_d14 <- Platypus::VDJ_network(network_clones_covid[1:2],per.sample = F,distance.cutoff = 14,connected = F)

igraph::plot.igraph(covid_bcell_igraph[[4]],vertex.label=NA,vertex.size=7+(.06*covid_bcell_igraph[[2]]$frequency),vertex.color=factor(covid_bcell_igraph[[2]]$mouse))
igraph::plot.igraph(covid_bcell_igraph_d14[[4]],vertex.label=NA,vertex.size=7+(.06*covid_bcell_igraph_d14[[2]]$frequency),vertex.color=factor(covid_bcell_igraph_d14[[2]]$mouse))
Germline gene usage heatmaps
还可以在重链 V 基因和轻链 V 基因的背景下生成种系基因使用的热图。 VDJ_Vgene_usage 函数的输出是每个曲目的矩阵,对应于 VDJ_analyze 指定的顺序。 外表对应样本,内表对应矩阵,行对应重链V基因,列对应V基因轻链。 因此,输出[[1]][i,j] 对应于使用 IGH-Vgene[i] 和 IGK/L-Vgene[j] 组合的克隆数。
#First calculate adjacency matrix for V gene usage
covid_Vgene_usage <- Platypus::VDJ_Vgene_usage(VDJ.clonotype.output = covid_vdj_repertoire_bcells)
library(pheatmap)

pheatmap::pheatmap(covid_Vgene_usage[[1]],show_rownames = F,show_colnames = F)
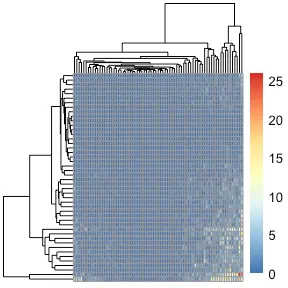
然后可以轻松地将其绘制为热图以观察曲目之间的模式,或者可用于使用“pheatmap”包计算 V 基因相关性。
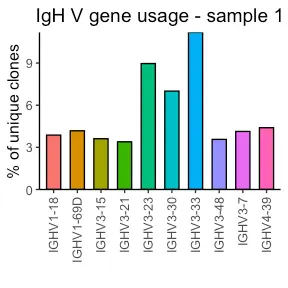
Platypus 还允许单独分析 HC 和 LC 的 V 基因使用情况。 VDJ_Vgene_usage_barplot 允许用户绘制最常用的 IgH 或 IgK/LV 基因。 默认情况下,此功能仅提供 HC V 基因的可视化,但如果是 LC,也可以提供 LC。 Vgene 设置为 TRUE。 还可以选择要描绘的最常用基因的数量。
covid_Vgene_usage_barplot <- Platypus::VDJ_Vgene_usage_barplot(covid_vdj_repertoire_bcells, HC.gene.number = 10, LC.Vgene = T, LC.gene.number = 10)
print(covid_Vgene_usage_barplot[[1]])
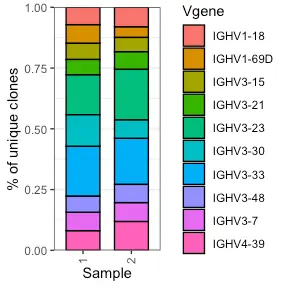
example.vdj.vgene_usage <- Platypus::VDJ_Vgene_usage_stacked_barplot(clonotype.list = covid_vdj_repertoire_bcells, LC.Vgene = F,HC.gene.number = 10, Fraction.HC = 1)
example.vdj.vgene_usage[[1]]
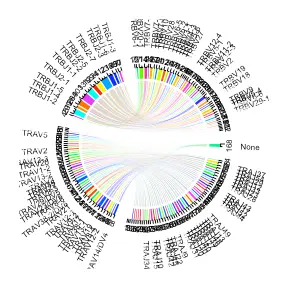
此外,我们还可以生成 V 和 J 基因如何在整个曲目中组合的圆形可视化。 在接下来的示例中,我们使用 VDJ_VJ_usage_circos 来查看每个扩展克隆型的 V 基因和相应的 J 基因。
vj_circos_bcells <- Platypus::VDJ_VJ_usage_circos(covid_vdj_repertoire_bcells[2:2], c.threshold = 1,label.threshold=50,cell.level = T)
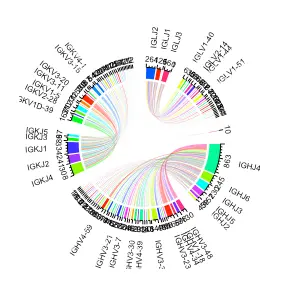
vj_circos_tcells <- Platypus::VDJ_VJ_usage_circos(covid_vdj_repertoire_tcells[1:1], c.threshold = 1,label.threshold=50,cell.level = T)
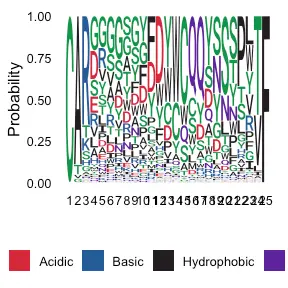
Assessing CDR3 sequence similarity
最后,还可以查看不同克隆中出现的任何特定 HC 和 LC CDR3 氨基酸模式。 使用 VDJ_logoplot 函数,用户可以绘制特定长度的 CDR3 区域的徽标图,由 length_cdr3 参数指定。 例如,下面的标志图对应于所有长度为 25 的 CDR3 氨基酸序列
covid_CDR3_logoplot <- Platypus::VDJ_logoplot(VDJ.object = covid_vdj_repertoire_bcells, length_cdr3 = 25)
Integrating repertoire and gene expression
当前 5' 测序的优势在于基因表达 (GEX) 和库 (VDJ) 库是从同一样本中提取的,然后可以将其链接回以证明给定的 T 细胞具有特定的基因表达模式和 还有某种T细胞受体序列。 以下函数旨在整合这两条信息。
Integrating transcriptional clusters to the VDJ objects
可能会问的一件事是给定克隆家族中的 B 或 T 细胞在转录水平上有多相似。 我们可以做到这一点的一种方法是利用在automatic_GEX 函数中执行的转录聚类,然后将此信息提供给曲目信息。 这可以在克隆级别(例如,以 VDJ_analyze 的输出格式)或单元级别(例如,以 VDJ_per_clone 的输出格式)完成。 下面是克隆水平的例子。 输出与 VDJ_analyze 输出相同,除了现在有对应于多数转录组簇的列(例如,如果克隆中的大多数细胞在簇 1 中,则该列的值为 1)。 在此旁边有一个列,告诉您该克隆中所有单元格的群集百分比。 最后,GEX 对象中有单元格索引,因此您可以查看 GEX 对象中找到了哪些单元格并可以显式调用它们。
covid_integrating_clonal_level <- Platypus::VDJ_GEX_integrate(GEX.object = covid_gex[[1]],
                                                 clonotype.list =  covid_vdj_repertoire_bcells,
                                                 VDJ.per.clone = covid_single_cell,
                                                 clonotype.level = TRUE)
covid_integrating_clonal_level_tcell <- Platypus::VDJ_GEX_integrate(GEX.object = covid_gex[[1]],
                                                 clonotype.list =  covid_vdj_repertoire_tcells,
                                                 VDJ.per.clone = covid_single_cell,
                                                 clonotype.level = TRUE)

covid_integrating_cell_level <- Platypus::VDJ_GEX_integrate(GEX.object = covid_gex[[1]],
                                                 clonotype.list =  covid_vdj_repertoire_bcells[1:1],
                                                 VDJ.per.clone = covid_single_cell[1:1],
                                                 clonotype.level = FALSE)
Relating clonal expansion to transcriptional cluster membership
VDJ_GEX_expansion 函数采用先前集成的 VDJ 和 GEX 数据集,然后绘制指定克隆的转录簇成员分布。 在下面的示例中,绘制了前 20 个克隆及其集群成员的分布。
covid_clonotype_clusters_plot <-  Platypus::VDJ_GEX_expansion(GEX.list=covid_gex[[1]],
                                                              VDJ.GEX.integrate.list = covid_integrating_clonal_level,
                                                              highlight.isotype = "None",
                                                              highlight.number=1:10)
covid_clonotype_clusters_plot_tcells <-  Platypus::VDJ_GEX_expansion(GEX.list=covid_gex[[1]],
                                                              VDJ.GEX.integrate.list = covid_integrating_clonal_level_tcell,
                                                              highlight.isotype = "None",
                                                              highlight.number=1:10)
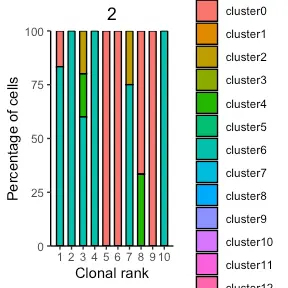
We see that some clones did not have any barcodes overlapping between the GEX and VDJ data sets for this particular patient and therefore there is no bar at that given clonal index on the X axis.
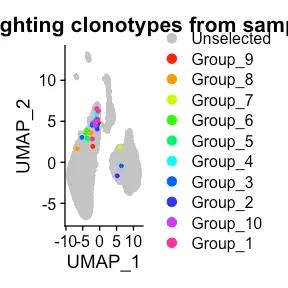
Visualizing clones on the 2 dimensional landscape
我们想要在我们之前使用 automatic_GEX 计算的 tSNE/UMAP 空间上覆盖克隆,这可以使用visualize_clones_GEX 函数来完成。 以下代码将在使用automation_GEX 函数计算的 UMAP 空间上覆盖前 10 个克隆。 该组对应于克隆顺序 - 例如,组 1 是集成 VDJ 列表中的第一个克隆家族。 在这里我们可以看到 T 细胞簇中有几个细胞,这表明在细胞捕获过程中存在双胞胎,因为在这个实验中,B 和 T 细胞汇集在一个反应中。
covid_top10_umap <- Platypus::GEX_visualize_clones(GEX.list=covid_gex,
                     VDJ.GEX.integrate.list=covid_integrating_clonal_level_tcell[2:2],
                     highlight.type="clonotype",
                     highlight.number=1:10,
                     reduction="umap")
print(covid_top10_umap[[1]])
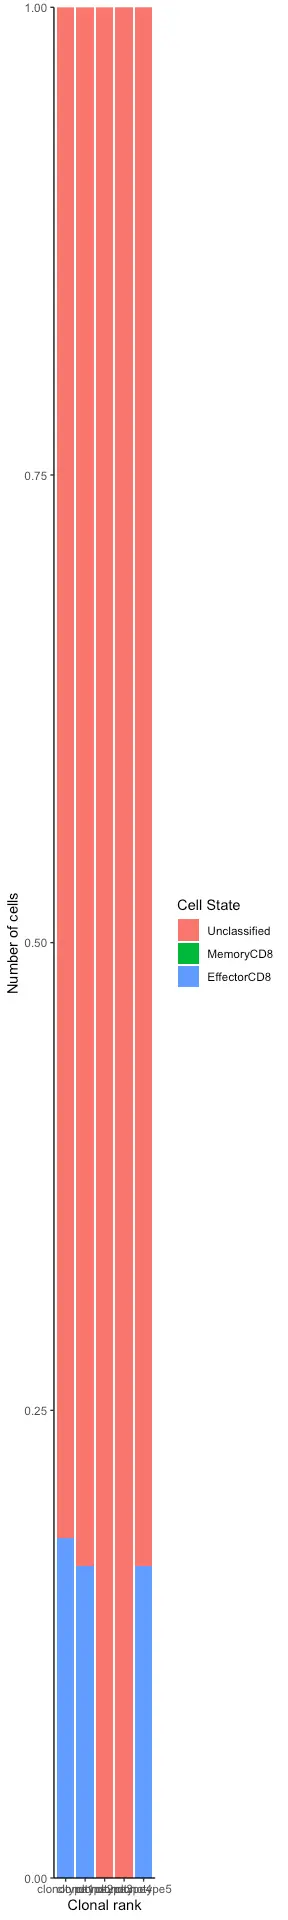
Specific gene expression information on the clonal level
之前将 GEX 信息集成到 VDJ 输出的格式中。 然而,可能想知道基因表达如何寻找某些克隆型(例如,顶级克隆中有多少细胞表达 Fas/GL7 或生发中心细胞标记)。 因此,需要将 VDJ 信息和条形码集成到 GEX 对象中。 这可以通过使用 clonotype_GEX 函数和 GEX_heatmap 函数来完成。 为了节省空间,可以将此函数的输出分配给原始的automatic_GEX 输出,因为它将是另一个 Seurat 对象。 通过将 b.or.t 设置为“b”,将显示一组预先选择的 B 细胞基因。 还可以提供定制基因来测试特定的克隆型。 组/列颜色对应于给定的克隆家族。
covid_gex_integrate <- Platypus::GEX_clonotype(GEX.object=covid_gex[[1]],VDJ.per.clone = covid_single_clone_tcells)
covid_gex_integrate_bcells <- Platypus::GEX_clonotype(GEX.object=covid_gex[[1]],VDJ.per.clone = covid_single_cell)
GEX_phenotype_per_clone_plot <- Platypus::GEX_phenotype_per_clone(seurat.object = covid_gex_integrate, clonotype.ids= c(1,2,3,4,5))
print(GEX_phenotype_per_clone_plot)
covid_tcell_gene_heatmap <- Platypus::GEX_heatmap(covid_gex_integrate,b.or.t = "t",clone.rank.threshold = 20,sample.index = 1)

covid_bcell_gene_heatmap <- Platypus::GEX_heatmap(covid_gex_integrate_bcells,b.or.t = "b",clone.rank.threshold = 20,sample.index = 1)
Integrating clonal lineage information and transcriptional cluster information
我们可以将转录簇信息提供到更早组织的克隆谱系中。 这可以使用 VDJ_GEX_clonal_lineage_clusters 函数来完成,该函数会将转录簇信息放入 clonal_lineage 对象的名称中。 由于只在 covid_integrating_cell_level 对象中整合了第一个患者,因此将只获取第一批患者的克隆谱系。 现在,如果打印第一个克隆谱系中第一个序列的名称,会看到一个 cluster5 已添加到名称的末尾。 这表明这个特定的 B 细胞是在原始自动化 GEX 的 cluster5 中发现的。
clonal_lineage_integrate <- Platypus::VDJ_GEX_clonal_lineage_clusters(covid_integrating_cell_level,covid_clonal_lineages[1:1])
最后再强调一句,一定要关注VDJ的氨基酸序列
生活很好,有你更好


 被折叠的 条评论
为什么被折叠?
被折叠的 条评论
为什么被折叠?
 到【灌水乐园】发言


