


隔离的第四天,一个人的日子总是很难熬,孤独的生活却总是来到我的身边,这一篇我们来分享EcoTyper的示例代码,帮助我们来寻找细胞特异性转录状态和共关联模式。这篇发表于cell的软件,文献的分享在10X单细胞空间数据分析之表征细胞状态和生态型(EcoTyper),我们来看看软件的具体使用方法,当然了,我们更加关注单细胞和空间数据的部分
EcoTyper 是一个机器学习框架,用于从bulk和单细胞 (scRNA-seq) 表达数据中大规模识别细胞类型特异性转录状态及其共关联模式。
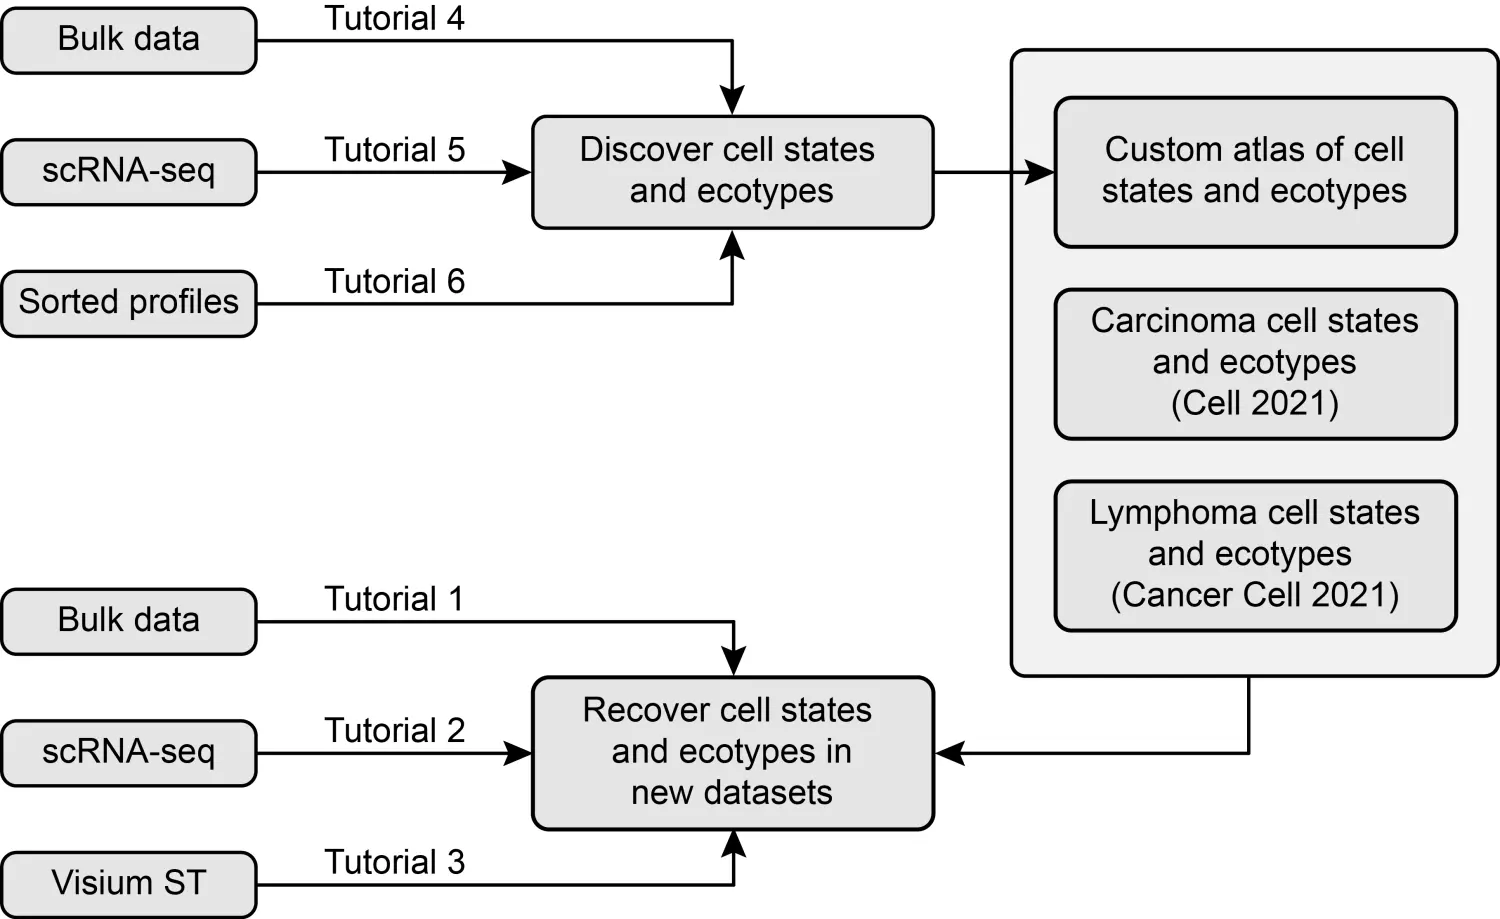
软件本身已经定义了癌症(Luca/Steen 等人,Cell 2021)和弥漫性大 B 细胞淋巴瘤(DLBCL)(Steen/Luca 等人,Cancer Cell 2021)中的细胞状态和生态型。 当前版本的 EcoTyper 允许用户在他们自己的数据中恢复这两种肿瘤类别的细胞状态和生态型。 此外,它允许用户在他们感兴趣的系统中发现和恢复细胞状态和生态型,包括直接从 scRNA-seq 数据中恢复。
安装EcoTyper
wget https://github.com/digitalcytometry/ecotyper/archive/refs/heads/master.zip
unzip master.zip
cd ecotyper-master
Basic resources
下面列出的 R 包是运行 EcoTyper 所必需的。 版本号表示用于开发和测试 EcoTyper 代码的包版本。 其他 R 版本也可能工作:
- R (v3.6.0 and v4.1.0).
- R packages: ComplexHeatmap (v2.2.0 and v2.8.0), NMF (v0.21.0 and v0.23.0), RColorBrewer (v1.1.2), cluster (v2.1.0 and v2.1.2)), circlize (v0.4.10 and v0.4.12), cowplot (v1.1.0 and v1.1.1), data.table (base package R v3.6.0 and v4.1.0), doParallel (v1.0.15 and v1.0.16), ggplot2 (v3.3.2, v3.3.3), grid (base package R v3.6.0 and v4.1.0), reshape2 (v1.4.4), viridis (v0.5.1 and v0.6.1), config (v0.3.1), argparse (v2.0.3), colorspace (v1.4.1 and v2.0.1), plyr (v1.8.6).
这些包与预先存储在 EcoTyper 文件夹中的其他资源一起,允许:
- 在自己的bulk RNA-seq、微阵列和 scRNA-seq 数据中执行先前定义的细胞状态和生态型的恢复 .
- perform cell state and ecotype discovery in scRNA-seq and pre-sorted cell type-specific profiles
当然了,我们关注单细胞和空间数据的分析
When the input is scRNA-seq or bulk-sorted cell type-specific profiles (e.g., FACS-purified), EcoTyper performs the following major steps for discovering cell states and ecotypes:
- Gene filtering: This step filters out genes that do not show cell type specificity.
- Cell state discovery: This step enables identification and quantitation of cell type-specific transcriptional states.
- Ecotype discovery: This step enables co-assignment of cell states into multicellular communities (ecotypes).
无论用于导出细胞状态和生态型的输入类型如何,EcoTyper 都可以在外部表达数据集中执行细胞状态和生态型恢复。 可以bulk、scRNA-seq 和空间转录组数据进行恢复。
我们来看看示例,提供的 scRNA-seq 数据中恢复细胞状态和生态型
EcoTyper 预装了用户提供的 scRNA-seq 数据中先前在癌症和淋巴瘤中定义的细胞状态和生态型的参考指导恢复所需的资源。
我们先来看看主脚本EcoTyper_recovery_scRNA.R
suppressPackageStartupMessages({
library(argparse)
source("pipeline/lib/config.R")
source("pipeline/lib/multithreading.R")
})

parser <- ArgumentParser(add_help = F)

arguments = parser$add_argument_group('Arguments')

arguments$add_argument("-d", "--discovery", type="character", default="Carcinoma",
    help=paste0("The name of the discovery dataset used to define cell states and ecotypes. Accepted values: ",
    "'Carcinoma' will recover the cell states and ecotypes defined across carcinomas, as described in the EcoTyper carcinoma paper, ",
    "'Lymphoma' will recover the cell states and ecotypes defined in diffuse large B cell lymphoma (DLBCL), as described in the EcoTyper lymphoma paper, ",
    "'<MyDiscovery>' the value used in the field 'Discovery dataset name' of the config file used for running EcoTyper discovery ('EcoTyper_discovery.R') script. ",
    "[default: '%(default)s']"),
    metavar="<character>")
arguments$add_argument("-m", "--matrix", type = "character", metavar="<PATH>",
    help="Path to a tab-delimited file containing the input scRNA-seq expression matrix, with gene names on the first column and cell ids as column names [required].")
arguments$add_argument("-a", "--annotation", type = "character",  metavar="<PATH>",
    help="Path to a tab-delimited annotation file containing the annotation of cells in the input matrix. This file should contain at least two columns, 'ID' with the same values as the columns of the expression matrix, and 'CellType' (case sensitive) which contains the cell type for each cell. These values are limited to the set of cell types analyzed in the discovery dataset. If the argument '-d' is set to 'Carcinoma', then the accepted values for column 'CellType' are: 'B.cells', 'CD4.T.cells', 'CD8.T.cells', 'Dendritic.cells', 'Endothelial.cells', 'Epithelial.cells', 'Fibroblasts', 'Mast.cells', 'Monocytes.and.Macrophages', 'NK.cells', 'PCs' and 'PMNs'. If the argument '-d' is set to 'Lymphoma', then the accepted values for column 'CellType' are: 'B.cells', 'Plasma.cells', 'T.cells.CD8', 'T.cells.CD4', 'T.cells.follicular.helper', 'Tregs', 'NK.cells', 'Monocytes.and.Macrophages', 'Dendritic.cells', 'Mast.cells', 'Neutrophils', 'Fibroblasts', 'Endothelial.cells'. All other values will be ignored for these two cases. Additionally, this file can contain any number of columns, that can be used for plotting color bars in the output heatmaps (see argument '-c'). [required]")
arguments$add_argument("-c", "--columns",  type = "character",  metavar="<character>", default="NULL",
    help="A comma-spearated list of column names from the annotation file to be plotted as color bar in the output heatmaps. [default: '%(default)s']")
arguments$add_argument("-z", "--z-score",  type = "character",  metavar="<bool>", default="FALSE",
    help="A flag indicating whether the significance quantification procedure should be run. Note that this procedure might be slow, as the NMF model is applied 30 times on the same dataset. [default: '%(default)s']")
arguments$add_argument("-s", "--subsample",  type = "integer",  metavar="<integer>", default=-1,
    help="An integer specifying the number of cells each cell type will be downsampled to. For values <50, no downsampling will be performed. [default: '%(default)s' (no downsampling)]")
arguments$add_argument("-t", "--threads",  type = "integer",  metavar="<integer>", default=10,
    help="Number of threads. [default: '%(default)s']")
arguments$add_argument("-o", "--output", type = "character",  metavar="<PATH>", default="RecoveryOutput",
    help="Output directory path. [default: '%(default)s']")
arguments$add_argument("-h", "--help", action='store_true', help="Print help message.")


args <- parser$parse_args()
#print(args)
if(is.null(args$matrix))
{
    parser$print_help()
    quit()
}

input_mat = normalizePath(args$matrix)
discovery = args$discovery
annotation_path = normalizePath(args$annotation)
columns = args$columns
z_flag = as.logical(args$z)
n_threads = as.numeric(args$threads)
subsample = as.integer(args$subsample)

if(!file.exists(input_mat))
{
    stop("Error: Path to the input expression matrix does not exist!")
}

if(!discovery %in% c("Carcinoma", "Lymphoma"))
{
    config_file = file.path("EcoTyper", discovery, "config_used.yml")
    if(!file.exists(config_file))
    {
        stop("Error: Cannot read the config file used for the discovery of cell states and ecotypes. It should be in the following path: '", config_file, "'. Please make sure that the '--discovery (-d)' argument provided is correct!")
    }
    config <- config::get(file = config_file)
    fractions = config$"Input"$"Cell type fractions"
    if(is.null(fractions))
    {
        if(config$"Pipeline settings"$"Filter non cell type specific genes")
        {
            fractions = "Cell_type_specific_genes"
        }else{
            fractions = "All_genes"
        }
    }else{
        if(!fractions %in% c("Carcinoma_Fractions", "Lymphoma_Fractions"))
        {
            fractions = "Custom"
        }
    }
}else{
    fractions = paste0(discovery, "_Fractions")
}

if(!file.exists(annotation_path))
{
    stop("Error: Path to the input annotation file does not exist!")
}else{
    annotation = read.delim(annotation_path)
    if(!all(c("ID", "CellType") %in% colnames(annotation)))
    {
        stop("Error: The annotation file provided, does not contain the columns 'ID' and 'CellType.")
    }

    if("Sample" %in% colnames(annotation))
    {
        recover_ecotypes = T

        ecotypes = read.delim(file.path("EcoTyper", discovery, fractions, "Ecotypes", "discovery", "ecotypes.txt"))
        disc_cell_types = table(ecotypes$CellType)
        rec_cell_types= table(annotation$CellType)
        if(length(rec_cell_types) * 2 >= length(disc_cell_types))
        {
            cat("The annotation file contains column 'Sample', and more than half of the cell types are present in the recovery dataset. Will perform ecotype recovery.\n")
        }else{
            cat("The annotation file contains column 'Sample', but less than half of the cell types are present in the recovery dataset. Will NOT perform ecotype recovery.\n")
        }

    }else{
        recover_ecotypes = F
        cat("The annotation file does not contain column 'Sample'. Will NOT perform ecotype recovery.\n")
    }

    if(columns != "NULL")
    {
        additional_columns = strsplit(columns, ",")[[1]]

        if(!all(additional_columns %in% colnames(annotation)))
        {
            stop(paste0("The following columns are missing from the annotation file provided: ", "'",
                paste(additional_columns[!additional_columns %in% colnames(annotation)], collapse = "'"), "'"))
        }
    }else{
        additional_columns = c()
    }
}

recovery = gsub(".tsv$", "", gsub(".txt$", "", basename(input_mat)))

input_dir = file.path("datasets", "scRNA", recovery)
dir.create(input_dir, recursive = T, showWarning = F)

dir.create(file.path(args$output, recovery), recursive = T, showWarnings = F)
final_output = normalizePath(file.path(args$output, recovery))

PushToJobQueue(paste0("ln -sf ", input_mat, " ", file.path(input_dir, "data.txt")))
RunJobQueue()
PushToJobQueue(paste0("ln -sf ", annotation_path, " ", file.path(input_dir, "annotation.txt")))
RunJobQueue()

start = Sys.time()
cur_dir = getwd()
setwd("pipeline")

key = read.delim(file.path("../EcoTyper", discovery, fractions, "Analysis", "rank_selection", "rank_data.txt"))
key = key[key[,1] %in% annotation$CellType,]
if(nrow(key) == 0)
{
    stop("Error: The column 'CellType' of the annotation file contains invalid values!")
}
for(cell_type in key[,1])
{
    n_states = key[key[,1] == cell_type, 2]
    PushToJobQueue((paste("Rscript state_recovery_scRNA.R", discovery, fractions, cell_type, n_states, recovery, z_flag, subsample, paste(additional_columns, collapse = " "))))
}
RunJobQueue()

if(recover_ecotypes)
{
    PushToJobQueue((paste("Rscript ecotypes_recovery_scRNA.R", discovery, fractions, recovery)))
    RunJobQueue()
}

cat("\nCopying EcoTyper results to the output folder...\n")

if(file.exists(final_output) && length(list.files(final_output)) > 0)
{
    old_results_folder = paste0(final_output, format(Sys.time(), " %a %b %d %X %Y"))
    dir.create(old_results_folder, recursive = T, showWarnings = F)
    warning(paste0("The output folder contains files from a previous run. Moving those files to: '", old_results_folder, "'"))
    system(paste0("mv -f ", final_output, "/* '", old_results_folder, "'"))
}

dir.create(final_output, recursive = T, showWarnings = F)

key = read.delim(file.path("../EcoTyper", discovery, fractions, "Analysis", "rank_selection", "rank_data.txt"))
key = key[key[,1] %in% annotation$CellType,]
for(cell_type in key[,1])
{
    n_clusters = key[key[,1] == cell_type, 2]
    ct_output = file.path(final_output, cell_type)
    dir.create(ct_output, recursive = T, showWarnings = F)

    system(paste("cp -f", file.path("../EcoTyper", discovery, fractions, "Cell_States", "recovery", "scRNA", recovery, cell_type, n_clusters, "state_assignment.txt"), ct_output))
    system(paste("cp -f", file.path("../EcoTyper", discovery, fractions, "Cell_States", "recovery", "scRNA", recovery, cell_type, n_clusters, "state_assignment_heatmap.pdf"), ct_output))
    system(paste("cp -f", file.path("../EcoTyper", discovery, fractions, "Cell_States", "recovery", "scRNA", recovery, cell_type, n_clusters, "state_assignment_heatmap.png"), ct_output))
    if(z_flag)
    {
        system(paste("cp -f", file.path("../EcoTyper", discovery, fractions, "Cell_States", "recovery", "scRNA", recovery, cell_type, n_clusters, "recovery_z_scores.txt"), ct_output))
    }
}

if(recover_ecotypes)
{
    ct_output = file.path(final_output, "Ecotypes")
    dir.create(ct_output, recursive = T, showWarnings = F)
    system(paste("cp -f", file.path("../EcoTyper", discovery, fractions, "Ecotypes", "recovery", recovery, "ecotype_assignment.txt"), ct_output))
    system(paste("cp -f", file.path("../EcoTyper", discovery, fractions, "Ecotypes", "recovery", recovery, "ecotype_abundance.txt"), ct_output))
    system(paste("cp -f", file.path("../EcoTyper", discovery, fractions, "Ecotypes", "recovery", recovery, "heatmap_assigned_samples_viridis.pdf"), ct_output))
    system(paste("cp -f", file.path("../EcoTyper", discovery, fractions, "Ecotypes", "recovery", recovery, "heatmap_assigned_samples_viridis.png"), ct_output))
}

end = Sys.time()
cat(paste0("\nEcoTyper finished succesfully! Please find the results in: '", final_output, "'.\nRun time: ", format(end - start, digits = 0), "\n"))
运行一下,
Rscript EcoTyper_recovery_scRNA.R -h
## usage: EcoTyper_recovery_scRNA.R [-d <character>] [-m <PATH>] [-a <PATH>]
##                                  [-c <character>] [-z <bool>] [-s <integer>]
##                                  [-t <integer>] [-o <PATH>] [-h]
##
## Arguments:
##   -d <character>, --discovery <character>
##                         The name of the discovery dataset used to define cell
##                         states and ecotypes. Accepted values: 'Carcinoma' will
##                         recover the cell states and ecotypes defined across
##                         carcinomas, as described in the EcoTyper carcinoma
##                         paper, 'Lymphoma' will recover the cell states and
##                         ecotypes defined in diffuse large B cell lymphoma
##                         (DLBCL), as described in the EcoTyper lymphoma paper,
##                         '<MyDiscovery>' the value used in the field 'Discovery
##                         dataset name' of the config file used for running
##                         EcoTyper discovery ('EcoTyper_discovery.R') script.
##                         [default: 'Carcinoma']
##   -m <PATH>, --matrix <PATH>
##                         Path to a tab-delimited file containing the input
##                         scRNA-seq expression matrix, with gene names on the
##                         first column and cell ids as column names [required].
##   -a <PATH>, --annotation <PATH>
##                         Path to a tab-delimited annotation file containing the
##                         annotation of cells in the input matrix. This file
##                         should contain at least two columns, 'ID' with the
##                         same values as the columns of the expression matrix,
##                         and 'CellType' (case sensitive) which contains the
##                         cell type for each cell. These values are limited to
##                         the set of cell types analyzed in the discovery
##                         dataset. If the argument '-d' is set to 'Carcinoma',
##                         then the accepted values for column 'CellType' are:
##                         'B.cells', 'CD4.T.cells', 'CD8.T.cells',
##                         'Dendritic.cells', 'Endothelial.cells',
##                         'Epithelial.cells', 'Fibroblasts', 'Mast.cells',
##                         'Monocytes.and.Macrophages', 'NK.cells', 'PCs' and
##                         'PMNs'. If the argument '-d' is set to 'Lymphoma',
##                         then the accepted values for column 'CellType' are:
##                         'B.cells', 'Plasma.cells', 'T.cells.CD8',
##                         'T.cells.CD4', 'T.cells.follicular.helper', 'Tregs',
##                         'NK.cells', 'Monocytes.and.Macrophages',
##                         'Dendritic.cells', 'Mast.cells', 'Neutrophils',
##                         'Fibroblasts', 'Endothelial.cells'. All other values
##                         will be ignored for these two cases. Additionally,
##                         this file can contain any number of columns, that can
##                         be used for plotting color bars in the output heatmaps
##                         (see argument '-c'). [required]
##   -c <character>, --columns <character>
##                         A comma-spearated list of column names from the
##                         annotation file to be plotted as color bar in the
##                         output heatmaps. [default: 'NULL']
##   -z <bool>, --z-score <bool>
##                         A flag indicating whether the significance
##                         quantification procedure should be run. Note that this
##                         procedure might be slow, as the NMF model is applied
##                         30 times on the same dataset. [default: 'FALSE']
##   -s <integer>, --subsample <integer>
##                         An integer specifying the number of cells each cell
##                         type will be downsampled to. For values <50, no
##                         downsampling will be performed. [default: '-1' (no
##                         downsampling)]
##   -t <integer>, --threads <integer>
##                         Number of threads. [default: '10']
##   -o <PATH>, --output <PATH>
##                         Output directory path. [default: 'RecoveryOutput']
##   -h, --help            Print help message.
参数解析:
-
-d/–discovery:用于定义细胞状态的发现数据集的名称。 默认情况下,唯一可接受的值是 Carcinoma 和 Lymphoma(区分大小写),它们将分别恢复我们已经在癌和淋巴瘤中定义的细胞状态。 如果用户在自己的数据中定义了细胞状态,则发现数据集的名称是用于运行细胞状态发现的配置文件的 Discovery dataset name 字段中提供的值。 在教程中,我们将发现数据集的名称设置为 Carcinoma。
-
-m/–matrix:输入 scRNA-seq 矩阵的路径。 scRNA-seq 表达矩阵应该是一个制表符分隔的文件,第一列是基因符号,下一列是细胞。 它应该有细胞标识符(例如条形码)作为列名,并且应该采用 TPM、CPM、FPKM 或任何其他合适的计数格式。 基因符号和细胞标识符应该是唯一的。 此外,我们建议列名不要包含由 R 函数 make.names 修改的特殊字符,例如 名称开头有数字或包含空格、制表符或 - 等字符。 本教程中使用的 CRC 癌症 scRNA-seq 数据如下所示:
data = read.delim("example_data/scRNA_CRC_data.txt", nrow = 5)
head(data[,1:5])
##      Gene SMC01.T_AAAGATGCATGGATGG SMC01.T_AAAGTAGCAAGGACAC
## 1    A1BG                        0                        0
## 2    A1CF                        0                        0
## 3     A2M                        0                        0
## 4   A2ML1                        0                        0
## 5 A3GALT2                        0                        0
##   SMC01.T_AAATGCCAGGATCGCA SMC01.T_AACTCTTCACAACGCC
## 1                        0                        0
## 2                        0                        0
## 3                        0                        0
## 4                        0                        0
## 5                        0                        0
- -a/–annotation:制表符分隔的注释文件的路径。该文件应至少包含两列:与表达式矩阵的列具有相同值的 ID,以及包含每个细胞的细胞类型的 CellType(区分大小写)。 CellType 列中的值应指示每个细胞的细胞类型。这些值仅限于发现数据集中分析的一组细胞类型。如果参数 -d/–discovery 设置为 Carcinoma,则接受的列 CellType 值为:'B.cells'、'CD4.T.cells'、'CD8.T 细胞”、“树突细胞”、“内皮细胞”、“上皮细胞”、“成纤维细胞”、“肥大细胞”、“单核细胞和巨噬细胞”、“NK细胞”、“PCs”和“ PMN'。如果参数 -d/–discovery 设置为 Lymphoma,则接受的 CellType 列值为:'B.cells'、'Plasma.cells'、'T.cells.CD8'、'T.cells.CD4'、 'T.cells.follicular.helper'、'Tregs'、'NK.cells'、'单核细胞和巨噬细胞'、'树突细胞'、'肥大细胞'、'中性粒细胞'、'成纤维细胞'、'内皮细胞。细胞'。对于这两种情况,所有其他值都将被忽略。注释文件可以包含一个名为 Sample 的列。如果此列存在,除了细胞状态恢复外,还将执行生态型恢复。此外,此文件可以包含任意数量的列,可用于在输出热图中绘制颜色条(请参阅参数 -c/–columns)。
data = read.delim("example_data/scRNA_CRC_annotation.txt")
head(data)
##                      Index Patient Class  Sample        Cell_type Cell_subtype
## 1 SMC01-T_AAAGATGCATGGATGG   SMC01 Tumor SMC01-T Epithelial cells         CMS2
## 2 SMC01-T_AAAGTAGCAAGGACAC   SMC01 Tumor SMC01-T Epithelial cells         CMS2
## 3 SMC01-T_AAATGCCAGGATCGCA   SMC01 Tumor SMC01-T Epithelial cells         CMS2
## 4 SMC01-T_AACTCTTCACAACGCC   SMC01 Tumor SMC01-T Epithelial cells         CMS2
## 5 SMC01-T_AACTTTCGTTCGGGCT   SMC01 Tumor SMC01-T Epithelial cells         CMS2
## 6 SMC01-T_AAGGTTCTCCAATGGT   SMC01 Tumor SMC01-T Epithelial cells         CMS2
##           CellType                       ID Tissue
## 1 Epithelial.cells SMC01.T_AAAGATGCATGGATGG  Tumor
## 2 Epithelial.cells SMC01.T_AAAGTAGCAAGGACAC  Tumor
## 3 Epithelial.cells SMC01.T_AAATGCCAGGATCGCA  Tumor
## 4 Epithelial.cells SMC01.T_AACTCTTCACAACGCC  Tumor
## 5 Epithelial.cells SMC01.T_AACTTTCGTTCGGGCT  Tumor
## 6 Epithelial.cells SMC01.T_AAGGTTCTCCAATGGT  Tumor
-
-c/–columns:注释文件中以逗号分隔的列名列表(请参阅参数 -a/–annotation),在输出热图中绘制为彩条。 默认情况下,输出热图包含每个细胞分配到的细胞状态标签作为颜色条。 此参数指示的列名称将添加到该颜色条中。
-
-z/–z-score:指示是否应运行显着性量化程序的标志(默认为 FALSE)。 此过程允许用户确定在给定数据集中是否显着恢复了细胞状态。 请注意,此过程可能非常缓慢,因为 NMF 模型在同一数据集上应用了 30 次。
-
-s/–subsample: An integer specifying the number of cells each cell type will be downsampled to. For values <50, no downsampling will be performed. Default: -1 (no downsampling).
-
-t/–threads: Number of threads. Default: 10.
-
-o/–output: Output folder. The output folder will be created if it does not exist.
运行一下单细胞数据
Rscript EcoTyper_recovery_scRNA.R -d Carcinoma -m example_data/scRNA_CRC_data.txt -a example_data/scRNA_CRC_annotation.txt -o RecoveryOutput
The outputs of this script include the following files, for each cell type provided:
- The assignment of single cells to states:
data = read.delim("RecoveryOutput/scRNA_CRC_data/Fibroblasts/state_assignment.txt")
head(data[,c("ID", "State")])
##                         ID State
## 1 SMC01.T_TGCGCAGTCGGATGGA   S01
## 2 SMC04.T_CACAAACTCTACTATC   S01
## 3 SMC15.T_GCGCGATTCATAAAGG   S01
## 4 SMC17.T_GTACGTAGTGACTACT   S01
## 5 SMC20.T_CTAAGACCACTGTCGG   S01
## 6 SMC20.T_GTTACAGTCGCGTTTC   S01
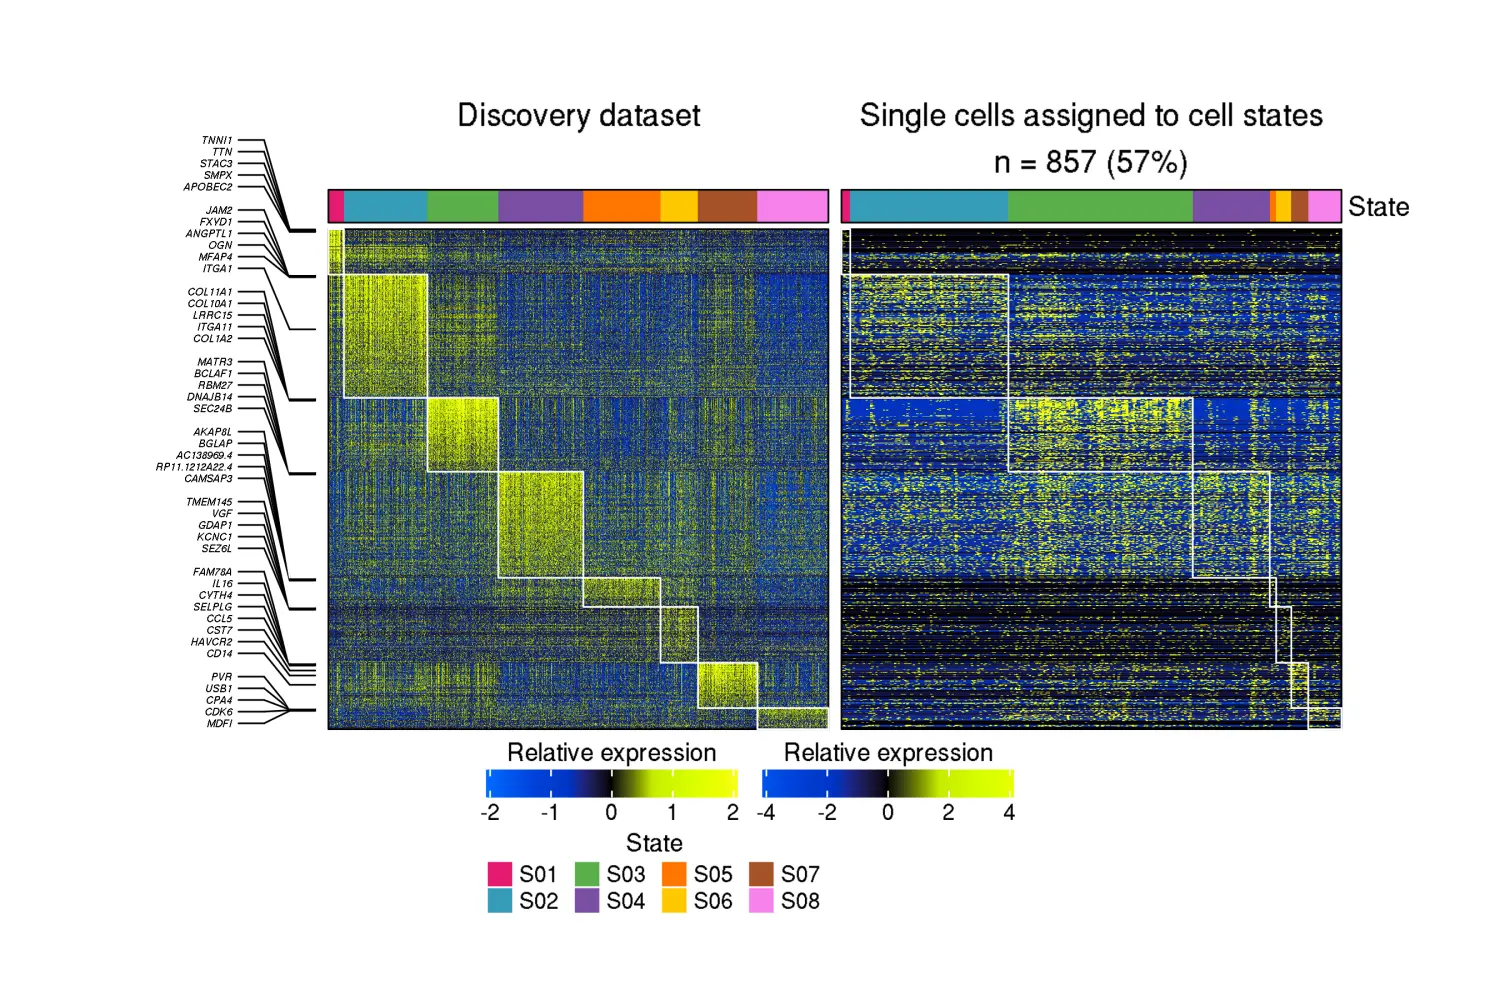
两个热图:一个表示发现数据集中细胞状态标记基因表达的热图,一个表示 scRNA-seq 数据集中相同标记基因表达的热图,经过平滑处理以减轻 scRNA-seq 丢失的影响:
knitr::include_graphics("RecoveryOutput/scRNA_CRC_data/Fibroblasts/state_assignment_heatmap.png")
如果应用统计显着性量化方法,则每个细胞状态的结果 z 分数将输出到同一目录中:
#data = read.delim("RecoveryOutput/scRNA_CRC_data/Epithelial.cells/recovery_z_scores.txt")
#head(data[,c("State", "Z")])
The output for ecotypes includes:
- The abundance (fraction) of each ecotype in each sample:
assign = read.delim("RecoveryOutput/scRNA_CRC_data/Ecotypes/ecotype_abundance.txt")
dim(assign)

## [1] 10 33
head(assign[,1:5])
##        SMC01.N     SMC01.T    SMC02.N    SMC02.T    SMC03.N
## CE1 0.03013608 0.151493627 0.10825504 0.21601181 0.02930968
## CE2 0.00000000 0.009612861 0.00000000 0.02671883 0.00000000
## CE3 0.05199290 0.077968658 0.21188075 0.07300246 0.00000000
## CE4 0.01693878 0.043794663 0.03124202 0.00000000 0.00000000
## CE5 0.06285928 0.022531963 0.01115162 0.06406829 0.03197420
## CE6 0.16508230 0.059542004 0.24436913 0.01855854 0.43445664
- The assignment of samples to the carcinoma ecotype with the highest abundance. If the cell state fractions from the dominant ecotype are not significantly higher than the other cell state fractions in a given sample, the sample is considered unassigned and filtered out from this table:
discrete_assignments = read.delim("RecoveryOutput/scRNA_CRC_data/Ecotypes/ecotype_abundance.txt")
dim(discrete_assignments)

## [1] 10 33
head(discrete_assignments[,1:5])
##        SMC01.N     SMC01.T    SMC02.N    SMC02.T    SMC03.N
## CE1 0.03013608 0.151493627 0.10825504 0.21601181 0.02930968
## CE2 0.00000000 0.009612861 0.00000000 0.02671883 0.00000000
## CE3 0.05199290 0.077968658 0.21188075 0.07300246 0.00000000
## CE4 0.01693878 0.043794663 0.03124202 0.00000000 0.00000000
## CE5 0.06285928 0.022531963 0.01115162 0.06406829 0.03197420
## CE6 0.16508230 0.059542004 0.24436913 0.01855854 0.43445664
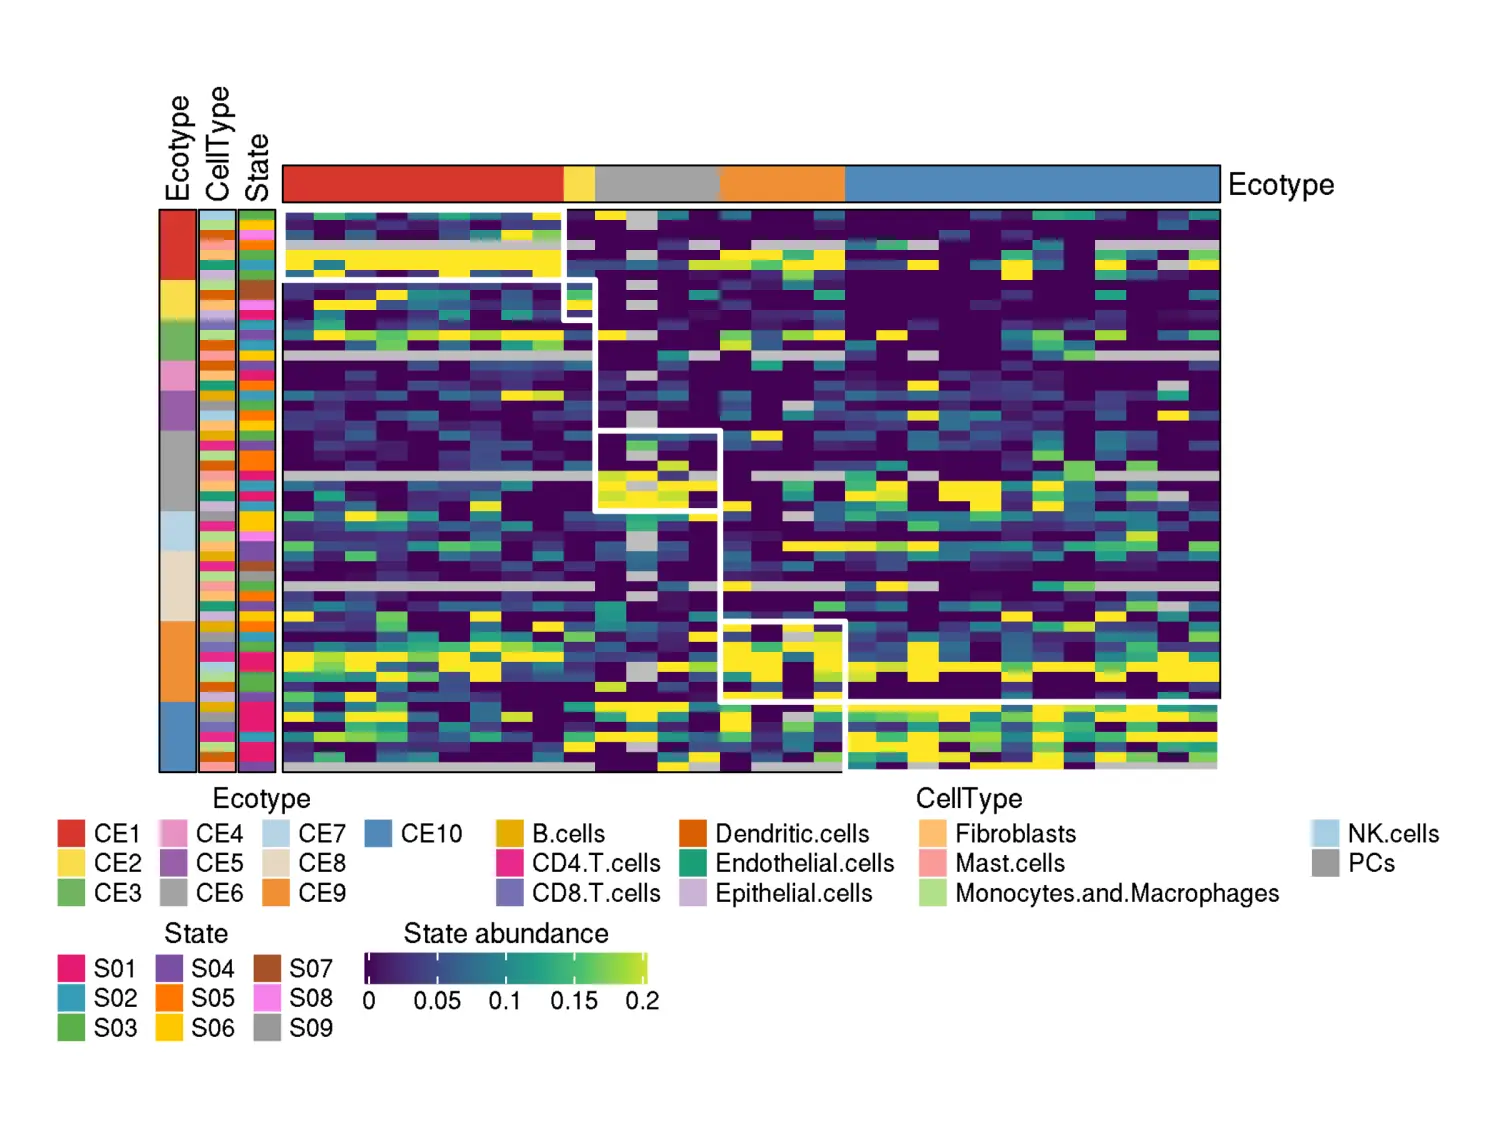
- A heatmap of cell state abundances across the samples assigned to ecotypes. Rows correspond to the cell states forming ecotypes, while columns correspond to the samples assigned to ecotypes:
knitr::include_graphics("RecoveryOutput/scRNA_CRC_data/Ecotypes/heatmap_assigned_samples_viridis.png")
示例2,Recovery of Lymphoma Cell States and Ecotypes in scRNA-seq Data
Rscript EcoTyper_recovery_scRNA.R -d Lymphoma -m example_data/scRNA_lymphoma_data.txt -a example_data/scRNA_lymphoma_annotation.txt -o RecoveryOutput -c Tissue
- 输出The assignment of single cells to states:
data = read.delim("RecoveryOutput/scRNA_lymphoma_data/B.cells/state_assignment.txt")
head(data[,c("ID", "State")])
##       ID State
## 1 Cell_2   S01
## 2 Cell_3   S01
## 3 Cell_4   S01
## 4 Cell_6   S01
## 5 Cell_8   S01
## 6 Cell_9   S01
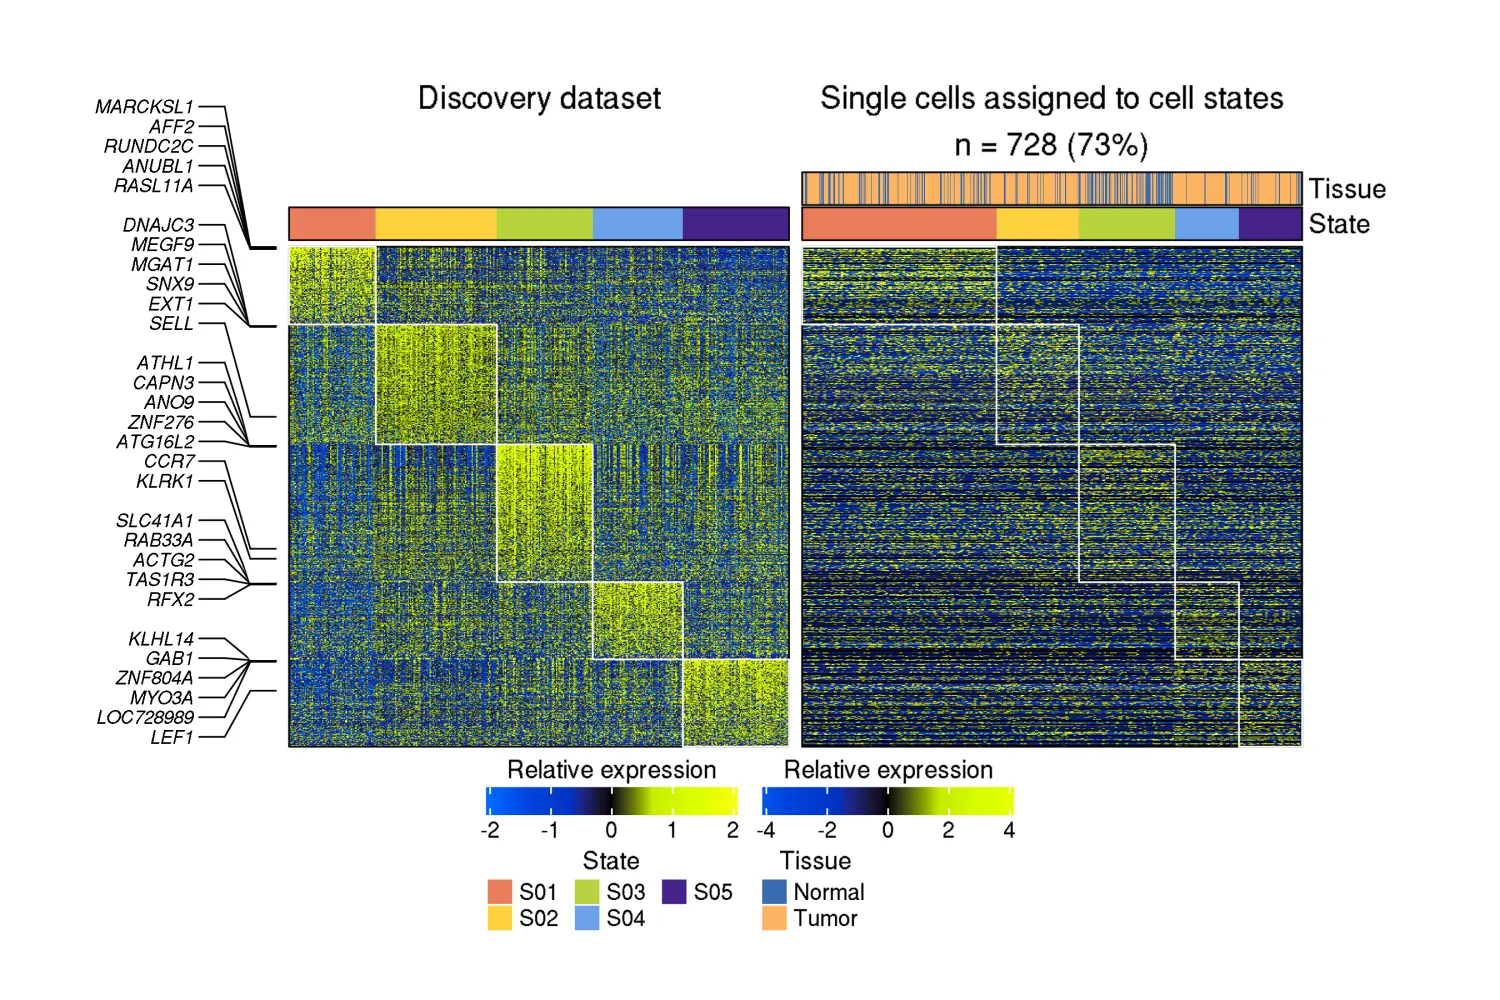
热图
knitr::include_graphics("RecoveryOutput/scRNA_lymphoma_data/B.cells/state_assignment_heatmap.png")
Recovery of Cell States and Ecotypes in Spatial Transcriptomics data(空间转录组示例),当然了,主要是10Xgenomics的空间数据
为了使 EcoTyper 在 Visium 数据中执行细胞状态和生态类型恢复,需要提供以下资源:
-
- the filtered feature-barcode matrices
barcodes.tsv.gz,features.tsv.gzandmatrix.mtx.gz, in the format provided by 10x Genomics, and thetissue_positions_list.csvfile produced by the run summary images pipeline, containing the spatial position of barcodes.
- the filtered feature-barcode matrices
如果要分析的系统中预期的主要细胞群被 EcoTyper 癌论文中分析的细胞群(B 细胞、CD4 T 细胞、CD8 T 细胞、树突细胞、内皮细胞、上皮细胞、成纤维细胞、肥大细胞、 单核细胞/巨噬细胞、NK 细胞、浆细胞、中性粒细胞)或 EcoTyper 淋巴瘤纸(B 细胞、CD4 T 细胞、CD8 T 细胞、滤泡辅助 T 细胞、Tregs、树突细胞、内皮细胞、成纤维细胞、肥大细胞、单核细胞/ 巨噬细胞、NK细胞、浆细胞、中性粒细胞),那么需要:
-
Docker
-
Docker containers for CIBERSORTx Fractions and CIBERSORTx HiRes modules, both of which can be obtained from the CIBERSORTx website. Please follow the instructions from the website to install them.
-
A token required for running the docker containers, which can also be obtained from the CIBERSORTx website.
如果要分析的系统中预期的主要细胞群没有被 EcoTyper 癌论文中分析的细胞群(B 细胞、CD4 T 细胞、CD8 T 细胞、树突细胞、内皮细胞、上皮细胞、成纤维细胞、肥大细胞)概括 、单核细胞/巨噬细胞、NK 细胞、浆细胞、中性粒细胞)或 EcoTyper 淋巴瘤论文(B 细胞、CD4 T 细胞、CD8 T 细胞、滤泡辅助 T 细胞、Tregs、树突状细胞、内皮细胞、成纤维细胞、肥大细胞、单核细胞 /巨噬细胞、NK细胞、浆细胞、中性粒细胞),则用户需要为这些群体提供自己的细胞类型比例估计:
首先看一下主脚本
suppressPackageStartupMessages({
library(config)
library(argparse)
source("pipeline/lib/config.R")
source("pipeline/lib/misc.R")
source("pipeline/lib/multithreading.R")
})

parser <- ArgumentParser(add_help = F)

arguments = parser$add_argument_group('Arguments')
arguments$add_argument("-c", "--config", type = "character", metavar="<PATH>",
    help="Path to the config files [required].")
arguments$add_argument("-h", "--help", action='store_true', help="Print help message.")

args <- parser$parse_args()

if(args$h || is.null(args$config))
{
    parser$print_help()
    quit()
}

config_file = abspath(args$config)

config <- config::get(file = config_file)

discovery = config$Input$"Discovery dataset name"
recovery = config$Input$"Recovery dataset name"
input_path = config$Input$"Input Visium directory"
fractions = config$Input$"Recovery cell type fractions"
coo = config$Input$"Malignant cell of origin"
CSx_username = config$Input$"CIBERSORTx username"
CSx_token = config$Input$"CIBERSORTx token"
n_threads = config$"Pipeline settings"$"Number of threads"

final_output = config$"Output"$"Output folder"

suppressWarnings({
    input_path = abspath(input_path)
    final_output = abspath(file.path(final_output, recovery))
})

suppressWarnings({
    fractions_path = abspath(fractions)
    })

if(!discovery %in% c("Carcinoma", "Lymphoma"))
{
    discovery_config_file = file.path("EcoTyper", discovery, "config_used.yml")
    if(!file.exists(discovery_config_file))
    {
        stop("Error: Cannot read the configuration file used for the discovery of cell states and ecotypes. It should be in the following path: '", config_file, "'. Please make sure that the '--discovery (-d)' argument provided is correct!")
    }
    config <- config::get(file = discovery_config_file)
    discovery_fractions = config$"Input"$"Cell type fractions"
    if(!is.null(discovery_fractions) && discovery_fractions %in% c("Carcinoma_Fractions", "Lymphoma_Fractions"))
    {
        fractions = discovery_fractions
    }else{
        if(!is.null(config$"Input"$"Filter non cell type specific genes"))
        {
            if(config$"Input"$"Filter non cell type specific genes")
            {
                fractions = "Cell_type_specific_genes"
            }else{
                fractions = "All_genes"
            }
        }else{
            fractions = "Custom"
        }
    }
}else{
    fractions = paste0(discovery, "_Fractions")
}

#Starting EcoTyper
setwd("pipeline")
start = Sys.time()

cat("\nLoading visium data...\n")
PushToJobQueue(paste("Rscript spatial_load_visium_data.R", recovery, input_path))
RunJobQueue()

if(fractions %in% c("Carcinoma_Fractions", "Lymphoma_Fractions") && !file.exists(fractions_path))
{
    cat("\nRunning CIBERSORTxFractions on the visium dataset...\n")
    PushToJobQueue(paste("Rscript csx_fractions.R", "visium", recovery, "LM22", "B_mode", CSx_username, CSx_token, TRUE))
    RunJobQueue()
    PushToJobQueue(paste("Rscript csx_fractions.R", "visium", recovery, "TR4", "B_mode", CSx_username, CSx_token, TRUE))
    RunJobQueue()
    PushToJobQueue(paste("Rscript csx_fractions_two_tiered.R", "visium", recovery, "TR4", "B_mode", "LM22", "B_mode", fractions))
    RunJobQueue()
    coo = "Epithelial.cells"
    if(fractions %in% "Lymphoma_Fractions")
    {
        coo = "B.cells"
    }
}else{
    cat("\nLoading user-provided cell type fractions...\n")

    dir.create(file.path("../CIBERSORTx/fractions/visium", recovery, fractions), recursive = T, showWarnings = F)
    PushToJobQueue(paste("cp -f", fractions_path, file.path("../CIBERSORTx/fractions/visium", recovery, fractions, "CIBERSORTx_Adjusted.txt")))
    RunJobQueue()
}

cat("\nRunning cell state recovery on the visium dataset...\n")
key = read.delim(file.path("../EcoTyper", discovery, fractions, "Analysis", "rank_selection", "rank_data.txt"))
for(cell_type in key[,1])
{
    n_states = key[key[,1] == cell_type, 2]
    PushToJobQueue((paste("Rscript state_recovery_visium.R", discovery, fractions, cell_type, n_states, recovery, "FALSE")))
}
RunJobQueue()

cat("\nCalculating cell state abundances...\n")
print(paste("Rscript spatial_states.R", discovery, recovery, fractions, coo))
PushToJobQueue((paste("Rscript spatial_states.R", discovery, recovery, fractions, coo)))
RunJobQueue()
cat("\nCalculating ecotype abundances...\n")
PushToJobQueue((paste("Rscript spatial_ecotypes.R", discovery, recovery, fractions, coo)))
RunJobQueue()

cat("\nPlotting cell state heatmaps...\n")
key = read.delim(file.path("../EcoTyper", discovery, fractions, "Analysis", "rank_selection", "rank_data.txt"))
for(cell_type in key[,1])
{
    n_states = key[key[,1] == cell_type, 2]
    PushToJobQueue((paste("Rscript spatial_plot_states.R", discovery, recovery, fractions, coo, cell_type)))
}
RunJobQueue()

PushToJobQueue((paste("Rscript spatial_plot_ecotypes.R", discovery, recovery, fractions, coo)))
RunJobQueue()

cat("\nCopying EcoTyper results to the output folder!\n")

if(file.exists(final_output) && length(list.files(final_output)) > 0)
{
    old_results_folder = paste0(final_output, format(Sys.time(), " %a %b %d %X %Y"))
    dir.create(old_results_folder, recursive = T, showWarnings = F)
    warning(paste0("The output folder contains files from a previous run. Moving those files to: '", old_results_folder, "'"))
    system(paste0("mv -f ", final_output, "/* '", old_results_folder, "'"))
}

dir.create(final_output, recursive = T, showWarnings = F)

key = read.delim(file.path("../EcoTyper", discovery, fractions, "Analysis", "rank_selection", "rank_data.txt"))
for(cell_type in key[,1])
{
    system(paste("cp -f", file.path("../EcoTyper", discovery, fractions, "Cell_States", "recovery", recovery, paste0(cell_type, "_spatial_heatmaps.pdf")), final_output))
    system(paste("cp -f", file.path("../EcoTyper", discovery, fractions, "Cell_States", "recovery", recovery, paste0(cell_type, "_spatial_heatmaps.png")), final_output))
}

system(paste("cp -f", file.path("../EcoTyper", discovery, fractions, "Cell_States", "recovery", recovery, "state_abundances.txt"), final_output))
system(paste("cp -f", file.path("../EcoTyper", discovery, fractions, "Cell_States", "recovery", recovery, "ecotype_abundances.txt"), final_output))
system(paste("cp -f", file.path("../EcoTyper", discovery, fractions, "Cell_States", "recovery", recovery, "Ecotype_spatial_heatmaps.pdf"), final_output))
system(paste("cp -f", file.path("../EcoTyper", discovery, fractions, "Cell_States", "recovery", recovery, "Ecotype_spatial_heatmaps.png"), final_output))

end = Sys.time()
cat(paste0("\nEcoTyper finished succesfully! Please find the results in: '", final_output, "'.\nRun time: ", format(end - start, digits = 0), "\n"))
运行一下
Rscript EcoTyper_recovery_visium.R -h
## usage: EcoTyper_recovery_visium.R [-c <PATH>] [-h]
##
## Arguments:
##   -c <PATH>, --config <PATH>
##                         Path to the config files [required].
##   -h, --help            Print help message.
The configuration file
This script takes as input file a configuration file in YAML format. The configuration file for this tutorial is available in config_recovery_visium.yml:
default :
  Input :
    Discovery dataset name : "Carcinoma"
    Recovery dataset name : "VisiumBreast"
    Input Visium directory : "example_data/VisiumBreast"
    #Path to a file containing the precomputed cell fractions for the visium array
    Recovery cell type fractions : "NULL"
    Malignant cell of origin : "Epithelial.cells"
    CIBERSORTx username : "<Please use your username from the CIBERSORTx website>"
    CIBERSORTx token : "<Please obtain a token from the CIBERSORTx website>"

  Output :
    Output folder : "VisiumOutput"

  Pipeline settings :
    Number of threads : 10
The configuration file has three sections, Input, Pipeline settings, and Output. We next will describe the expected content in each of these sections, and instruct the user how to set the appropriate settings in their applications.
Input section
The Input section contains settings regarding the input data.
Discovery dataset name
Discovery dataset name : "Carcinoma"
Discovery dataset name should contain the name of the discovery dataset used for defining cell states. By default, the only accepted values are Carcinoma and Lymphoma (case sensitive), which will recover the cell states that we defined across carcinomas and in lymphoma, respectively. If the user defined cell states in their own data (Tutorials 4-6), the name of the discovery dataset is the value provided in the Discovery dataset name field of the configuration file used for running discovery. For this tutorial, we set the name of the discovery dataset to Carcinoma.
Recovery dataset name
Recovery dataset name : "VisiumBreast"
Recovery dataset name is the identifier used by EcoTyper to internally save and retrieve the information about the cell states/ecotypes abundances. Any value that contains alphanumeric characters and ’_’ is accepted for this field.
Input Visium directory
Input Visium directory : "example_data/VisiumBreast"
There are 4 input files needed for recovery on the visium data:
list.files("example_data/VisiumBreast")
## [1] "barcodes.tsv.gz"           "features.tsv.gz"
## [3] "matrix.mtx.gz"             "tissue_positions_list.csv"
The filtered feature-barcode matrices barcodes.tsv.gz, features.tsv.gz and matrix.mtx.gz, in the format provided by 10x Genomics, and the tissue_positions_list.csv file produced by the run summary images pipeline, containing the spatial position of barcodes.
Recovery cell type fractions
Recovery cell type fractions : "NULL"
Recovery cell type fractions should contain the path to a file containing the cell type fraction estimations for each spot on the visium array. This field is ignored when the discovery dataset is Carcinoma or Lymphoma or when the discovery has been performed as described in Tutorial 4, using Carcinoma_Fractions or Lymphoma_Fractions. It is only used when users provided their own cell type fractions for deriving cell states and ecotypes in Tutorial 4. In this case, the user needs to provide a path to a tab-delimited file for this field. The file should contain in the first column the same sample names used as column names in the input expression matrix, and in the next columns, the cell type fractions for the same cell populations used for discovering cell states and ecotypes. These fractions should sum up to 1 for each row. An example of such a file is provided in:
data = read.delim("example_data/visium_fractions_example.txt", nrow = 5)
dim(data)
## [1] 5 13
data
##              Mixture Fibroblasts Endothelial.cells Epithelial.cells    B.cells
## 1 AAACAAGTATCTCCCA.1   0.3747796       0.016948078        0.2164860 0.04116797
## 2 AAACACCAATAACTGC.1   0.1231510       0.028426736        0.6737582 0.02209104
## 3 AAACAGAGCGACTCCT.1   0.2383718       0.085296697        0.3124031 0.03159104
## 4 AAACAGGGTCTATATT.1   0.1178922       0.053757339        0.1128586 0.11847960
## 5 AAACAGTGTTCCTGGG.1   0.3699561       0.005238928        0.5008316 0.01311040
##   CD4.T.cells CD8.T.cells Dendritic.cells  Mast.cells Monocytes.and.Macrophages
## 1  0.10447645 0.033647446     0.016196773 0.021842932                0.06183330
## 2  0.04376232 0.025219723     0.006647209 0.008375436                0.03087553
## 3  0.04581258 0.028235504     0.025698640 0.020992271                0.04386487
## 4  0.11018235 0.154411312     0.004780762 0.013200087                0.09278191
## 5  0.02826441 0.007037966     0.005238555 0.006979820                0.02851720
##      NK.cells        PCs        PMNs
## 1 0.030228865 0.06911276 0.013279833
## 2 0.006960189 0.02580987 0.004922716
## 3 0.020617429 0.13918007 0.007936014
## 4 0.000000000 0.21863726 0.003018626
## 5 0.007854087 0.02484208 0.002128834
Since in this tutorial we use the Carcinoma dataset as the discovery dataset, this field is not required. However, if it needs to be provided, it can be set as follows:
Recovery cell type fractions : "example_data/visium_fractions_example.txt"
Malignant cell of origin
Malignant cell of origin : "Epithelial.cells"
The cell of origin population for the cancer type being analyzed, amongst the cell types used for discovery. This field is used for plotting a gray background in the resulting output plot, with the intensity of gray depicting the abundance of the cell of origin population in each spot. It is not used when the discovery dataset is Carcinoma or Lymphoma or when the discovery has been performed as described in Tutorials 4-6, using Carcinoma_Fractions or Lymphoma_Fractions. In these cases, the malignant cells are automatically considered to be originating from Epithelial.cells or B.cells, respectively. Otherwise, this field needs to contain a column name in the file provided in Recovery cell type fractions field, corresponding to the appropriate cell type of origin.
CIBERSORTx username and token
CIBERSORTx username : "<Please use your username from the CIBERSORTx website>"
CIBERSORTx token : "<Please obtain a token from the CIBERSORTx website>"
The fields CIBERSORTx username and CIBERSORTx token should contain the username on the CIBERSORTx website and the token necessary to run the CIBERSORTx source code. The token can be obtained from the CIBERSORTx website.
The output section
The Output section contains a single field, Output folder, which specifies the path where the final output will be saved. This folder will be created if it does not exist.
Output folder : "VisiumOutput"
Number of threads
The last section, Pipeline settings, contains only one argument, the number of threads used for performing recovery:
Number of threads : 10
The command line
After editing the configuration file (config_recovery_visium.yml), the command line for recovering the cell states and ecotypes in Visium Spatial Gene Expression data looks as illustrated below. Please note that this script might take up to two hours to run on 10 threads. Also, since CIBERSORTx is run on each spot, the memory requirements might exceed the memory available on a typical laptop. We recommend that this tutorial is run on a server with >32GB of RAM.
Rscript EcoTyper_recovery_visium.R -c config_recovery_visium.yml
The output format
EcoTyper generates for each cell type the following outputs:
- Cell state abundances:
data = read.delim("VisiumOutput/VisiumBreast/state_abundances.txt")
dim(data)
## [1] 3813 76
head(data[,1:10])
##                   ID  X   Y       Sample Malignant B.cells_S01 B.cells_S02
## 1 AAACAAGTATCTCCCA.1 50 102 VisiumBreast 0.2164860           0           0
## 2 AAACACCAATAACTGC.1 59  19 VisiumBreast 0.6737582           0           0
## 3 AAACAGAGCGACTCCT.1 14  94 VisiumBreast 0.3124031           0           0
## 4 AAACAGGGTCTATATT.1 47  13 VisiumBreast 0.1128586           1           0
## 5 AAACAGTGTTCCTGGG.1 73  43 VisiumBreast 0.5008316           0           0
## 6 AAACATTTCCCGGATT.1 61  97 VisiumBreast 0.7553180           0           0
##   B.cells_S03 B.cells_S04 B.cells_S05
## 1           0   0.0000000   0.8690817
## 2           0   0.0000000   0.0000000
## 3           0   0.0000000   0.0000000
## 4           0   0.0000000   0.0000000
## 5           0   0.2767688   0.0000000
## 6           0   0.3345834   0.0000000
- Plots illustrating the cell state abundance across state from each cell type. The intensity of charcoal represents the cell state abundance. The intensity of gray represents the fraction of the cancer cell of origin population:
knitr::include_graphics("VisiumOutput/VisiumBreast/Fibroblasts_spatial_heatmaps.png")
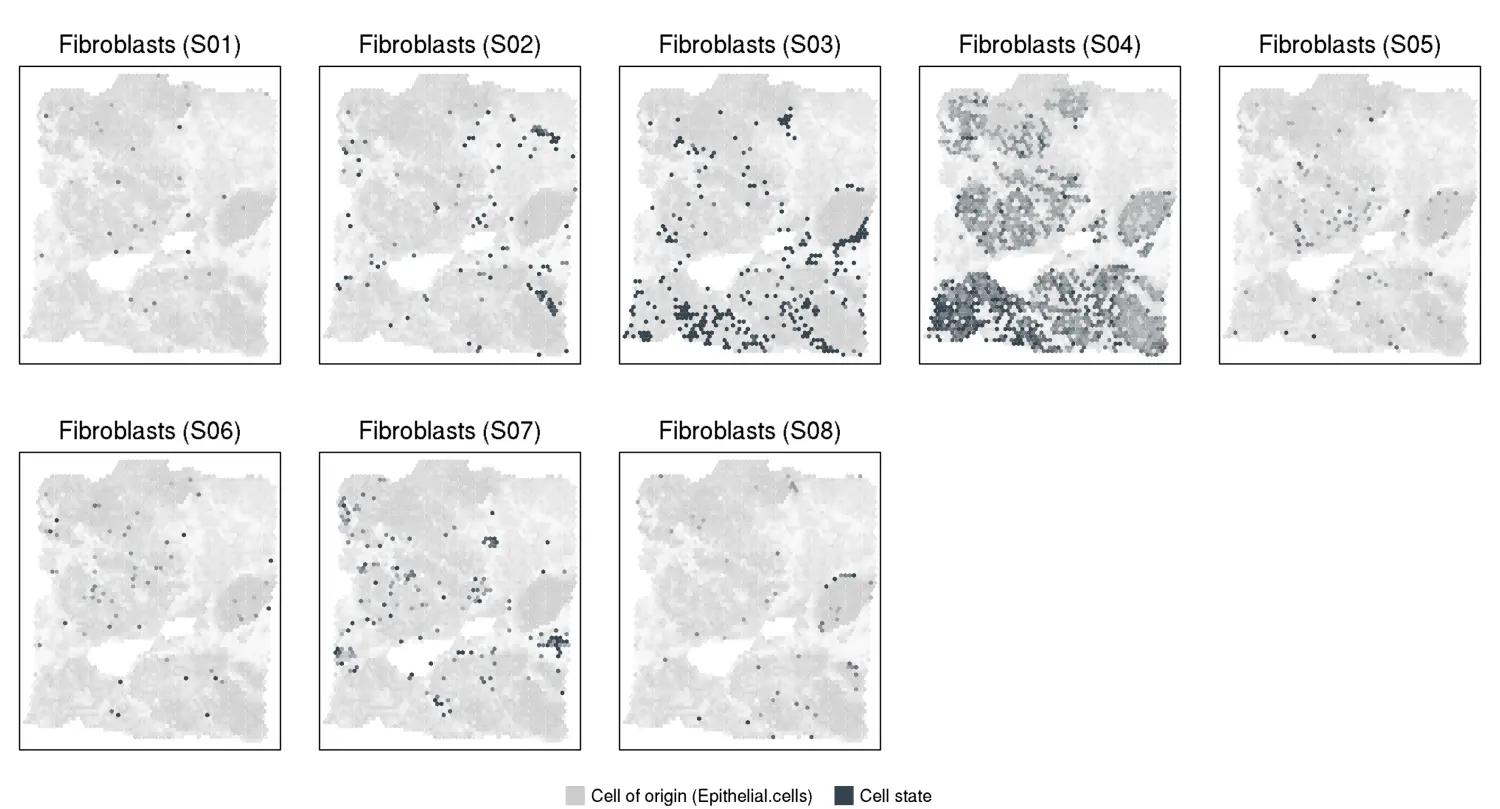
Fibroblasts_spatial_heatmaps.png
- Ecotype abundances:
data = read.delim("VisiumOutput/VisiumBreast/ecotype_abundances.txt")
dim(data)
## [1] 3813   15
head(data[,1:10])
##                                ID  X   Y       Sample Malignant        CE1
## VisiumBreast.1 AAACAAGTATCTCCCA.1 50 102 VisiumBreast 0.1142685 0.93179887
## VisiumBreast.2 AAACACCAATAACTGC.1 59  19 VisiumBreast 0.7334114 0.23355315
## VisiumBreast.3 AAACAGAGCGACTCCT.1 14  94 VisiumBreast 0.2441395 0.00000000
## VisiumBreast.4 AAACAGGGTCTATATT.1 47  13 VisiumBreast 0.0000000 0.09941146
## VisiumBreast.5 AAACAGTGTTCCTGGG.1 73  43 VisiumBreast 0.4992702 0.64507665
## VisiumBreast.6 AAACATTTCCCGGATT.1 61  97 VisiumBreast 0.8438427 0.02056875
##                      CE2       CE3       CE4 CE5
## VisiumBreast.1 0.0000000 0.0000000 0.7497744   0
## VisiumBreast.2 0.2357562 0.0000000 0.0000000   0
## VisiumBreast.3 0.0000000 0.0000000 0.0000000   0
## VisiumBreast.4 0.0000000 0.0000000 0.0000000   0
## VisiumBreast.5 0.0000000 0.1836142 0.0000000   0
## VisiumBreast.6 0.0000000 0.0000000 0.0000000   0
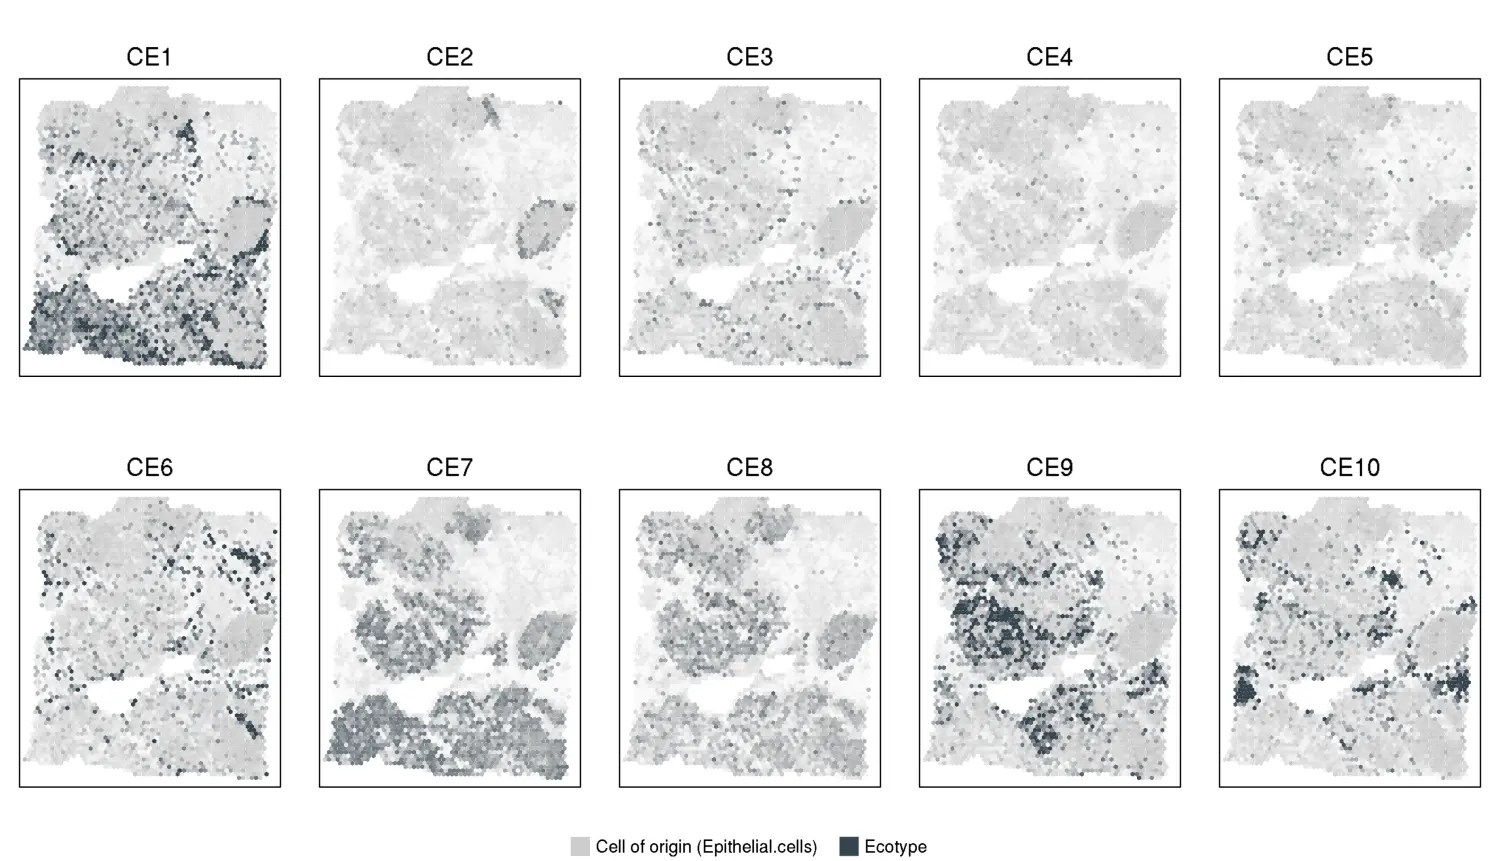
Plots illustrating the ecotype abundances. The intensity of charcoal represents the cell state abundance. The intensity of gray represents the fraction of the cancer cell of origin population:
knitr::include_graphics("VisiumOutput/VisiumBreast/Ecotype_spatial_heatmaps.png")
示例3,De novo Discovery of Cell States and Ecotypes in scRNA-seq Data
在教程中,将说明如何从 scRNA-seq 表达矩阵开始对细胞状态和生态型进行从头识别。 出于说明目的,我们使用来自结肠直肠癌的 scRNA-seq 的下采样版本作为发现数据集,可在 example_data/scRNA_CRC_data.txt 以及示例注释文件 example_data/scRNA_CRC_annotation.txt 中获得。
Overview of the EcoTyper workflow for discovering cell states in scRNA-seq data
EcoTyper 通过一系列步骤从 scRNA-seq 数据中获取细胞状态和生态型:
-
1、提取细胞类型特异性基因:去除在给定细胞类型中未特异性表达的基因,是降低识别虚假细胞状态可能性的重要考虑因素。在 scRNA-seq 数据中执行细胞状态发现之前,Ecotyper 默认应用非细胞类型特定基因的过滤器。具体来说,它在来自给定细胞类型的细胞和所有其他细胞类型组合的细胞之间执行差异表达。对于细胞类型的计算效率和平衡表示,此步骤仅使用每种细胞类型最多 500 个随机选择的细胞。从每种细胞类型中过滤掉 Q 值 > 0.05(双边 Wilcox 检验,使用 Benjamini-Hochberg 校正进行多假设校正)的基因。
-
2、相关矩阵上的细胞状态发现:EcoTyper 利用非负矩阵分解 (NMF) 从单细胞表达谱中识别转录定义的细胞状态。然而,直接应用于 scRNA-seq 表达矩阵的 NMF 可能表现不佳,因为 scRNA-seq 数据通常是稀疏的。因此,EcoTyper 首先将 NMF 应用于来自给定细胞类型的每对细胞之间的相关矩阵。为了提高计算效率,EcoTyper 在此步骤中最多仅使用 2,500 个随机选择的细胞。为了满足 NMF 的非负性要求,相关矩阵使用 posneg 变换单独处理。此函数将相关矩阵 Vi 转换为两个矩阵,一个仅包含正值,另一个仅包含符号反转的负值。这两个矩阵随后被连接以产生 Vi*。
对于每种细胞类型,EcoTyper 将 NMF 应用于一系列等级(细胞状态数),默认为 2-20 个状态。对于每个等级,NMF 算法使用不同的起始种子多次应用(我们建议至少 50 次),以提高鲁棒性。
-
3、选择细胞状态数:Cluster(状态)数选择是 NMF 应用中的一个重要考虑因素。我们发现,以前依赖最小化误差度量(例如,RMSE、KL 散度)或优化信息论度量的方法要么无法收敛,要么依赖于估算的基因数量。相比之下,cophenetic 系数量化了给定等级(即Cluster的数量)的分类稳定性,范围从 0 到 1,其中 1 是最大稳定的。虽然通常选择共同系数开始下降的等级,但这种方法很难应用于共同系数在等级间呈现多模态形状的情况,正如我们在某些细胞类型中发现的那样。因此,我们开发了一种更适合此类设置的启发式方法。在每种情况下,排名是根据在 2-20 个Clusters范围内评估的共生系数自动选择的(默认情况下)。具体来说,我们确定了在 2-20 区间内的第一次出现,其共相系数降至 0.95 以下(默认情况下),至少连续两个等级高于该水平。然后,我们选择了紧邻该交叉点的等级,该等级最接近 0.95(默认情况下)。
-
4、提取细胞状态信息:解析第 2 步产生的 NMF 输出,提取细胞状态信息用于下游分析。
-
5、在表达矩阵上重新发现细胞状态:在识别相关矩阵上的细胞状态之后,EcoTyper 执行差异表达以识别与每个细胞状态最高度相关的基因。生成的标记按每个状态的倍数变化进行排序,并选择跨细胞状态排名最高的前 1000 个基因用于新一轮的 NMF。如果可用的基因少于 1000 个,则选择所有基因。在 NMF 之前,每个基因都被缩放为均值 0 和单位方差。为了满足 NMF 的非负性要求,细胞类型特异性表达矩阵使用 posneg 转换单独处理。此函数将输入表达式矩阵 Vi 转换为两个矩阵,一个仅包含正值,另一个仅包含符号反转的负值。这两个矩阵随后被连接以产生 Vi*。
对于每种细胞类型,EcoTyper 仅将 NMF 应用于步骤 3 中选择的等级。和以前一样,NMF 算法应用多次(我们建议至少 50 次)具有不同的起始种子,以实现稳健性。 -
6、提取细胞状态信息:解析第 5 步产生的 NMF 输出,提取细胞状态信息用于下游分析。
-
7、细胞状态 QC 过滤器:虽然 posneg 变换需要满足标准化后 NMF 的非负性约束,但它会导致识别由负值多于正值的特征驱动的虚假细胞状态。 为了解决这个问题,我们设计了一个自适应误报指数(AFI),这是一个新的指数,定义为 W 矩阵中对应于负特征和正特征的权重之和之间的比率。 EcoTyper 自动过滤具有 AFI > = 1 的状态。
-
8、生态型(细胞群落)发现:生态型或细胞群落是通过识别样本中细胞状态的共现模式得出的。首先,EcoTyper 利用 Jaccard 指数来量化发现队列中样本中每对细胞状态之间的重叠程度。为此,它将每个细胞状态 q 离散化为长度为 l 的二进制向量 a,其中 l = 发现队列中的样本数。总的来说,这些向量包括二进制矩阵 A,其行数与跨细胞类型和 l 列(样本)的细胞状态相同。给定样本 s,如果状态 q 是细胞类型 i 中所有状态中最丰富的状态,则 EcoTyper 将 A(q,s) 设置为 1;否则 A(q,s) ← 0。然后它计算矩阵 A 中行(状态)上的所有成对 Jaccard 索引,产生矩阵 J。使用超几何检验,它评估任何给定的细胞状态对 q 和k 没有重叠。在超几何 p 值 > 0.01 的情况下,J(q,k) 的 Jaccard 指数设置为 0(即没有重叠)。为了在适应异常值的同时识别社区,更新的 Jaccard 矩阵 J' 使用具有欧几里得距离的平均链接进行层次聚类(R stats 包中的 hclust)。然后通过轮廓宽度最大化来确定最佳聚类数。从进一步分析中排除具有少于 3 个细胞状态的Cluster。
Checklist before performing cell states and ecotypes discovery in scRNA-seq data
- a user-provided scRNA-seq expression matrix, on which the discovery will be performed (a discovery cohort). For this tutorial, we will use the example data in example_data/scRNA_CRC_data.txt.
- a sample annotation file, such as the one provided in example_data/scRNA_CRC_annotation.txt, with at least three columns: ID, CellType and Sample.
Cell states and ecotypes discovery in scRNA-seq data,先看一下主脚本EcoTyper_discovery_scRNA.R
suppressPackageStartupMessages({
library(config)
library(argparse)
source("pipeline/lib/config.R")
source("pipeline/lib/misc.R")
source("pipeline/lib/multithreading.R")
})

parser <- ArgumentParser(add_help = F)

arguments = parser$add_argument_group('Arguments')

arguments$add_argument("-c", "--config", type = "character", metavar="<PATH>",
    help="Path to the config files [required].")
arguments$add_argument("-h", "--help", action='store_true', help="Print help message.")

args <- parser$parse_args()
#print(args)
if(args$h || is.null(args$config))
{
    parser$print_help()
    quit()
}

config_file = abspath(args$config)

config <- config::get(file = config_file)
check_discovery_configuration_scRNA(config)

discovery = config$Input$"Discovery dataset name"
discovery_type = config$Input$"Expression type"
scale_column = config$Input$"Annotation file column to scale by"
additional_columns = config$Input$"Annotation file column(s) to plot"

final_output = config$"Output"$"Output folder"

n_threads = config$"Pipeline settings"$"Number of threads"

nmf_restarts = config$"Pipeline settings"$"Number of NMF restarts"
max_clusters = config$"Pipeline settings"$"Maximum number of states per cell type"
cohpenetic_cutoff = config$"Pipeline settings"$"Cophenetic coefficient cutoff"
skip_steps = config$"Pipeline settings"$"Pipeline steps to skip"
p_value_cutoff = config$"Pipeline settings"$"Jaccard matrix p-value cutoff"

suppressWarnings({
    final_output = abspath(final_output)
})

#Starting EcoTyper
setwd("pipeline")
start = Sys.time()

if(config$"Pipeline settings"$"Filter non cell type specific genes")
{
    fractions = "Cell_type_specific_genes"
}else{
    fractions = "All_genes"
}

if(!1 %in% skip_steps & config$"Pipeline settings"$"Filter non cell type specific genes")
{
    cat("\nStep 1 (extract cell type specific genes)...\n")

    annotation = read.delim(file.path(file.path("../datasets/discovery", discovery, "annotation.txt")))
    cell_types = unlist(levels(as.factor(as.character(annotation$CellType))))
    for(cell_type in cell_types)
    {
        print(cell_type)
        PushToJobQueue(paste("Rscript state_discovery_scRNA_filter_genes.R", discovery, fractions, cell_type, scale_column))
    }
    RunJobQueue()
    cat("Step 1 (extract cell type specific genes) finished successfully!\n")

}else{
    cat("Skipping step 1 (extract cell type specific genes)...\n")
}

if(!2 %in% skip_steps)
{
    cat("\nStep 2 (cell state discovery on correrlation matrices): Calculating correlation matrices...\n")

    annotation = read.delim(file.path(file.path("../datasets/discovery", discovery, "annotation.txt")))
    cell_types = unlist(levels(as.factor(as.character(annotation$CellType))))

    for(cell_type in cell_types)
    {
        filter_genes = (fractions == "Cell_type_specific_genes")
        PushToJobQueue(paste("Rscript state_discovery_scRNA_distances.R", discovery, fractions, cell_type, filter_genes, scale_column))
    }
    RunJobQueue()

    cat("Step 2 (cell state discovery on correrlation matrices): Running NMF (Warning: This step might take a long time!)...\n")

    for(cell_type in cell_types)
    {
        if(!file.exists(file.path("../EcoTyper", discovery, fractions, "Cell_States", "discovery_cross_cor", cell_type, "expression_top_genes_scaled.txt")))
        {
            next
        }
        for(n_clusters in 2:max_clusters)
        {
            for(restart in 1:nmf_restarts)
            {
                if(!file.exists(file.path("../EcoTyper", discovery, fractions, "Cell_States", "discovery_cross_cor", cell_type, n_clusters, "restarts", restart, "estim.RData")))
                {
                    PushToJobQueue(paste("Rscript state_discovery_NMF.R", "discovery_cross_cor", discovery, fractions, cell_type, n_clusters, restart))
                }else{
                    cat(paste0("Warning: Skipping NMF on '", cell_type, "' (number of states = ", n_clusters, ", restart ", restart, "), as the output file '", file.path("../EcoTyper", discovery, fractions, "Cell_States", "discovery", cell_type, n_clusters, "restarts", restart, "estim.RData"), "' already exists!\n"))
                }
            }
        }
    }
    RunJobQueue()

    cat("Step 2 (cell state discovery on correrlation matrices): Aggregating NMF results...\n")
    for(cell_type in cell_types)
    {
        if(!file.exists(file.path("../EcoTyper", discovery, fractions, "Cell_States", "discovery_cross_cor", cell_type, "expression_top_genes_scaled.txt")))
        {
            next
        }
        PushToJobQueue(paste("Rscript state_discovery_combine_NMF_restarts.R", "discovery_cross_cor", discovery, fractions, cell_type, max_clusters, nmf_restarts))
    }
    RunJobQueue()
    cat("Step 2 (cell state discovery on correrlation matrices) finished successfully!\n")
}else{
    cat("Skipping step 2 (cell state discovery on correrlation matrices)...\n")
}

if(!3 %in% skip_steps)
{
    cat("\nStep 3 (choosing the number of cell states)...\n")
    PushToJobQueue(paste("Rscript state_discovery_rank_selection.R", "discovery_cross_cor", discovery, fractions, max_clusters, cohpenetic_cutoff))
    RunJobQueue()
    cat("Step 3 (choosing the number of cell states) finished successfully!\n")
}else{
    cat("Skipping step 3 (choosing the number of cell states)...\n")
}

if(!4 %in% skip_steps)
{
    cat("\nStep 4 (extracting cell state information)...\n")

    system(paste("cp -f ", config_file, file.path("../EcoTyper", discovery, "config_used.yml")))

    key = read.delim(file.path("../EcoTyper", discovery, fractions, "Analysis", "rank_selection", "rank_data.txt"))
    for(cell_type in key[,1])
    {
        cat(paste("Extracting cell states information for:", cell_type, "\n"))
        n_clusters = key[key[,1] == cell_type, 2]
        PushToJobQueue(paste("Rscript state_discovery_initial_plots_scRNA.R", "discovery_cross_cor", discovery, fractions, cell_type, n_clusters, "State", paste(additional_columns, collapse = " ")))
    }
    RunJobQueue()
    cat("Step 4 (extracting cell state information) finished successfully!\n")
}else{
    cat("\nSkipping step 4 (extracting cell state information)...\n")
}

if(!5 %in% skip_steps)
{
    cat("\nStep 5 (cell state re-discovery in expression matrices)...\n")

    key = read.delim(file.path("../EcoTyper", discovery, fractions, "Analysis", "rank_selection", "rank_data.txt"))
    for(cell_type in key[,1])
    {
        cat(paste("Extracting marker genes for cell states defined in:", cell_type, "\n"))
        n_clusters = key[key[,1] == cell_type, 2]
        PushToJobQueue(paste("Rscript state_discovery_extract_features_scRNA.R", discovery, fractions, cell_type, n_clusters))
    }
    RunJobQueue()

    cat("\nStep 5 (cell state re-discovery in expression matrices): Running NMF on expression matrix...\n")

    key = read.delim(file.path("../EcoTyper", discovery, fractions, "Analysis", "rank_selection", "rank_data.txt"))
    for(cell_type in key[,1])
    {
        if(!file.exists(file.path("../EcoTyper", discovery, fractions, "Cell_States", "discovery", cell_type, "expression_top_genes_scaled.txt")))
        {
            next
        }

        n_clusters = key[key[,1] == cell_type, 2]
        for(restart in 1:nmf_restarts)
        {
            if(!file.exists(file.path("../EcoTyper", discovery, fractions, "Cell_States", "discovery", cell_type, n_clusters, "restarts", restart, "estim.RData")))
            {
                PushToJobQueue(paste("Rscript state_discovery_NMF.R", "discovery", discovery, fractions, cell_type, n_clusters, restart))
            }else{
                cat(paste0("Warning: Skipping NMF on '", cell_type, "' (number of states = ", n_clusters, ", restart ", restart, "), as the output file '", file.path("../EcoTyper", discovery, fractions, "Cell_States", "discovery", cell_type, n_clusters, "restarts", restart, "estim.RData"), "' already exists!\n"))
            }
        }
    }
    RunJobQueue()

    cat("Step 5 (cell state re-discovery in expression matrices): Aggregating NMF results...\n")
    for(cell_type in key[,1])
    {
        if(!file.exists(file.path("../EcoTyper", discovery, fractions, "Cell_States", "discovery", cell_type, "expression_top_genes_scaled.txt")))
        {
            next
        }
        PushToJobQueue(paste("Rscript state_discovery_combine_NMF_restarts.R", "discovery", discovery, fractions, cell_type, max_clusters, nmf_restarts))
    }
    RunJobQueue()
    cat("Step 5 (cell state re-discovery in expression matrices) finished successfully!\n")
}else{
    cat("Skipping step 5 (cell state re-discovery in expression matrices)...\n")
}

if(!6 %in% skip_steps)
{
    cat("\nStep 6 (extracting information for re-discovered cell states)...\n")

    key = read.delim(file.path("../EcoTyper", discovery, fractions, "Analysis", "rank_selection", "rank_data.txt"))
    for(cell_type in key[,1])
    {
        cat(paste("Extracting cell states information for:", cell_type, "\n"))
        n_clusters = key[key[,1] == cell_type, 2]
        PushToJobQueue(paste("Rscript state_discovery_initial_plots.R", "discovery", discovery, fractions, cell_type, n_clusters, "State", paste(additional_columns, collapse = " ")))
    }
    RunJobQueue()
    cat("Step 6 (extracting information for re-discovered cell states) finished successfully!\n")
}else{
    cat("\nSkipping step 6 (extracting information for re-discovered cell states)...\n")
}

if(!7 %in% skip_steps)
{
    cat("\nStep 7 (cell state QC filter)...\n")

    key = read.delim(file.path("../EcoTyper", discovery, fractions, "Analysis", "rank_selection", "rank_data.txt"))
    for(cell_type in key[,1])
    {
        cat(paste("Filtering low-quality cell states for:", cell_type, "\n"))
        n_clusters = key[key[,1] == cell_type, 2]
        PushToJobQueue(paste("Rscript state_discovery_first_filter_scRNA.R", discovery, fractions, cell_type, n_clusters, "State", paste(additional_columns, collapse = " ")))
    }
    RunJobQueue()
    cat("Step 7 (cell state QC filter) finished successfully!\n")
}else{
    cat("\nSkipping step 7 (cell state QC filter)...\n")
}

if(!8 %in% skip_steps)
{
    cat("\nStep 8 (ecotype discovery)...\n")
    PushToJobQueue(paste("Rscript ecotypes_scRNA.R", discovery, fractions, p_value_cutoff))
    RunJobQueue()
    PushToJobQueue(paste("Rscript ecotypes_assign_samples_scRNA.R", discovery, fractions, "State",paste(additional_columns, collapse = " ")))
    cat("Step 8 (ecotype discovery) finished successfully!\n")
    RunJobQueue()
}else{
    cat("Skipping step 8 (ecotype discovery)...\n")
}

cat("\nCopying EcoTyper results to the output folder!\n")

if(file.exists(final_output) && length(list.files(final_output)) > 0)
{
    old_results_folder = paste0(final_output, format(Sys.time(), " %a %b %d %X %Y"))
    dir.create(old_results_folder, recursive = T, showWarnings = F)
    warning(paste0("The output folder contains files from a previous run. Moving those files to: '", old_results_folder, "'"))
    system(paste0("mv -f ", final_output, "/* '", old_results_folder, "'"))
}

dir.create(final_output, recursive = T, showWarnings = F)

system(paste("cp -f", file.path("../EcoTyper", discovery, fractions, "Analysis", "rank_selection", "rank_data.txt"), final_output))
system(paste("cp -f", file.path("../EcoTyper", discovery, fractions, "Analysis", "rank_selection", "rank_plot.pdf"), final_output))
system(paste("cp -f", file.path("../EcoTyper", discovery, fractions, "Analysis", "rank_selection", "rank_plot.png"), final_output))

key = read.delim(file.path("../EcoTyper", discovery, fractions, "Analysis", "rank_selection", "rank_data.txt"))
for(cell_type in key[,1])
{
    n_clusters = key[key[,1] == cell_type, 2]
    ct_output = file.path(final_output, cell_type)
    dir.create(ct_output, recursive = T, showWarnings = F)
    system(paste("cp -f", file.path("../EcoTyper", discovery, fractions, "Cell_States", "discovery", cell_type, n_clusters, "gene_info.txt"), ct_output))
    system(paste("cp -f", file.path("../EcoTyper", discovery, fractions, "Cell_States", "discovery", cell_type, n_clusters, "state_abundances.txt"), ct_output))
    system(paste("cp -f", file.path("../EcoTyper", discovery, fractions, "Cell_States", "discovery", cell_type, n_clusters, "state_assignment.txt"), ct_output))
    system(paste("cp -f", file.path("../EcoTyper", discovery, fractions, "Cell_States", "discovery", cell_type, n_clusters, "state_assignment_heatmap.pdf"), ct_output))
    system(paste("cp -f", file.path("../EcoTyper", discovery, fractions, "Cell_States", "discovery", cell_type, n_clusters, "state_assignment_heatmap.png"), ct_output))
    system(paste("cp -f", file.path("../EcoTyper", discovery, fractions, "Cell_States", "discovery", cell_type, n_clusters, "heatmap_data.txt"), ct_output))
    system(paste("cp -f", file.path("../EcoTyper", discovery, fractions, "Cell_States", "discovery", cell_type, n_clusters, "heatmap_top_ann.txt"), ct_output))
}

ct_output = file.path(final_output, "Ecotypes")
dir.create(ct_output, recursive = T, showWarnings = F)
system(paste("cp -f", file.path("../EcoTyper", discovery, fractions, "Ecotypes", "discovery", "ecotypes.txt"), ct_output))
system(paste("cp -f", file.path("../EcoTyper", discovery, fractions, "Ecotypes", "discovery", "ecotype_assignment.txt"), ct_output))
system(paste("cp -f", file.path("../EcoTyper", discovery, fractions, "Ecotypes", "discovery", "ecotype_abundance.txt"), ct_output))
system(paste("cp -f", file.path("../EcoTyper", discovery, fractions, "Ecotypes", "discovery", "heatmap_assigned_samples_viridis.pdf"), ct_output))
system(paste("cp -f", file.path("../EcoTyper", discovery, fractions, "Ecotypes", "discovery", "heatmap_assigned_samples_viridis.png"), ct_output))
system(paste("cp -f", file.path("../EcoTyper", discovery, fractions, "Ecotypes", "discovery", "jaccard_matrix.pdf"), ct_output))
system(paste("cp -f", file.path("../EcoTyper", discovery, fractions, "Ecotypes", "discovery", "jaccard_matrix.png"), ct_output))
system(paste("cp -f", file.path("../EcoTyper", discovery, fractions, "Ecotypes", "discovery", "nclusters_jaccard.png"), ct_output))
system(paste("cp -f", file.path("../EcoTyper", discovery, fractions, "Ecotypes", "discovery", "nclusters_jaccard.pdf"), ct_output))

end = Sys.time()
cat(paste0("\nEcoTyper finished succesfully! Please find the results in: '", final_output, "'.\nRun time: ", format(end - start, digits = 0), "\n"))
Rscript EcoTyper_discovery_scRNA.R -h
## usage: EcoTyper_discovery_scRNA.R [-c <PATH>] [-h]
##
## Arguments:
##   -c <PATH>, --config <PATH>
##                         Path to the config files [required].
##   -h, --help            Print help message.
该脚本将 YAML 格式的配置文件作为输入文件。 本教程的配置文件位于 config_discovery_scRNA.yml 中:
default :
  Input :
    Discovery dataset name : "discovery_scRNA_CRC"
    Expression matrix : "example_data/scRNA_CRC_data.txt"
    Annotation file : "example_data/scRNA_CRC_annotation.txt"
    Annotation file column to scale by : NULL
    Annotation file column(s) to plot : []

  Output :
    Output folder : "DiscoveryOutput_scRNA"

  Pipeline settings :
    #Pipeline steps:
    #   step 1 (extract cell type specific genes)
    #   step 2 (cell state discovery on correrlation matrices)
    #   step 3 (choosing the number of cell states)
    #   step 4 (extracting cell state information)
    #   step 5 (cell state re-discovery in expression matrices)
    #   step 6 (extracting information for re-discovered cell states)
    #   step 7 (cell state QC filter)
    #   step 8 (ecotype discovery)
    Pipeline steps to skip : []
    Filter non cell type specific genes : True
    Number of threads : 10
    Number of NMF restarts : 5
    Maximum number of states per cell type : 20
    Cophenetic coefficient cutoff : 0.95
    #The p-value cutoff used for filtering non-significant overlaps in the jaccard matrix used for discovering ecotypes in step 8. Default: 1 (no filtering).
    Jaccard matrix p-value cutoff : 1
配置文件包含三个部分,输入、输出和管道设置。 接下来,我们将分别描述这三个部分的预期内容,并指导用户如何在其应用程序中设置适当的设置。
Input section
The Input section contains settings regarding the input data.
Discovery dataset name
Discovery dataset name is the identifier used by EcoTyper to internally save and retrieve the information about the cell states/ecotypes defined on this discovery dataset. It is also the name to be provided to the -d/–discovery argument of scripts EcoTyper_recovery_scRNA.R and EcoTyper_recovery_bulk.R, when performing cell state/ecotypes recovery. Any value that contains alphanumeric characters and ’_’ is accepted for this field.
Discovery dataset name : "discovery_scRNA_CRC"
Expression matrix
Expression matrix : "example_data/scRNA_CRC_data.txt"
Expression matrix field should contain the path to a tab-delimited file containing the expression data, with genes as rows and cells as columns. The expression matrix should be in the TPM, CPM or other suitable normalized space. It should have gene symbols on the first column and gene counts for each cell on the next columns. Column (cells) names should be unique. Also, we recommend that the column names do not contain special characters that are modified by the R function make.names, e.g. having digits at the beginning of the name or containing characters such as space, tab or -:
The expected format for the expression matrix is:
data = read.delim("example_data/scRNA_CRC_data.txt", nrow = 5)
dim(data)
## [1] 5 13781
head(data[,1:5])
##      Gene SMC01.T_AAAGATGCATGGATGG SMC01.T_AAAGTAGCAAGGACAC
## 1    A1BG                        0                        0
## 2    A1CF                        0                        0
## 3     A2M                        0                        0
## 4   A2ML1                        0                        0
## 5 A3GALT2                        0                        0
##   SMC01.T_AAATGCCAGGATCGCA SMC01.T_AACTCTTCACAACGCC
## 1                        0                        0
## 2                        0                        0
## 3                        0                        0
## 4                        0                        0
## 5                        0                        0
Annotation file
Annotation file : "example_data/scRNA_CRC_annotation.txt"
A path to an annotation file should be provided in the field Annotation file. This file should contain a column called ID with the same names (e.g. cell barcodes) as the columns of the expression matrix, a column called CellType indicating cell type for each cell, and a column called Sample indicating the sample identifier for each cell. The latter is used for ecotype discovery. This file can contain any number of additional columns. The additional columns can be used for defining sample batches (see Section Annotation file column to scale by below) and for plotting color bars in the heatmaps output (see Section Annotation file column(s) to plot below). For the current example, the annotation file has the following format:
annotation = read.delim("example_data/scRNA_CRC_annotation.txt", nrow = 5)
dim(annotation)
## [1] 5 9
head(annotation)
##                      Index Patient Class  Sample        Cell_type Cell_subtype
## 1 SMC01-T_AAAGATGCATGGATGG   SMC01 Tumor SMC01-T Epithelial cells         CMS2
## 2 SMC01-T_AAAGTAGCAAGGACAC   SMC01 Tumor SMC01-T Epithelial cells         CMS2
## 3 SMC01-T_AAATGCCAGGATCGCA   SMC01 Tumor SMC01-T Epithelial cells         CMS2
## 4 SMC01-T_AACTCTTCACAACGCC   SMC01 Tumor SMC01-T Epithelial cells         CMS2
## 5 SMC01-T_AACTTTCGTTCGGGCT   SMC01 Tumor SMC01-T Epithelial cells         CMS2
##           CellType                       ID Tissue
## 1 Epithelial.cells SMC01.T_AAAGATGCATGGATGG  Tumor
## 2 Epithelial.cells SMC01.T_AAAGTAGCAAGGACAC  Tumor
## 3 Epithelial.cells SMC01.T_AAATGCCAGGATCGCA  Tumor
## 4 Epithelial.cells SMC01.T_AACTCTTCACAACGCC  Tumor
## 5 Epithelial.cells SMC01.T_AACTTTCGTTCGGGCT  Tumor
Annotation file column to scale by
Annotation file column to scale by : NULL
In order to discover pan-carcinoma cell states and ecotypes in the EcoType carcinoma paper, we standardize genes to mean 0 and unit variance within each tumor type (histology). Field Annotation file column to scale by allows users to specify a column name in the annotation file, by which the cells will be grouped when performing standardization. However, this is an analytical choice, depending on the purpose of the analysis. If the users are interested in defining cell states and ecotypes regardless of tumor type-specificity, this argument can be set to NULL. In this case, the standardization will be applied across all samples in the discovery cohort. The same will happen if the annotation file is not provided.
In the current example, this field is not used and therefore set to NULL.
Annotation file column(s) to plot
Annotation file column(s) to plot : ["Histology", "Tissue"]
Annotation file column(s) to plot field specifies which columns in the annotation file will be used as color bar in the output heatmaps, in addition to the cell state label column, plotted by default.
The output section
The Output section contains a single field, Output folder, which specifies the path where the final output will be saved. This folder will be created if it does not exist.
Output folder : "DiscoveryOutput_scRNA"
Pipeline settings
The last section, Pipeline settings, contains settings controlling how EcoTyper is run.
Pipeline steps to skip
 #Pipeline steps:
    #   step 1 (extract cell type specific genes)
    #   step 2 (cell state discovery on correlation matrices)
    #   step 3 (choosing the number of cell states)
    #   step 4 (extracting cell state information)
    #   step 5 (cell state re-discovery in expression matrices)
    #   step 6 (extracting information for re-discovered cell states)
    #   step 7 (cell state QC filter)
    #   step 8 (ecotype discovery)
The Pipeline steps to skip option allows user to skip some of the steps outlined in section Overview of the EcoTyper workflow for discovering cell states. Please note that this option is only intended for cases when the pipeline had already been run once, and small adjustments are made to the parameters. For example, if the Cophenetic coefficient cutoff used in step 3 needs adjusting, the user might want to skip steps 1-2 and re-run from step 3 onwards.
Filter non cell type specific genes
Filter non cell type specific genes : True
Flag indicated whether to apply the filter for cell type specific genes in step 1, outlined in section Overview of the EcoTyper workflow for discovering cell states. For best results, we do recommend applying this filter.
Number of threads
Number of threads : 10
The number of threads EcoTyper will be run on.
Number of NMF restarts
Number of NMF restarts : 5
The NMF approach used by EcoTyper (Brunet et al.), can give slightly different results, depending on the random initialization of the algorithm. To obtain a stable solution, NMF is generally run multiple times with different seeds, and the solution that best explains the discovery data is chosen. Additionally, the variation of NMF solutions across restarts with different seeds is quantified using Cophenetic coefficients and used in step 4 of EcoTyper for selecting the number of states. The parameter Number of NMF restarts specifies how many restarts with different seed should EcoTyper perform for each rank selection, in each cell type. Since this is a very time consuming process, in this example we only use 5. However, for publication-quality results, we recommend at least 50 restarts.
Maximum number of states per cell type
Maximum number of states per cell type : 20
Maximum number of states per cell type specifies the upper end of the range for the number of states possible for each cell type. The lower end is 2.
Cophenetic coefficient cutoff
Cophenetic coefficient cutoff : 0.975
This field indicates the Cophenetic coefficient cutoff, in the range [0, 1], used for automatically determining the number of states in step 4. Lower values generally lead to more clusters being identified. In this particular example, we set it to 0.975.
Jaccard matrix p-value cutoff
Jaccard matrix p-value cutoff : 1
Ecotype identification on step 8 is performed by clustering a jaccard matrix that quantifies the sample overlap between each pair of states. Prior to performing ecotype identification, the jaccard matrix values corresponding to pairs of states for which the sample overlap is not significant are set to 0, in order to mitigate the noise introduced by spurious overlaps. The value provided in this field specifies the p-value cutoff above which the overlaps are considered non-significant. When the number of samples in the scRNA-seq dataset is small, such as in the current example, we recommend this filter is disabled (p-value cutoff = 1), to avoid over-filtering the jaccard matrix. However, we encourage users to set this cutoff to lower values (e.g. 0.05), if the discovery scRNA-seq dataset contains a number of samples large enough to reliably evaluate the significance of overlaps.
The command line
After editing the configuration file (config_discovery_scRNA.yml), the de novo discovery cell states and ecotypes can be run as is illustrated below. Please note that this script might take 24-48 hours to run on 10 threads. Also, EcoTyper cannot be run on the example data from this tutorial using a typical laptop (16GB memory). We recommend that it is run on a server with >50-100GB of RAM or a high performance cluster.
Rscript EcoTyper_discovery_scRNA.R -c config_discovery_scRNA.yml
The output format
EcoTyper generates for each cell type the following outputs:
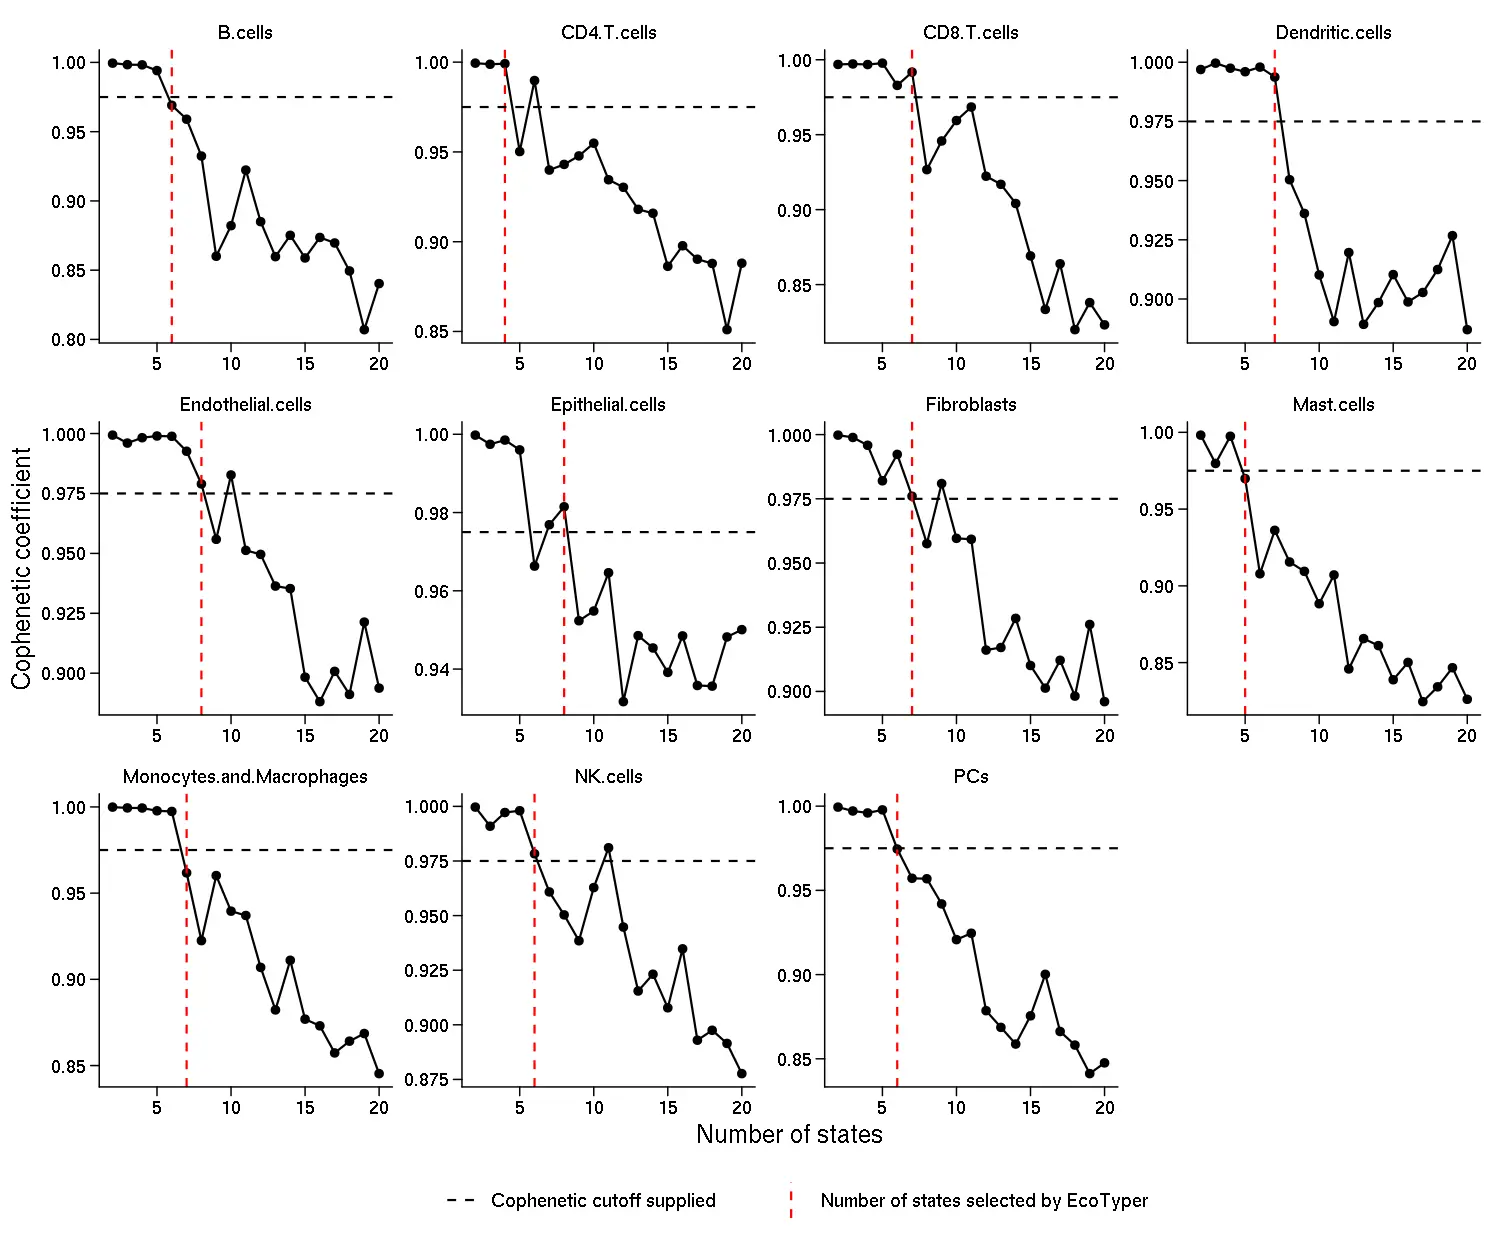
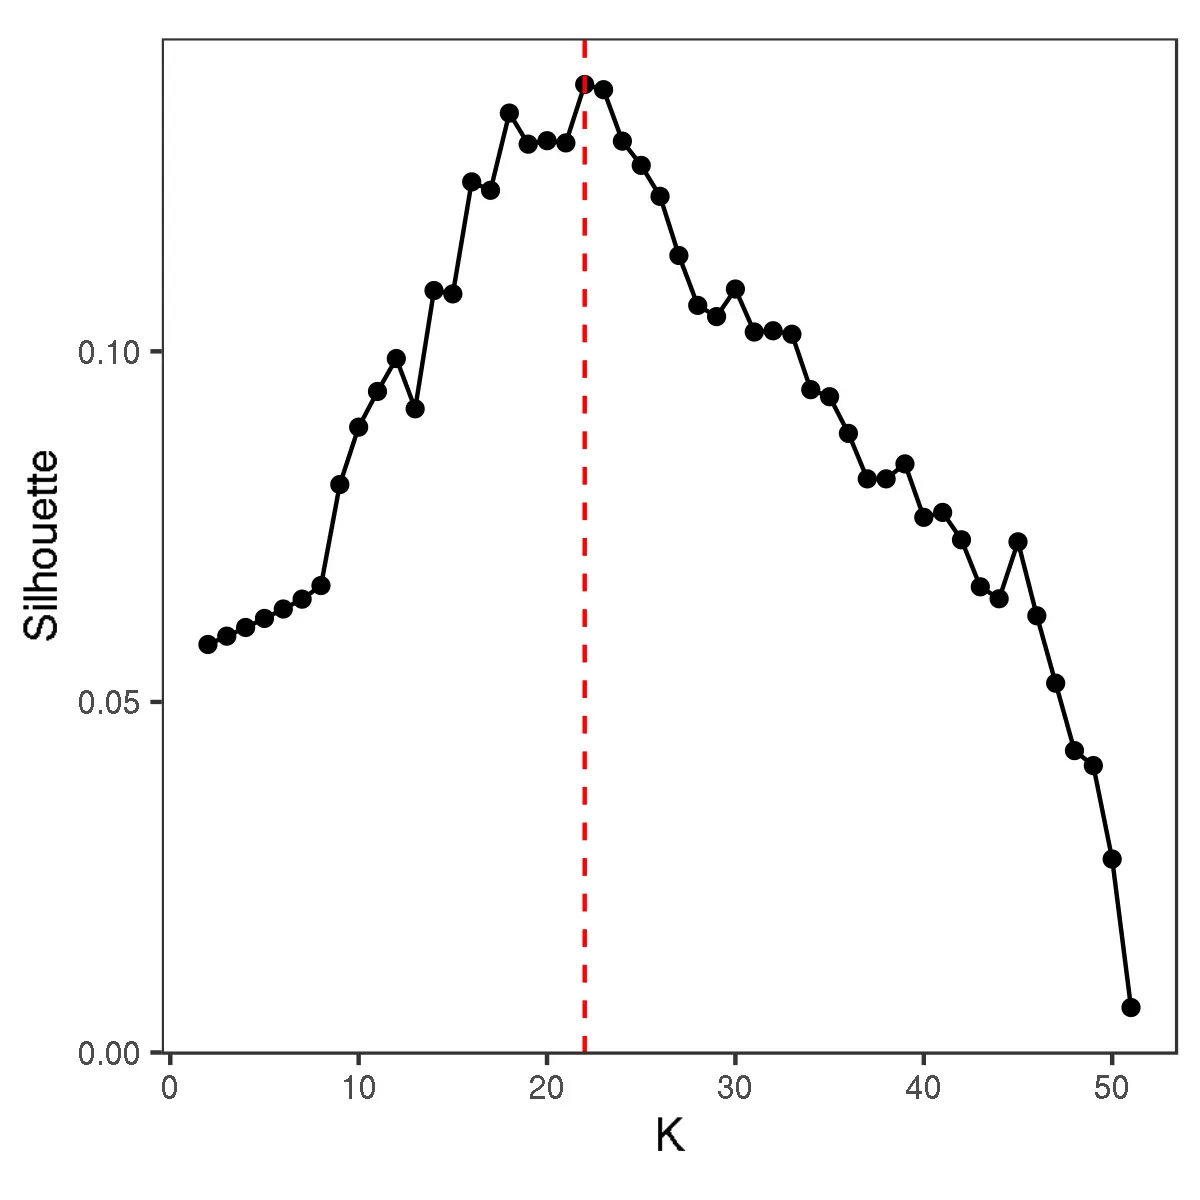
- Plots displaying the Cophenetic coefficient calculated in step 4. The horizontal dotted line indicates the Cophenetic coefficient cutoff provided in the configuration file Cophenetic coefficient cutoff field. The vertical dotted red line indicates the number of states automatically selected based on the Cophenetic coefficient cutoff provided. We recommend that users inspect this file to make sure that the automatic selection provides sensible results. If the user wants to adjust the Cophenetic coefficient cutoff after inspecting this plot, they can rerun the discovery procedure skipping steps 1-3. Please note that these plots indicate the number of states obtained before applying the filters for low-quality states in steps 6 and 7. Therefore, the final results will probably contain fewer states.
knitr::include_graphics("DiscoveryOutput_scRNA/rank_plot.png")
对于每种细胞类型,都会产生以下输出,此处以成纤维细胞为例:
在发现数据集中的样本中,在步骤 6 和 7(如果运行)中的 QC 过滤器之后剩余的细胞状态丰度:
data = read.delim("DiscoveryOutput_scRNA/Fibroblasts/state_abundances.txt")
dim(data)
## [1]    5 1500
head(data[,1:5])
##     SMC01.T_AAAGTAGAGTGGTAGC SMC01.T_ACACCCTGTTGGTAAA SMC01.T_ACATCAGTCGCCTGAG
## S01             2.074345e-14             4.262766e-02             1.352784e-14
## S02             2.074345e-14             3.332167e-01             3.957569e-01
## S03             2.781436e-02             1.204917e-02             1.706085e-01
## S04             2.074345e-14             9.441681e-13             1.352784e-14
## S05             2.074345e-14             6.121064e-01             7.391235e-02
##     SMC01.T_ACTATCTAGCTAGTCT SMC01.T_ACTGATGAGCACCGCT
## S01             5.529717e-02             1.022447e-14
## S02             2.081811e-14             1.805516e-01
## S03             3.519208e-02             6.787254e-01
## S04             2.081811e-14             1.022447e-14
## S05             2.081811e-14             7.112757e-02
Assignment of samples in the discovery dataset to the cell state with the highest abundance. Only samples assigned to the cell states remaining after the QC filters in steps 6 and 7 (if run) are included. The remaining ones are considered unassigned and removed from this table:
data = read.delim("DiscoveryOutput_scRNA/Fibroblasts/state_assignment.txt")
dim(data)
## [1] 899   3
head(data)
##                           ID State InitialState
## 723 SMC15.T_CATCGAAGTGACCAAG   S01         IS05
## 724 SMC18.T_CTTGGCTCAGTGACAG   S01         IS05
## 725 SMC24.T_TACTTACAGCGCCTTG   S01         IS05
## 726 SMC01.N_CACCAGGCAATAAGCA   S01         IS05
## 727 SMC02.N_AGAGCTTTCTAACCGA   S01         IS05
## 728 SMC02.N_ATAACGCCAATACGCT   S01         IS05
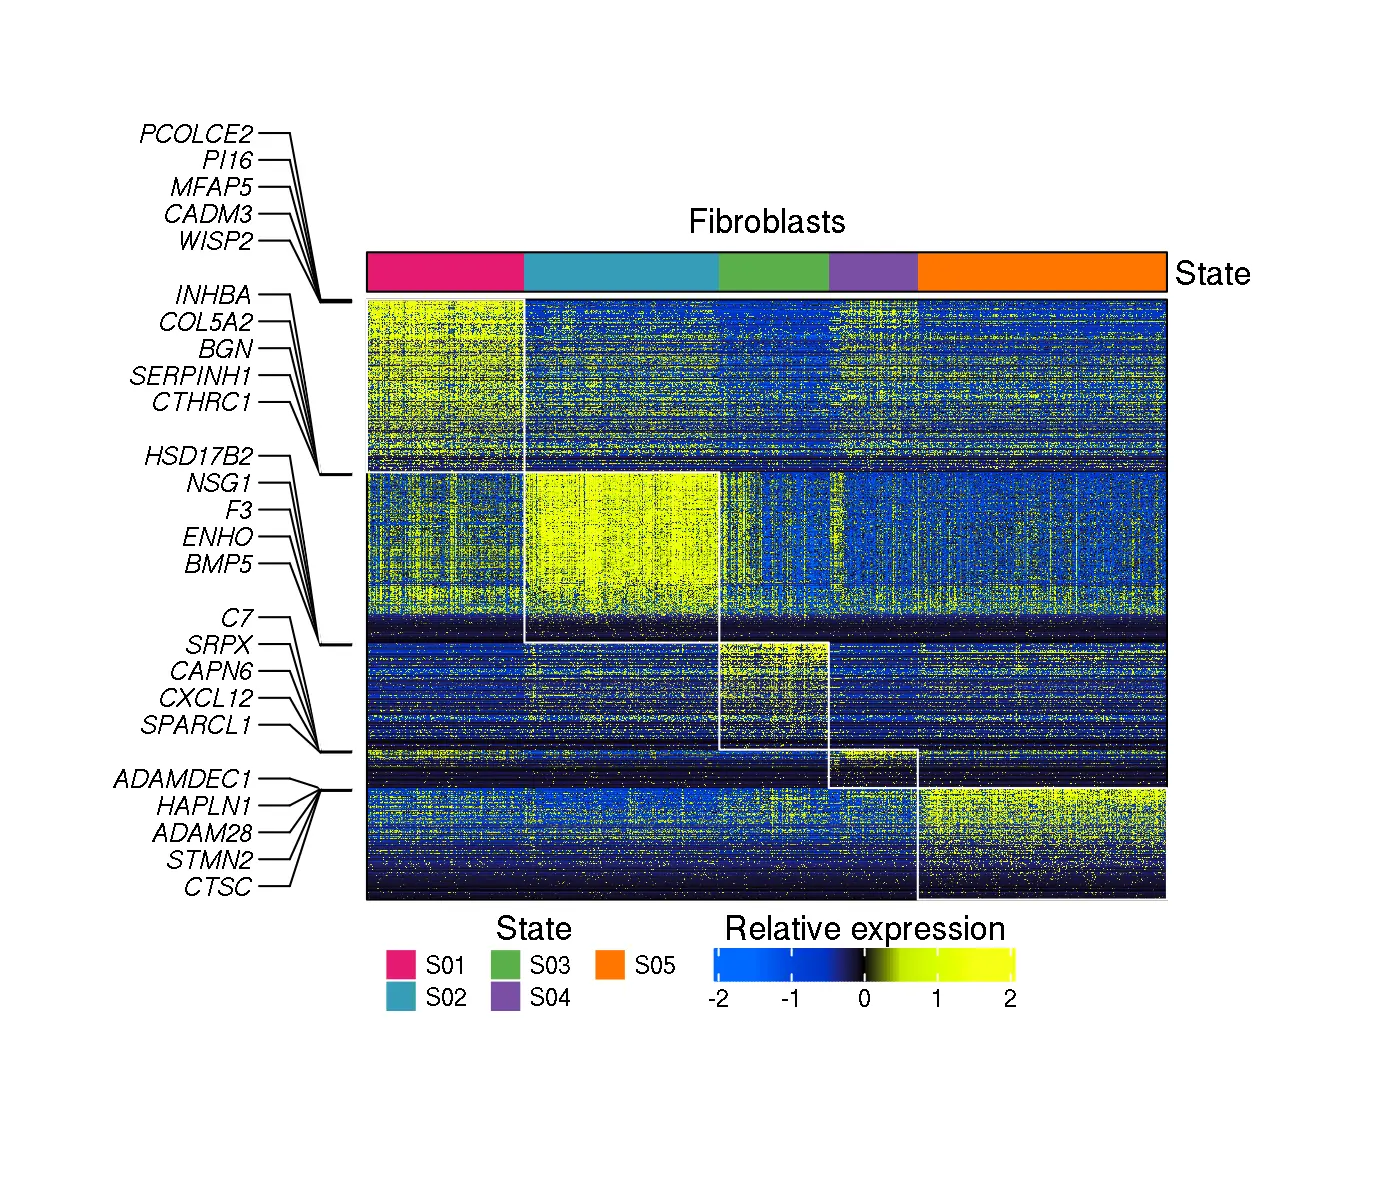
A heatmap illustrating the expression of genes used for cell state discovery, that have the highest fold-change in one of the cell states remaining after the QC filters in steps 6 and 7 (if run). In the current example, the heatmap includes in the top color bar two rows corresponding to Tissue and Histology, that have been provided in configuration file field Annotation file column(s) to plot, in addition to cell state labels always plotted:
knitr::include_graphics("DiscoveryOutput_scRNA/Fibroblasts/state_assignment_heatmap.png")
The ecotype output files include:
The cell state composition of each ecotype (the set of cell states making up each ecotype):
ecotypes = read.delim("DiscoveryOutput_scRNA/Ecotypes/ecotypes.txt")
head(ecotypes[,c("CellType", "State", "Ecotype")])
##                    CellType State Ecotype
## 1                   B.cells   S02      E1
## 2               CD4.T.cells   S02      E1
## 3               CD8.T.cells   S01      E1
## 4           Dendritic.cells   S03      E1
## 5               Fibroblasts   S05      E1
## 6 Monocytes.and.Macrophages   S03      E1
The number of initial clusters obtained by clustering the Jaccard index matrix, selected using the average silhouette:
knitr::include_graphics("DiscoveryOutput_scRNA/Ecotypes/nclusters_jaccard.png")
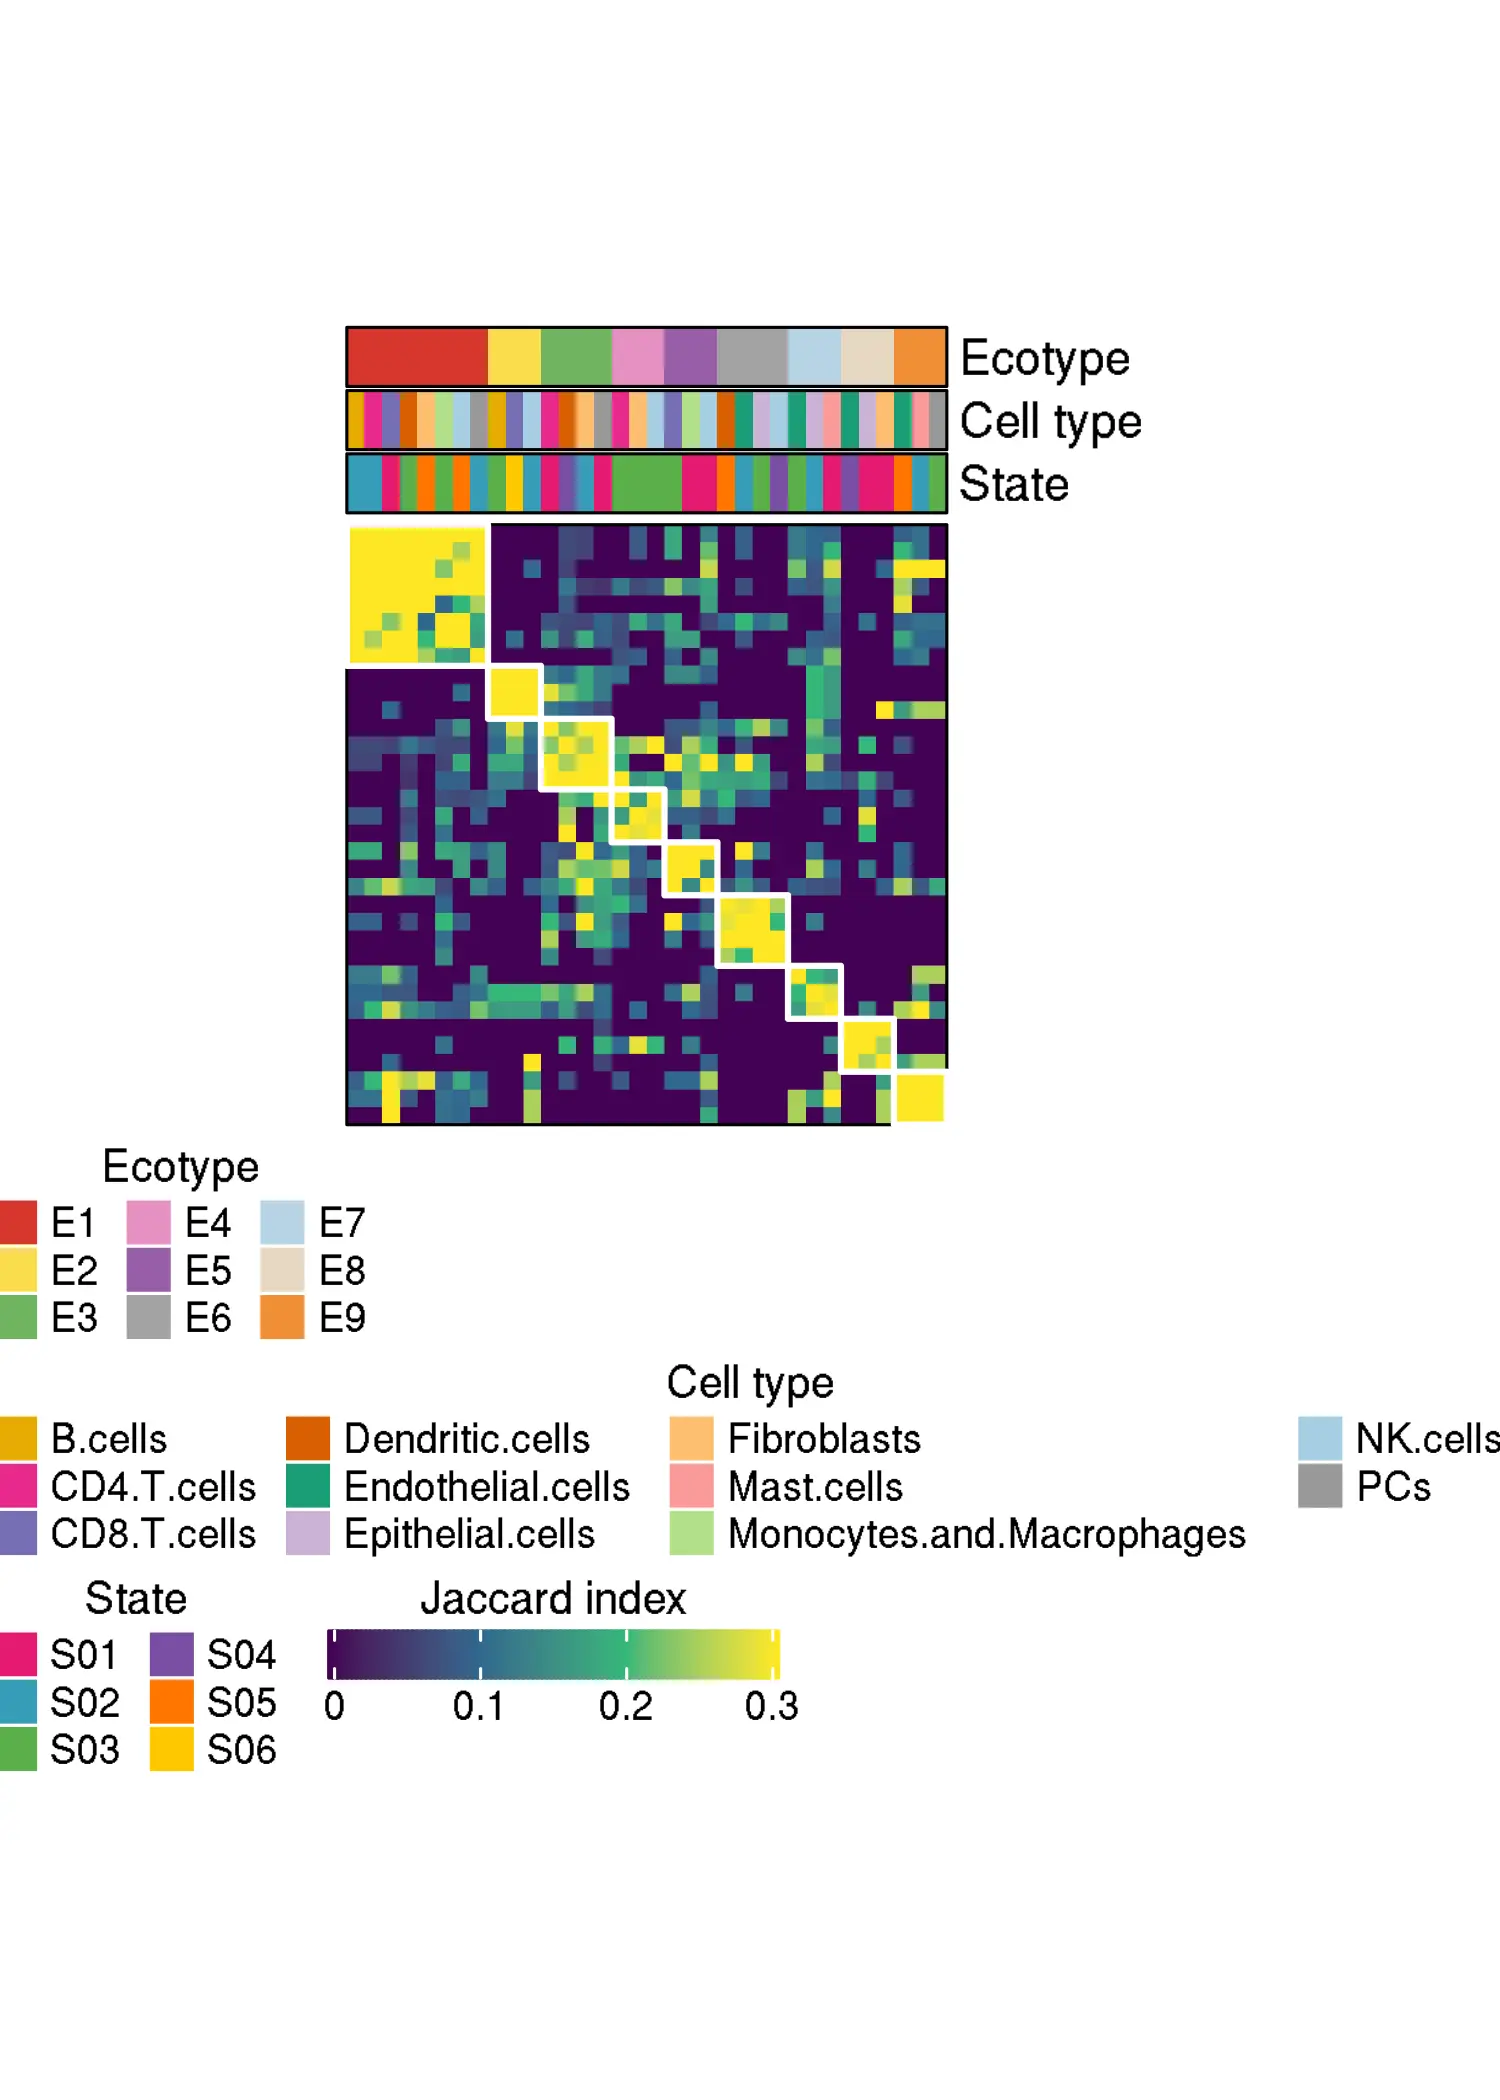
A heatmap of the Jaccard index matrix, after filtering ecotypes with less than 3 cell states:
knitr::include_graphics("DiscoveryOutput_scRNA/Ecotypes/jaccard_matrix.png")
The abundance of each ecotype in each sample in the discovery dataset::
The abundance of each ecotype in each sample in the discovery dataset:
abundances = read.delim("DiscoveryOutput_scRNA/Ecotypes/ecotype_abundance.txt")
dim(abundances)
## [1]  9 33
head(abundances[,1:5])
##       SMC01.N    SMC01.T    SMC02.N    SMC02.T    SMC03.N
## E1 0.34064095 0.07302366 0.20329837 0.02049678 0.27718758
## E2 0.06078240 0.17093342 0.02937202 0.10322721 0.05241208
## E3 0.02315383 0.34562878 0.01355632 0.36202739 0.01278497
## E4 0.13787420 0.12543986 0.14604672 0.16681631 0.06725426
## E5 0.16081886 0.10434607 0.28980392 0.11903111 0.14459666
## E6 0.00000000 0.07347385 0.03524642 0.14282270 0.00000000
The assignment of samples in the discovery dataset to ecotypes. The samples not assigned to any ecotype are filtered out from this file:
assignments = read.delim("DiscoveryOutput_scRNA/Ecotypes/ecotype_assignment.txt")
dim(assignments)
## [1] 32  6
head(assignments[,1:5])
##              ID MaxEcotype  AssignmentP  AssignmentQ AssignedToEcotypeStates
## SMC01-N SMC01-N         E1 1.938649e-04 0.0012795085                    TRUE
## SMC05-N SMC05-N         E1 5.000404e-03 0.0183348142                    TRUE
## SMC05-T SMC05-T         E1 7.568441e-02 0.1541417608                    TRUE
## SMC07-N SMC07-N         E1 2.928585e-03 0.0138061877                    TRUE
## SMC08-N SMC08-N         E1 9.015769e-05 0.0007438009                    TRUE
## SMC19-T SMC19-T         E1 5.936002e-03 0.0195888071                    TRUE
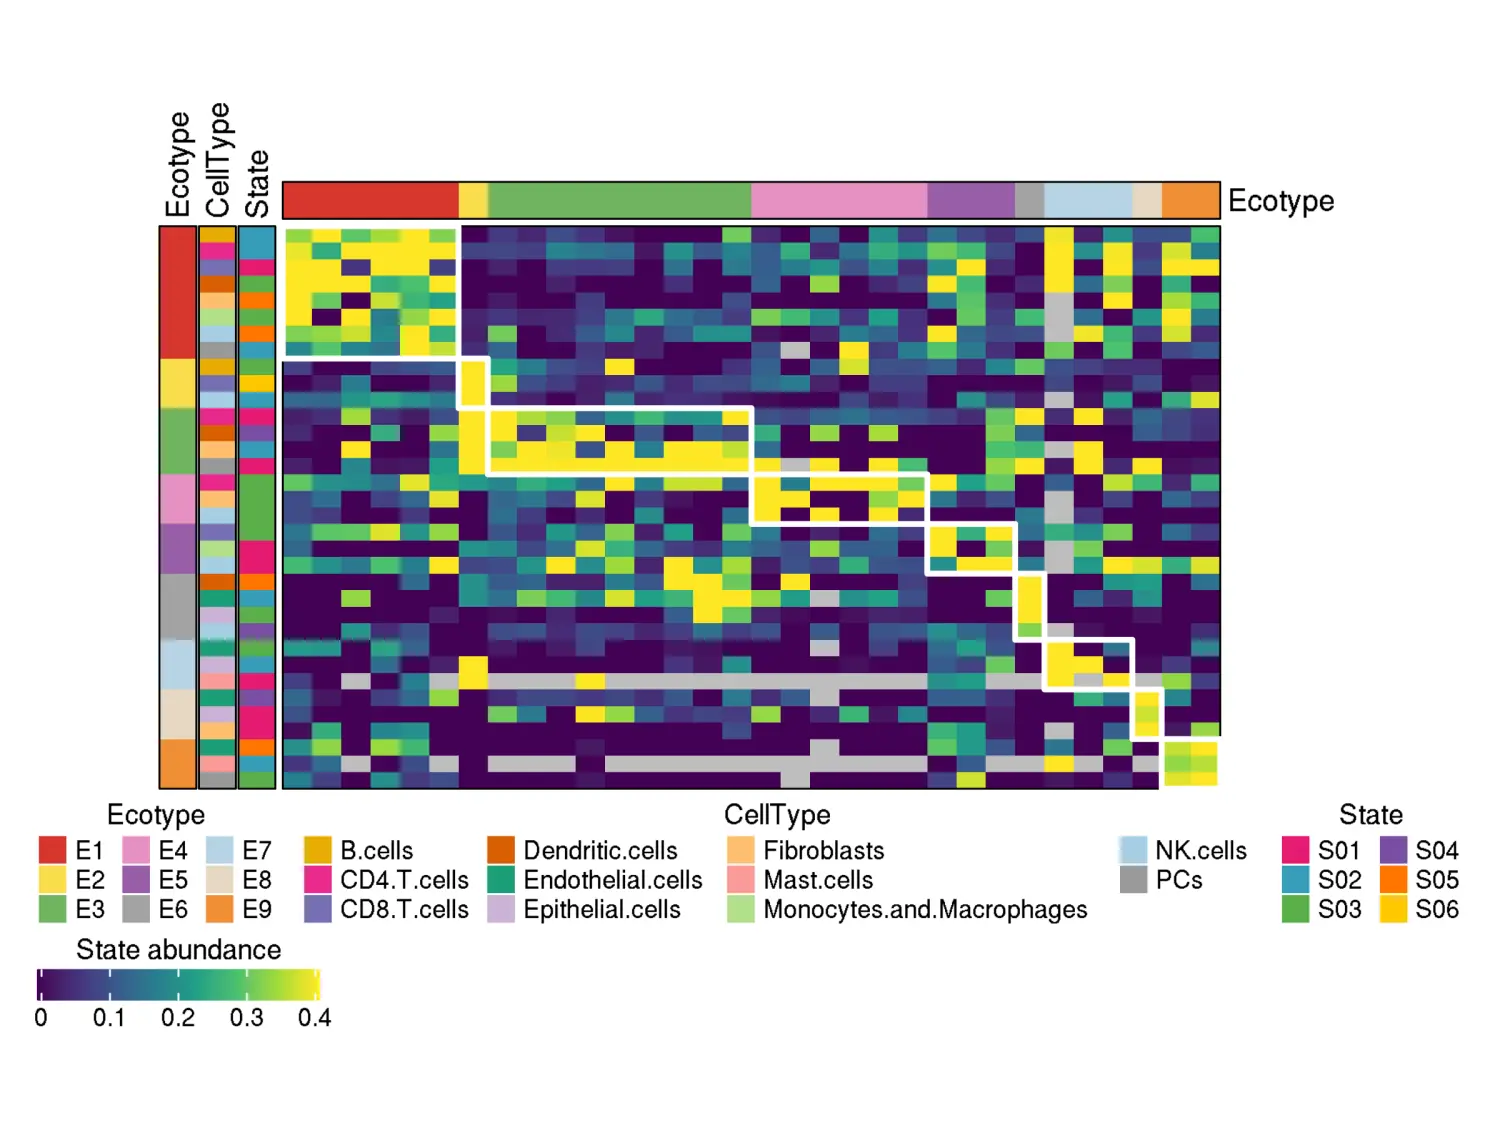
A heatmap of cell state fractions across the samples assigned to ecotypes:
knitr::include_graphics("DiscoveryOutput_scRNA/Ecotypes/heatmap_assigned_samples_viridis.png")
当然,方法还是很不错的,如果有配套的单细胞空间数据,用一下这个方法寻找细胞状态和生态型,还是非常给力的,参考网址在EcoTyper
生活很好,有你更好


 被折叠的 条评论
为什么被折叠?
被折叠的 条评论
为什么被折叠?
 到【灌水乐园】发言


