


1.下载elasticsearch_exporter
wget 下载二进制包并解压、运行:
tar -xvf elasticsearch_exporter-1.3.0.linux-amd64.tar.gz
mv elasticsearch_exporter-1.3.0.linux-amd64/ elasticsearch_exporter
cd elasticsearch_exporter
2.运行elasticsearch_exporter:
nohup ./elasticsearch_exporter --es.all --es.indices --es.cluster_settings --es.indices_settings --es.shards --es.snapshots --es.timeout=10s --web.listen-address=":9114" --web.telemetry-path="/metrics" --es.uri http://elastic:FtBMPT31rPiQ@192.168.2.40:9200 &
(uri中要写成自己es的用户和密码)
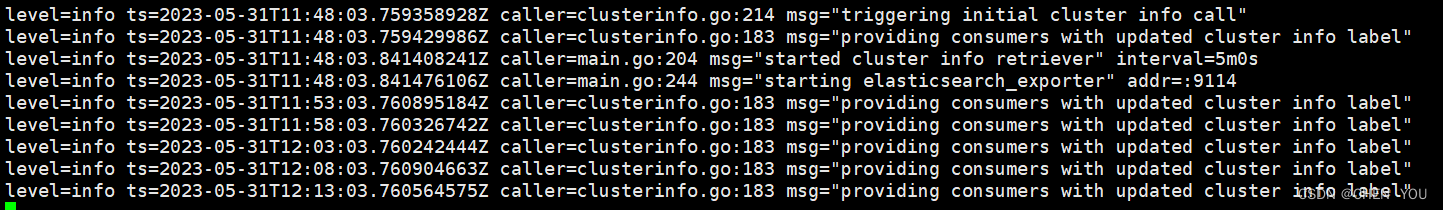
查看输出日志:
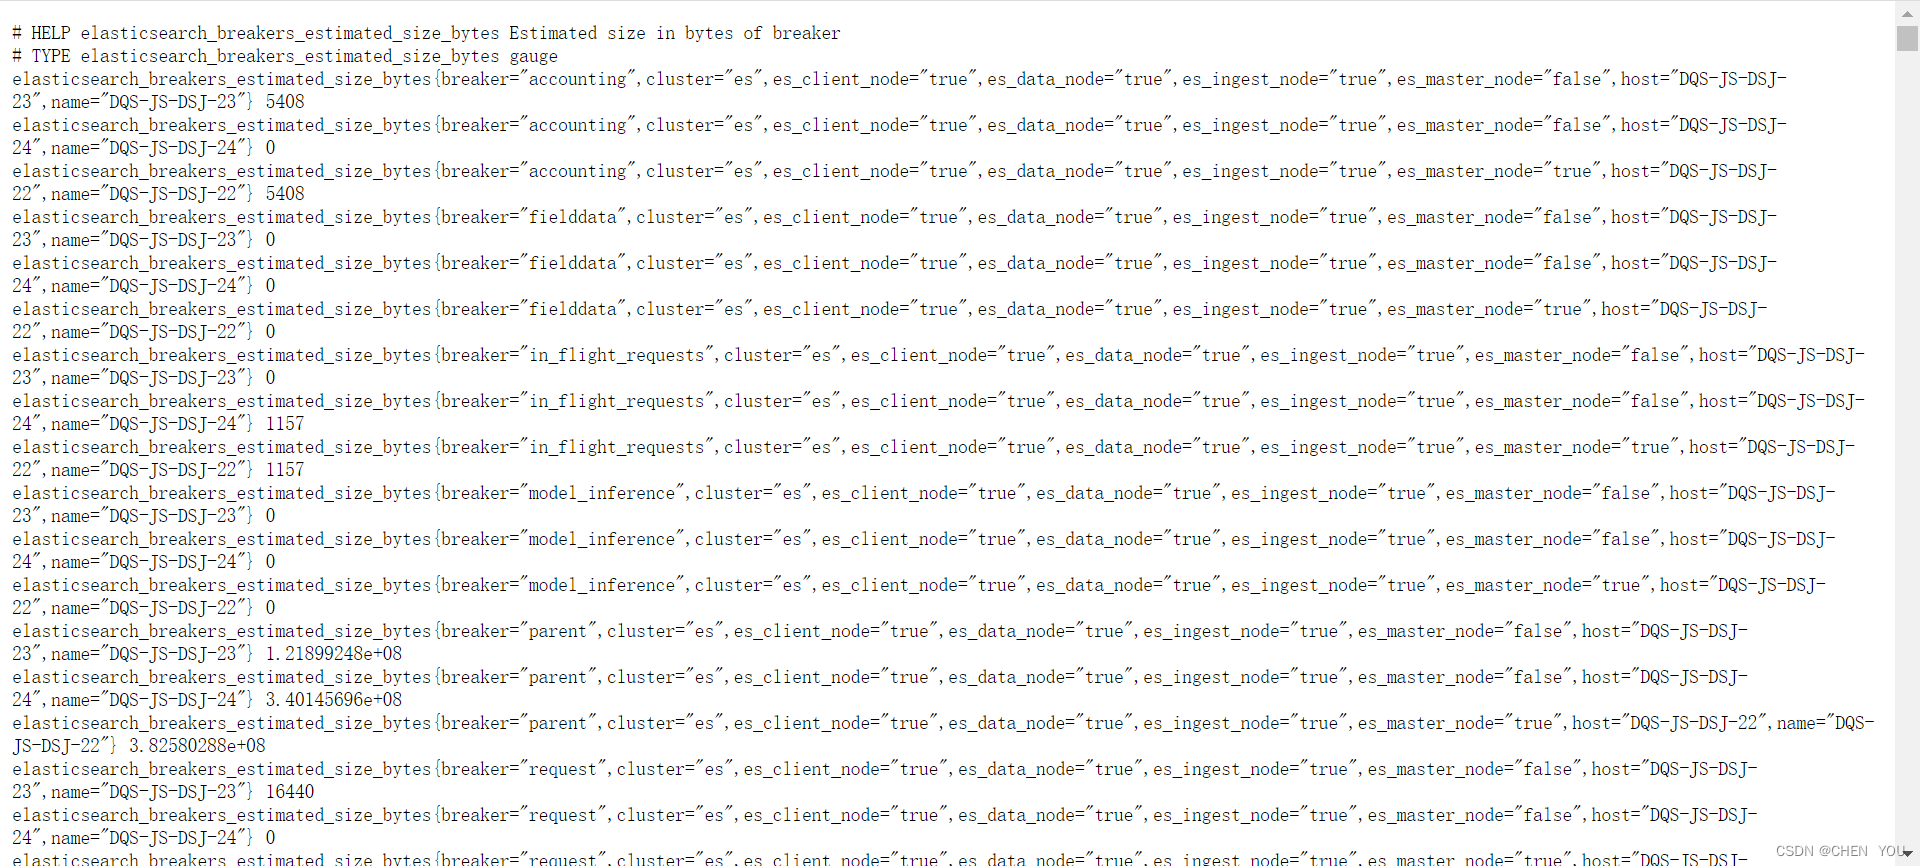
3.看指标信息:
web 访问
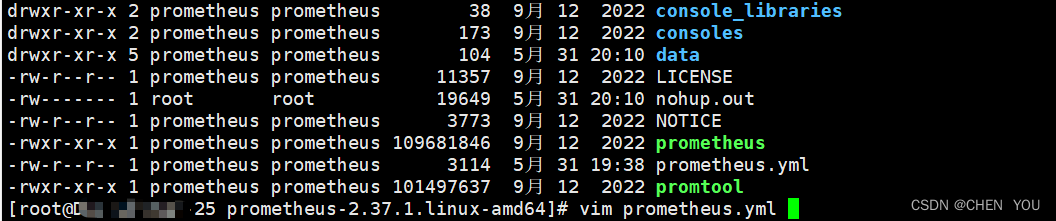
4.启动好后来prometheus添加配置
编辑prometheus.yml
- job_name: "es"
static_configs:
- targets: ["192.168.2.40:9114"]
- targets: ["192.168.2.41:9114"]
- targets: ["192.168.2.42:9114"]
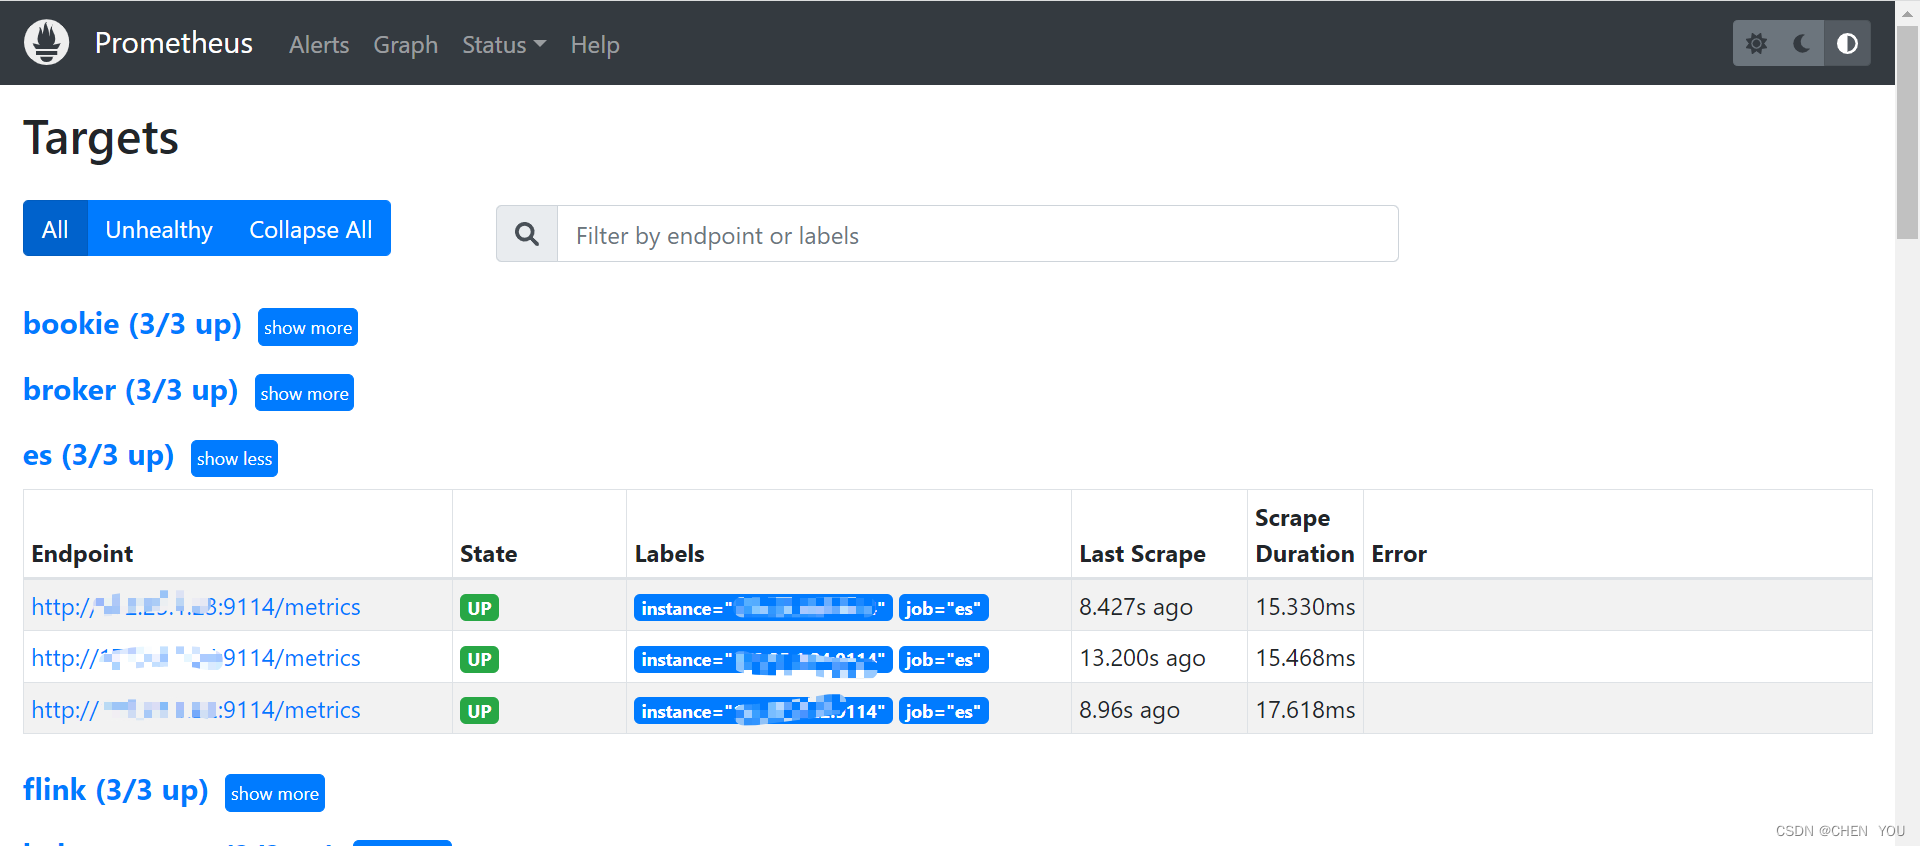
5. 登录prometheus http://192.168.2.xx:9090/上
6.配置完成后在Grafana官网中下载es的监控模板 Dashboards | Grafana Labs 下载es的模板
https://grafana.com/grafana/dashboards/14191-elasticsearch-overview/
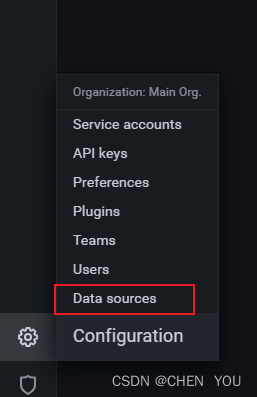
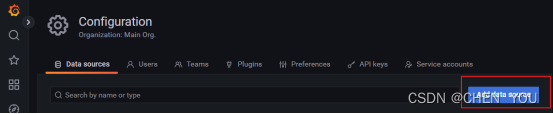
7.添加Prometheus 数据源
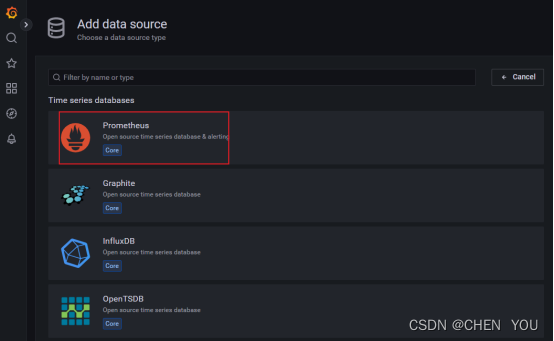
8.选择 Prometheus
9.导入监控 Dashboard 模板

10.查看指标信息是否有数据
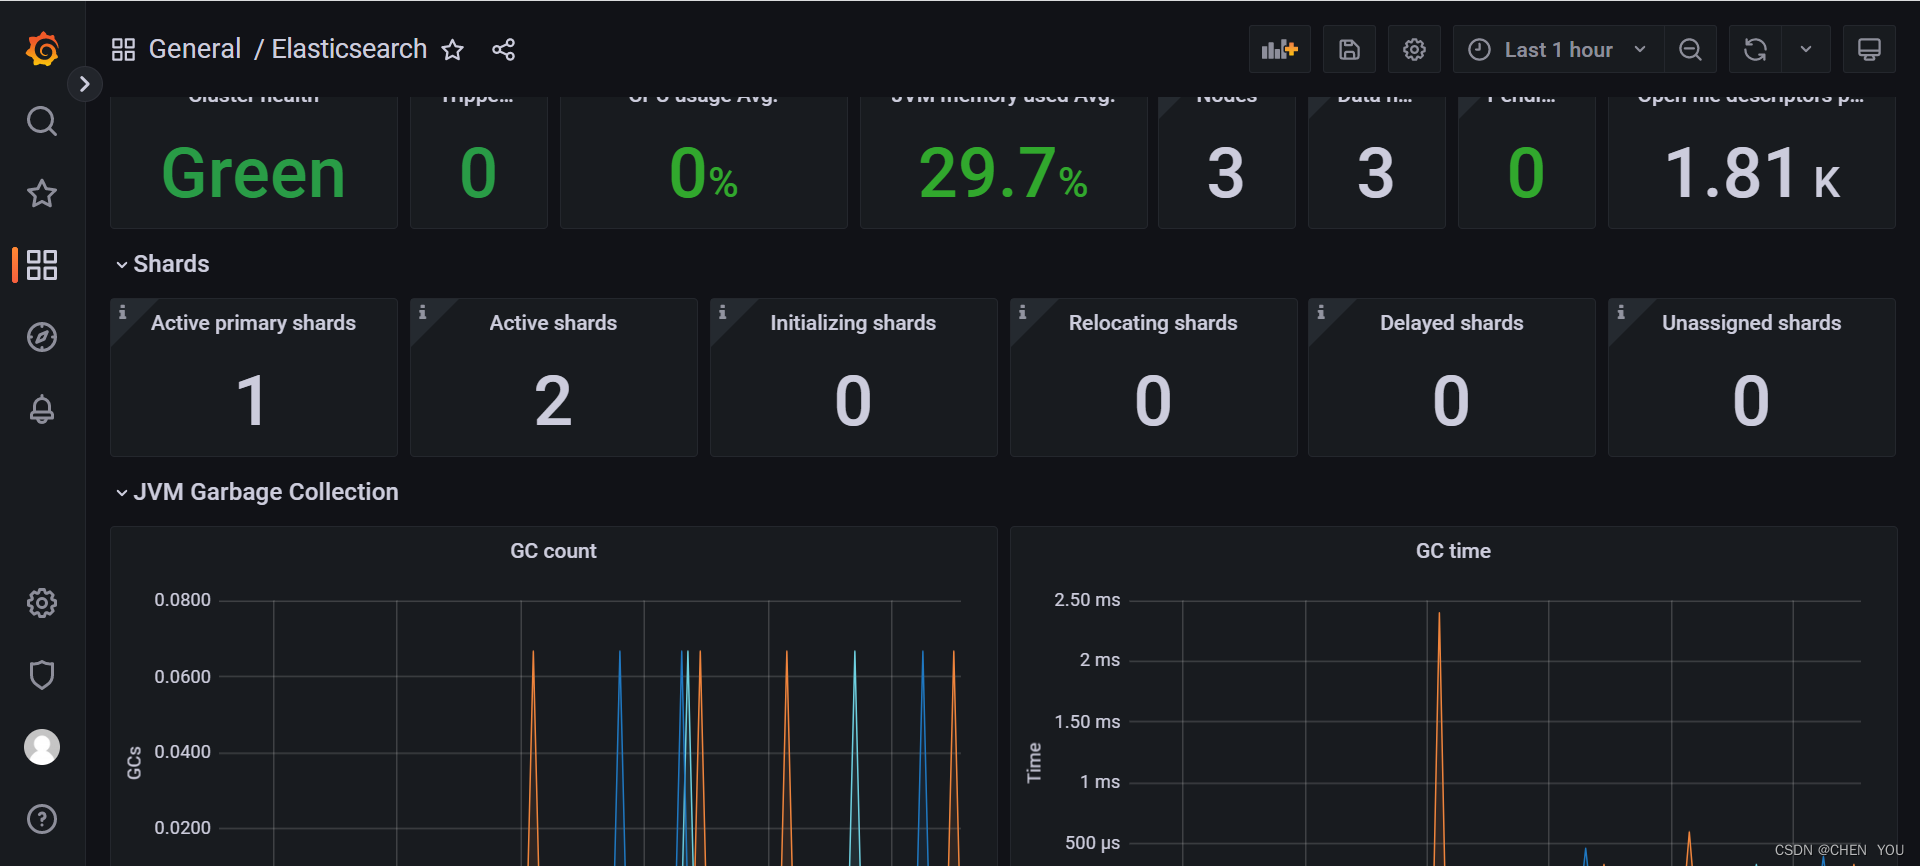
至此,配置完成!


 3126
3126


 被折叠的 条评论
为什么被折叠?
被折叠的 条评论
为什么被折叠?
 到【灌水乐园】发言


