


本篇介绍一些关于多图层栅格数据的处理方法。在此之前,先定义3个单图层的栅格对象:
library(raster)
a <- raster(vals = 1:9, nrows = 3, ncols = 3)
b <- raster(vals = 9:1, nrows = 3, ncols = 3)
c <- raster(vals = c(1,3,5,7,9,7,5,3,1), nrows = 3, ncols = 3)

par(mfcol = c(1,3))
plot(a)
plot(b)
plot(c)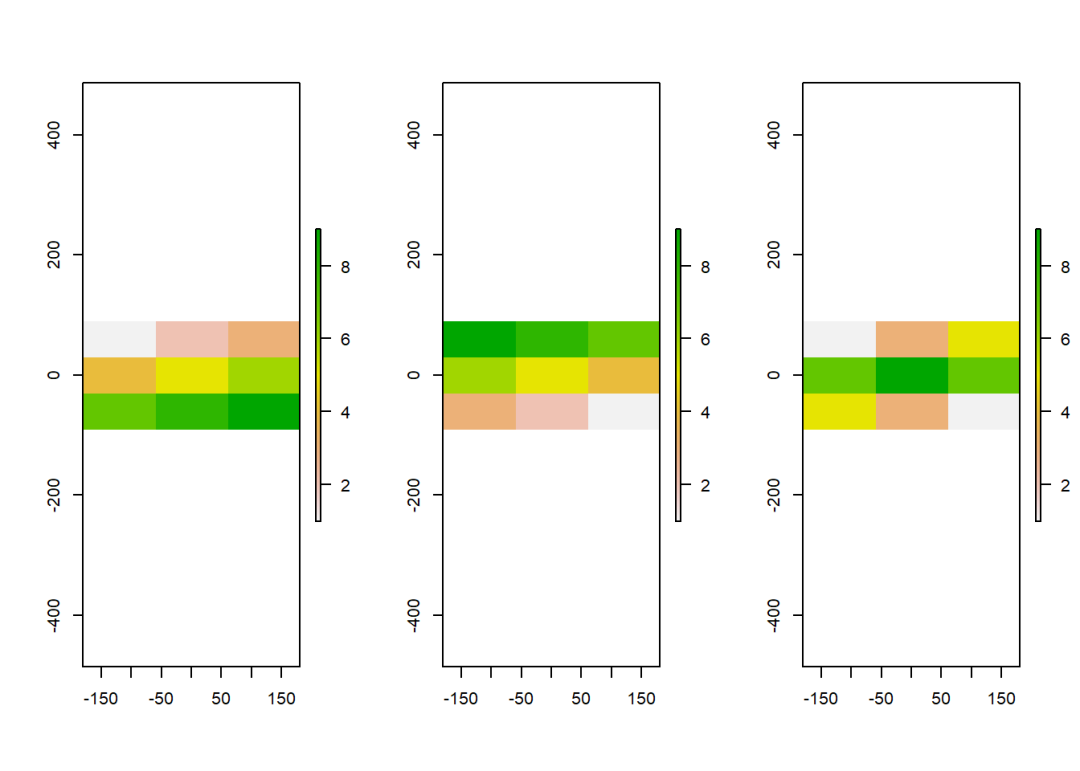
堆栈
多图层的栅格对象可以由两个以上的单图层栅格数据堆栈而成,这些单图层对象的空间范围和精度必须一致。
堆栈函数有stack()和brick()两个,它们在图层存储方式上存在区别,相比之下,后者更加高效。
m <- brick(a,b,c)
m1 <- stack(a,b,c)

object.size(m)
## 14568 bytes

object.size(m1)
## 46840 bytes
可以看出,
m1的大小远远大于m。
多图层对象的维度(dimensions)相比于单图层对象,多了个nlayers,用于记录图层的数目:
a
## class      : RasterLayer
## dimensions : 3, 3, 9  (nrow, ncol, ncell)
## resolution : 120, 60  (x, y)
## extent     : -180, 180, -90, 90  (xmin, xmax, ymin, ymax)
## crs        : +proj=longlat +datum=WGS84 +no_defs
## source     : memory
## names      : layer
## values     : 1, 9  (min, max)

m
## class      : RasterBrick
## dimensions : 3, 3, 9, 3  (nrow, ncol, ncell, nlayers)
## resolution : 120, 60  (x, y)
## extent     : -180, 180, -90, 90  (xmin, xmax, ymin, ymax)
## crs        : +proj=longlat +datum=WGS84 +no_defs
## source     : memory
## names      : layer.1, layer.2, layer.3
## min values :       1,       1,       1
## max values :       9,       9,       9
plot(m)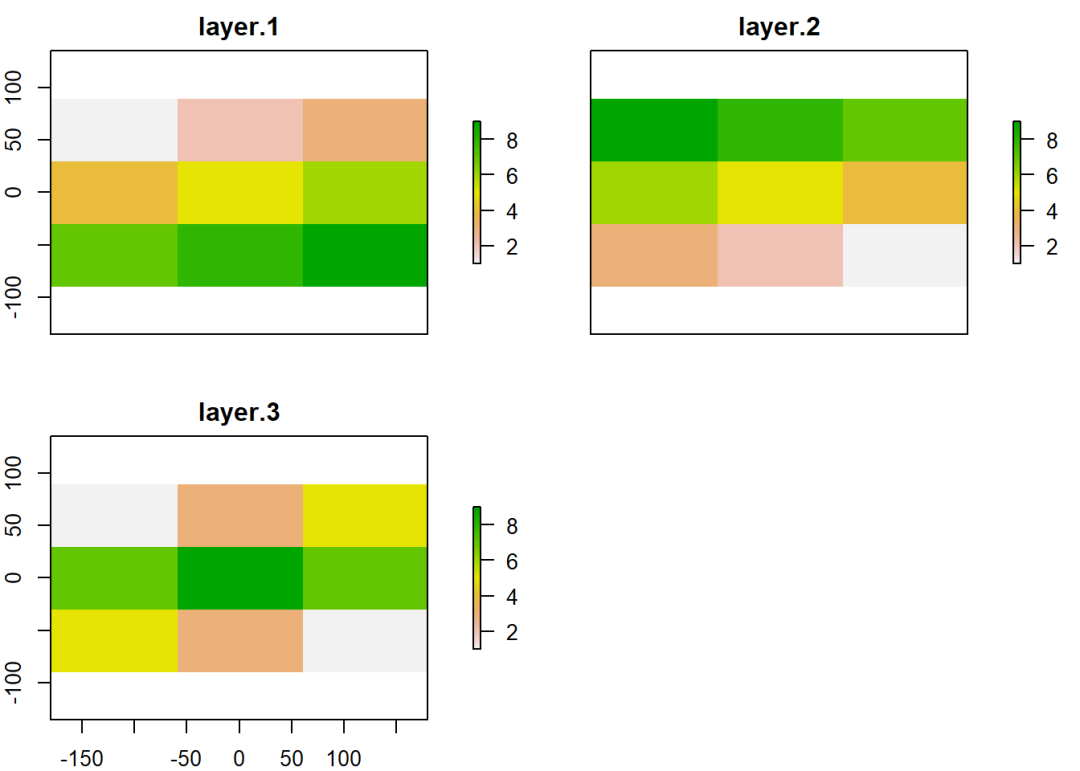
图层命名
在前面的代码中,3个单图层对象的变量名分别为a、b、c,但是变量名并不能等同于图层的名称。目前,它们的图层名依然是默认的layer:
names(a)
## [1] "layer"
多图层对象的图层名称则继承自对应的单图层对象,若存在重复名,则使用数字后缀进行区分:
names(m)
## [1] "layer.1" "layer.2" "layer.3"names()函数除了可以查询图层名称外,还可以对其进行更改:
names(a) <- "a"
a
## class      : RasterLayer
## dimensions : 3, 3, 9  (nrow, ncol, ncell)
## resolution : 120, 60  (x, y)
## extent     : -180, 180, -90, 90  (xmin, xmax, ymin, ymax)
## crs        : +proj=longlat +datum=WGS84 +no_defs
## source     : memory
## names      : a
## values     : 1, 9  (min, max)

names(m) <- c("a", "b", "c")
m
## class      : RasterBrick
## dimensions : 3, 3, 9, 3  (nrow, ncol, ncell, nlayers)
## resolution : 120, 60  (x, y)
## extent     : -180, 180, -90, 90  (xmin, xmax, ymin, ymax)
## crs        : +proj=longlat +datum=WGS84 +no_defs
## source     : memory
## names      : a, b, c
## min values : 1, 1, 1
## max values : 9, 9, 9
查询提取
若要查询多图层栅格对象的某一个或多个图层,使用的操作符是双中括号[[]],类似于列表结构的元素查询操作;若要查询图层像元对应的变量值,使用的操作符是单中括号[],类似于矩阵或数据框的元素查询操作。
m[[1]]
## class      : RasterLayer
## dimensions : 3, 3, 9  (nrow, ncol, ncell)
## resolution : 120, 60  (x, y)
## extent     : -180, 180, -90, 90  (xmin, xmax, ymin, ymax)
## crs        : +proj=longlat +datum=WGS84 +no_defs
## source     : memory
## names      : a
## values     : 1, 9  (min, max)
本行代码得到的是一个单图层栅格对象,即
a。
m[[c(1,2)]]
## class      : RasterBrick
## dimensions : 3, 3, 9, 2  (nrow, ncol, ncell, nlayers)
## resolution : 120, 60  (x, y)
## extent     : -180, 180, -90, 90  (xmin, xmax, ymin, ymax)
## crs        : +proj=longlat +datum=WGS84 +no_defs
## source     : memory
## names      : a, b
## min values : 1, 1
## max values : 9, 9
本行代码得到的是一个多图层栅格对象,由
m的前两个图层组成。
m[2,3]
##      a b c
## [1,] 6 4 7
本行代码得到的是一个矩阵,由
m的三个图层在坐标(2,3)处的数值组成。
m[[1]][2,3]
## [1] 6
本行代码得到的是一个数值,是
m第一个图层在坐标(2,3)处的数值。
查询图层也可以使用$操作符,后面跟的是对应的图层名称:
m$a
## class      : RasterLayer
## dimensions : 3, 3, 9  (nrow, ncol, ncell)
## resolution : 120, 60  (x, y)
## extent     : -180, 180, -90, 90  (xmin, xmax, ymin, ymax)
## crs        : +proj=longlat +datum=WGS84 +no_defs
## source     : memory
## names      : a
## values : 1, 9 (min, max)还可以使用raster()函数的layer参数:
raster(m, layer = 2)
## class      : RasterLayer
## dimensions : 3, 3, 9  (nrow, ncol, ncell)
## resolution : 120, 60  (x, y)
## extent     : -180, 180, -90, 90  (xmin, xmax, ymin, ymax)
## crs        : +proj=longlat +datum=WGS84 +no_defs
## source     : memory
## names      : b
## values : 1, 9 (min, max)需要注意的是,上述方法只能查询一个图层,因为layer参数为向量时实际上只有第一个元素起作用。类似的方法,subset()函数就可以查询多个图层,此时得到的也是一个多图层对象:
subset(m, c(2,3))
## class      : RasterBrick
## dimensions : 3, 3, 9, 2  (nrow, ncol, ncell, nlayers)
## resolution : 120, 60  (x, y)
## extent     : -180, 180, -90, 90  (xmin, xmax, ymin, ymax)
## crs        : +proj=longlat +datum=WGS84 +no_defs
## source     : memory
## names      : b, c
## min values : 1, 1
## max values : 9, 9在使用raster()函数读取本地的多图层栅格对象时,需要通过band参数指定图层,默认情况下读取的是第一个图层,即band = 1:
writeRaster(m, filename = "m.tif", format = 'GTiff', overwrite = TRUE)
raster("m.tif")
## class      : RasterLayer
## band       : 1  (of  3  bands)
## dimensions : 3, 3, 9  (nrow, ncol, ncell)
## resolution : 120, 60  (x, y)
## extent     : -180, 180, -90, 90  (xmin, xmax, ymin, ymax)
## crs        : +proj=longlat +datum=WGS84 +no_defs
## source     : m.tif
## names      : m
## values     : 1, 9  (min, max)

raster("m.tif", band = 2)
## class      : RasterLayer
## band       : 2  (of  3  bands)
## dimensions : 3, 3, 9  (nrow, ncol, ncell)
## resolution : 120, 60  (x, y)
## extent     : -180, 180, -90, 90  (xmin, xmax, ymin, ymax)
## crs        : +proj=longlat +datum=WGS84 +no_defs
## source     : m.tif
## names      : m
## values     : 1, 9  (min, max)
增删图层
addLayer()可以向已有的多图层对象再添加图层:
m2 <- addLayer(m, a, a, a)
m2
## class      : RasterStack
## dimensions : 3, 3, 9, 6  (nrow, ncol, ncell, nlayers)
## resolution : 120, 60  (x, y)
## extent     : -180, 180, -90, 90  (xmin, xmax, ymin, ymax)
## crs        : +proj=longlat +datum=WGS84 +no_defs
## names      : a.1, b, c, a.2, a.3, a.4
## min values :   1, 1, 1,   1,   1,   1
## max values : 9, 9, 9, 9, 9, 9dropLayer()函数可以删除已有多图层对象的某些图层
m3 <- dropLayer(m2, c(2,3))
m3
## class      : RasterStack
## dimensions : 3, 3, 9, 4  (nrow, ncol, ncell, nlayers)
## resolution : 120, 60  (x, y)
## extent     : -180, 180, -90, 90  (xmin, xmax, ymin, ymax)
## crs        : +proj=longlat +datum=WGS84 +no_defs
## names      : a.1, a.2, a.3, a.4
## min values :   1,   1,   1,   1
## max values :   9,   9,   9,   9
stackApply()函数
stackApply()是一个针对多图层栅格对象进行分组计算的函数,它的语法结构如下:
stackApply(x, indices, fun,
           filename = '',
           na.rm = TRUE, ...)
x:多图层栅格对象;
indices:分组参数;向量结构,长度与图层数相同,若低于图层数,则循环使用;元素位置与图层位置相对应;数值相同的图层对应同一分组。
fun:计算函数;输出值须为单值。
计算三个图层的平均值:
x1 <- stackApply(m, indices = 1, fun = mean)
plot(x1)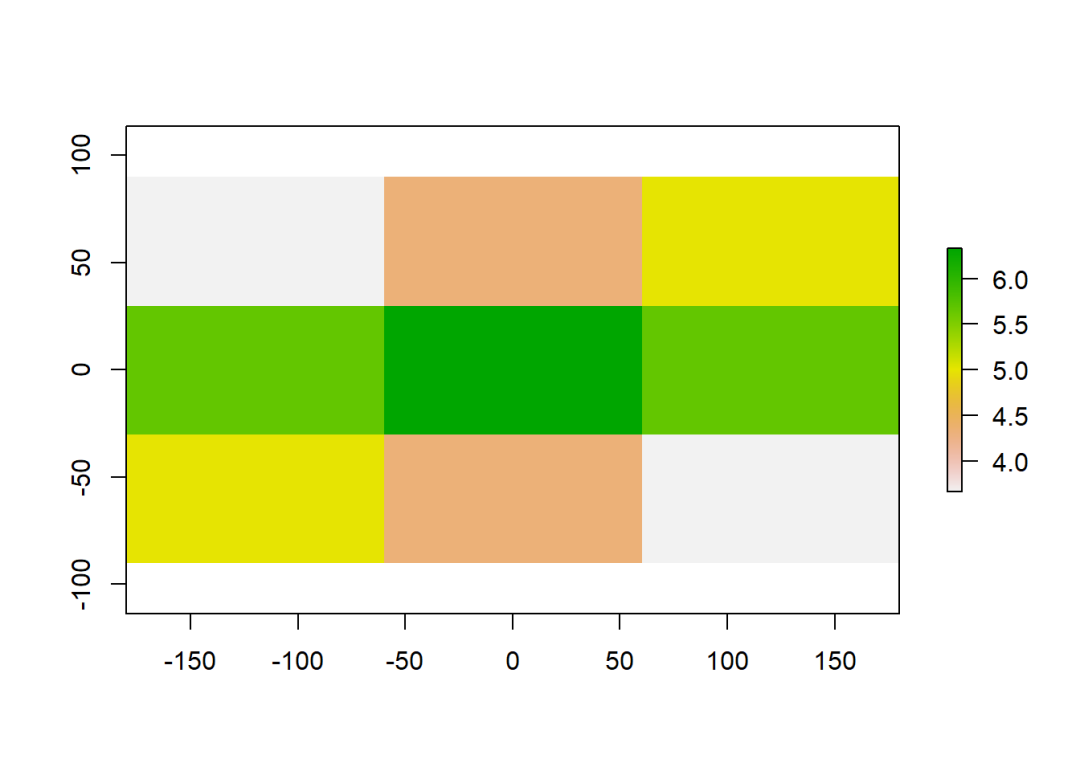
m2 <- addLayer(m, a, a, a)
x2 <- stackApply(m2, indices = c(1,2,3), fun = sum)
plot(x2)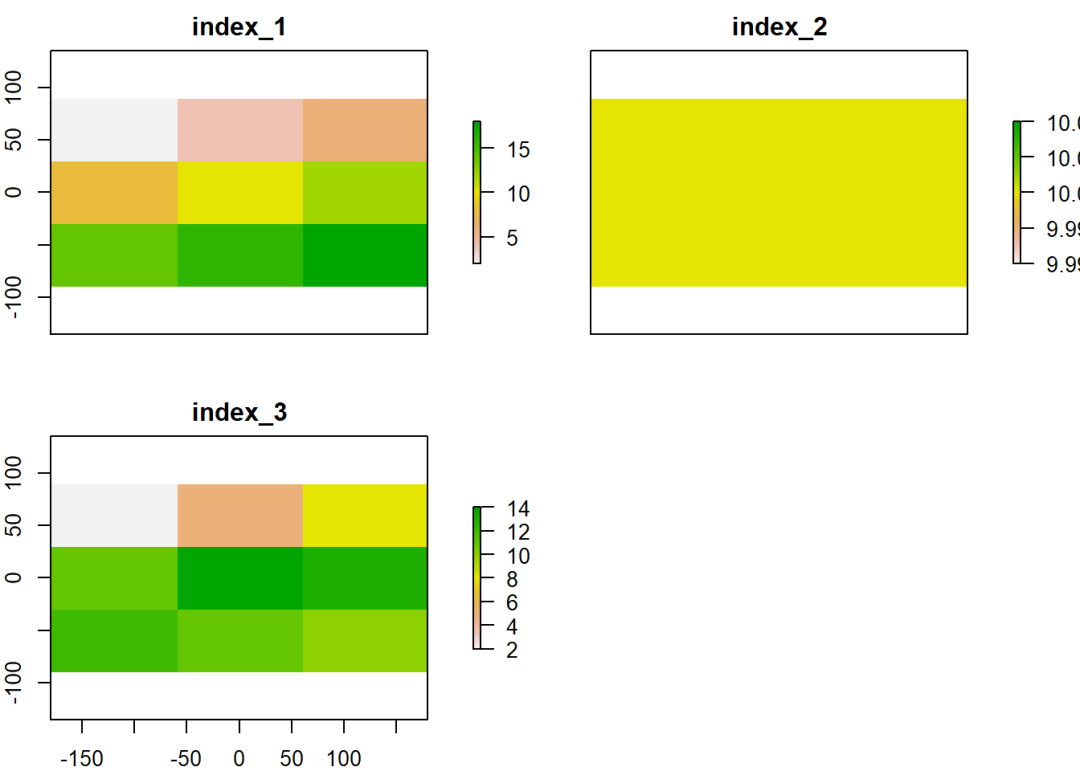


 1万+
1万+

 被折叠的 条评论
为什么被折叠?
被折叠的 条评论
为什么被折叠?
 到【灌水乐园】发言


