


1. 创建基础的网络地图:预览效果:基本网络地图

<!DOCTYPE html>
<html>
<head>
<meta name="viewport" content="width=device-width,
initial-scale=1.0, maximum-scale=1.0, user-scalable=no">
<title>基础网络地图</title>
<!-- More content will go here -->
<link rel="stylesheet" href="css/leaflet.css">
<script src="js/leaflet.js"></script>
<style>
body {
padding: 0;
margin: 0;
}
html,
body,
#map {
height: 100%;
width: 100%;
}
.legend {
font-size: 16px;
line-height: 24px;
color: #333333;
font-family: 'Open Sans', Helvetica, sans-serif;
padding: 10px 14px;
background-color: rgba(245, 245, 220, 0.8);
box-shadow: 0 0 15px rgba(0, 0, 0, 0.2);
border-radius: 5px;
max-width: 250px;
border: 1px solid grey;
}
.legend p {
font-size: 16px;
line-height: 24px;
}
.legend img {
max-width: 200px;
margin: auto;
display: block;
}
</style>
</head>
<body>
<!-- More content will go here -->
<div id="map"></div>
<script>
var map = L.map("map", { center: [30.2489634, 120.2052342], zoom: 17 });
L.tileLayer(
"https://{s}.tile.openstreetmap.org/{z}/{x}/{y}.png",
{ attribution: "© OpenStreetMap" }
).addTo(map);
// 添加标记点
L.circleMarker(
[30.2489634, 120.2052342 - 0.001],
{ radius: 50, color: "black", fillColor: "red" }
).addTo(map);
// 设置线段
var line = L.polyline(
[[30.2480698, 120.2079876], [30.2485086, 120.2070000]],
{ color: "red", weight: 10 }
).addTo(map);
// 设置多边形
var pol = L.polygon(
[
[30.2480634, 120.2050078],
[30.2481569, 120.2058555],
[30.2482589, 120.2065236],
[30.2488098, 120.2053874]
],
{ color: "red", fillColor: "yellow", weight: 4 }
).addTo(map);
// 添加长方形
//定义一个Bounds 左上角和右下角的坐标
var bounds = [[30.2480634, 120.2050078], [30.2488098, 120.2053874]]
//创建Rectangle
L.rectangle(bounds, { color: '#ff7800', weight: 1 }).addTo(map);
// 设置弹窗
line.bindPopup(
"这是我随意设置的经纬度形成的线段。"
);
// 添加描述
var legend = L.control({ position: "bottomleft" });
legend.onAdd = function (map) {
var div = L.DomUtil.create("div", "legend");
div.innerHTML =
'<p><b>Simple shapes in Leaflet</b></p><hr>' +
'<p>This map shows an example of adding shapes ' +
'on a Leaflet map</p>' +
'The following shapes were added:<br>' +
'<p><ul>' +
'<li>A marker</li>' +
'<li>A line</li>' +
'<li>A polygon</li>' +
'</ul></p>' +
'The line layer has a <b>popup</b>. ' +
'Click on the line to see it!<hr>' +
'Created with the Leaflet library<br>' +
'<img src="images/leaflet.png">';
return div;
};
legend.addTo(map);
var popup = L.popup();
function onMapClick(e) {
popup
.setLatLng(e.latlng)
.setContent(
"你当前点击的地理位置是" +
"<b>经度:</b> " + e.latlng.lng + "<br>" +
"<b>纬度:</b> " + e.latlng.lat
)
.openOn(map);
}
map.on("click", onMapClick);
</script>
</body>
</html>其中css文件来源:https://unpkg.com/leaflet@1.5.1/dist/leaflet.css
其中js文件来源:https://unpkg.com/leaflet@1.5.1/dist/leaflet.js
-
基本概念理解
网络地图通常由一个或多个图层组成。网络地图图层通常可分为两类:
- 背景层或底图,由网格图像或矢量图块的集合组成,通常是通用的,不是专门为我们的地图准备的
- 前景层或覆盖层通常是矢量图层(点、线和多边形),通常针对显示的特定地图网络进行准备和/或微调
背景图层通常是静态的、非交互式的。相反,前景图层通常是动态的,与用户交互相关,例如通过单击要素来查询图层属性
-
什么是图块层
瓦片层是网络地图背后的一项基本技术。它们构成了大多数网络地图中的背景层,从而帮助查看者在地理空间中定位前景层。
- 栅格瓦片
- 矢量瓦片
1. 栅格图块
图块层通常由 PNG 图像组成。传统上,每个 PNG 图像都是256×256256×256像素大小。
为了覆盖缩放级别为 的世界0,我们只需要一个图块。当我们转到缩放级别11,该单个图块被分割为2×2=42×2=4单独的图块。当我们进一步缩放级别时22,四块瓷砖中的每一块也分成四块,这样我们就有了4×4=164×4=16单独的图块,等等。一般来说,在缩放级别上全局图块层是是包含2是×2是=4是2是×2是=4是图块。在 Leaflet 地图的默认最大缩放级别 (19) 下,我们需要 274,877,906,944 个图块来覆盖地球50!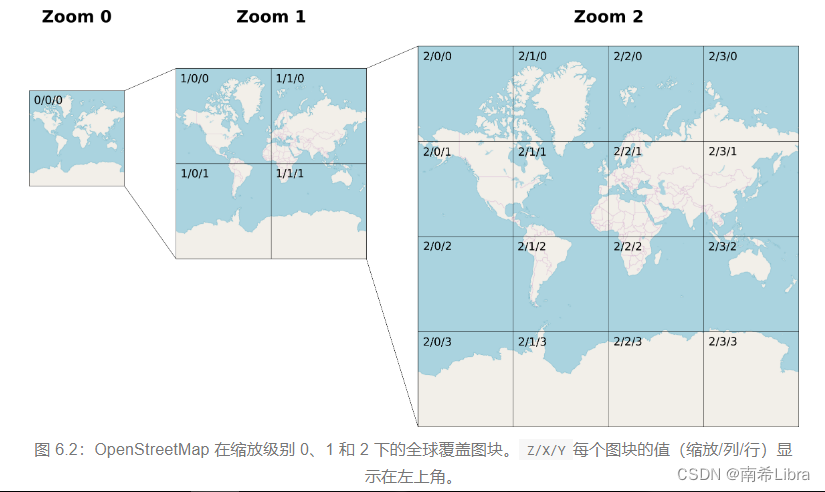
所有所需图块的 PNG 图像均由图块服务器发送,该图块服务器只是一个静态服务器(第5.4.2节),其中所有图块图像都存储在特定的目录结构中。要加载特定图块,我们输入一个 URL,例如http://.../Z/X/Y.png,其中http://.../是常量前缀,Z是缩放级别,X是列(即 x 轴),Y是行(即 y 轴)如杭州人民政府:https://b.tile.openstreetmap.org/17/109301/53972.png
2. 矢量瓦片
较新的瓦片层技术是将瓦片设为矢量图层,而不是 PNG 图像,称为矢量瓦片。矢量瓦片的特点是可以旋转地图,而标签保持水平方向,并且可以平滑放大或缩小,而不像栅格瓦片层那样严格划分为离散缩放级别。矢量瓦片的主要优点是尺寸较小,样式灵活。
Leaflet 库本身并不支持矢量图块,不过有一个名为Leaflet.VectorGrid的插件可以实现这一点
例如:Vector tiles (Mapbox GL JS)
3. 添加矢量标记
请记住,在使用 创建的圆形标记中L.circleMarker,radius属性以像素为单位(例如50),这意味着圆形标记在屏幕上保持恒定大小,而与缩放级别无关。在使用 创建的圆形中L.circle,半径以米为单位设置,这意味着圆形大小保持恒定的空间范围,随着放大或缩小而扩大或缩小。
L.circleMarker(
  [31.262218, 34.801472 - 0.001],
  {radius: 50, color: "black", fillColor: "red"}
).addTo(map);
4. 添加线段
 // 添加线段
        var line = L.polyline(
            [[30.2480698, 120.2079876], [30.2485086, 120.2070000]],
            { color: "red", weight: 10 }
        ).addTo(map);
5. 添加几何图形
// 添加几何图形
        var pol = L.polygon(
            [
                [30.2480634, 120.2050078],
                [30.2481569, 120.2058555],
                [30.2482589, 120.2065236],
                [30.2488098, 120.2053874]
            ],
            { color: "red", fillColor: "yellow", weight: 4 }
        ).addTo(map);
7. 添加长方形
// 添加长方形
//定义一个Bounds 左上角和右下角的坐标
var bounds = [[30.2480634, 120.2050078], [30.2488098, 120.2053874]]
//创建Rectangle
L.rectangle(bounds, { color: '#ff7800', weight: 1 }).addTo(map);
8. 添加弹出窗口
line.bindPopup(
    "这是我随意设置的经纬度线段。"
);
9. 添加描述
// 添加描述
        var legend = L.control({ position: "bottomleft" });
        legend.onAdd = function (map) {
            var div = L.DomUtil.create("div", "legend");
            div.innerHTML =
                '<p><b>Simple shapes in Leaflet</b></p><hr>' +
                '<p>This map shows an example of adding shapes ' +
                'on a Leaflet map</p>' +
                'The following shapes were added:<br>' +
                '<p><ul>' +
                '<li>A marker</li>' +
                '<li>A line</li>' +
                '<li>A polygon</li>' +
                '</ul></p>' +
                'The line layer has a <b>popup</b>. ' +
                'Click on the line to see it!<hr>' +
                'Created with the Leaflet library<br>' +
                '<img src="images/leaflet.png">';
            return div;
        };
        legend.addTo(map);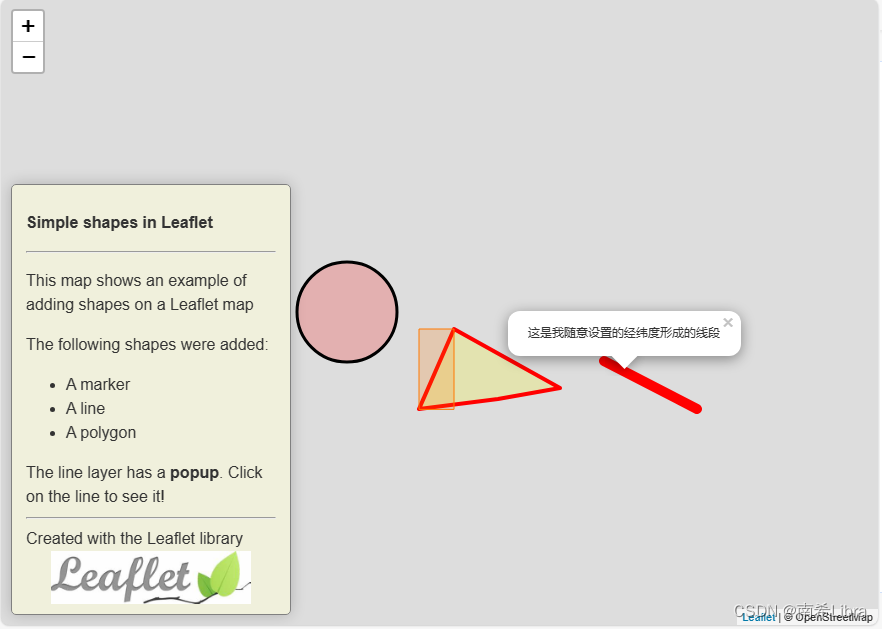
10. 添加地图点击事件
// 添加点击事件
var popup = L.popup();
        function onMapClick(e) {
            popup
                .setLatLng(e.latlng)
                .setContent(
                    "你当前点击的地理位置是" +
                    "<b>经度:</b> " + e.latlng.lng + "<br>" +
                    "<b>纬度:</b> " + e.latlng.lat
                )
                .openOn(map);
        }
        map.on("click", onMapClick);
学习文档:
1. Chapter 6 Leaflet | Introduction to Web Mapping
2. Plugins - Leaflet - a JavaScript library for interactive maps


 1万+
1万+


 被折叠的 条评论
为什么被折叠?
被折叠的 条评论
为什么被折叠?
 到【灌水乐园】发言


