


企业运维之服务管理 -- peomethues
1. promethues 简介
prometheus是由谷歌研发的一款开源的监控软件,它通过安装在远程机器上的 exporter,通过HTTP协议从远程的机器收集数据并存储在本地的时序数据库上
同时Prometheus后端用 golang语言开发,前端是 Grafana。
Prometheus为了支持各种中间件以及第三方的监控提供了exporter,大家可以把它理解成监控适配器,将不同指标类型和格式的数据统一转化为Prometheus能够识别的指标类型。
例如Node exporter主要通过读取Linux的/proc以及/sys目录下的系统文件获取操作系统运行状态,reids exporter通过Reids命令行获取指标,mysql exporter通过读取数据库监控表获取MySQL的性能数据。他们将这些异构的数据转化为标准的Prometheus格式,并提供HTTP查询接口。
Prometheus的流行和Kubernetes密不可分,支持对Kubernetes、容器、OpenStack的监控。
prometheus 是一套开源的系统监控报警框架。
1、优点
强大的多维度数据模型
灵活而强大的查询语句(PromQL):在同一个查询语句,可以对多个 metrics 进行乘法、加法、连接、取分数位等操作。
易于管理: Prometheus server 是一个单独的二进制文件,可直接在本地工作,不依赖于分布式存储。
高效:平均每个采样点仅占 3.5 bytes,且一个 Prometheus server 可以处理数百万的 metrics。
使用 pull 模式采集时间序列数据,这样不仅有利于本机测试而且可以避免有问题的服务器推送坏的 metrics。
可以采用 push gateway 的方式把时间序列数据推送至 Prometheus server 端
可以通过服务发现或者静态配置去获取监控的 targets。
有多种可视化图形界面。
易于伸缩。
2、组件
Prometheus 生态圈中包含了多个组件,其中许多组件是可选的:
Prometheus Server: 用于收集和存储时间序列数据。
Client Library:客户端库,为需要监控的服务生成相应的 metrics 并暴露给 Prometheus server。当 Prometheus server 来 pull 时,直接返回实时状态的 metrics。
Push Gateway: 主要用于短期的 jobs。由于这类 jobs 存在时间较短,可能在 Prometheus 来 pull 之前就消失了。为此,这次 jobs 可以直接向 Prometheus server 端推送它们的 metrics。这种方式主要用于服务层面的 metrics,对于机器层面的 metrices,需要使用 node exporter。
Exporters: 用于暴露已有的第三方服务的 metrics 给 Prometheus。
Alertmanager: 从 Prometheus server 端接收到 alerts 后,会进行去除重复数据,分组,并路由到对收的接受方式,发出报警。常见的接收方式有:电子邮件,pagerduty,OpsGenie, webhook 等。
架构:
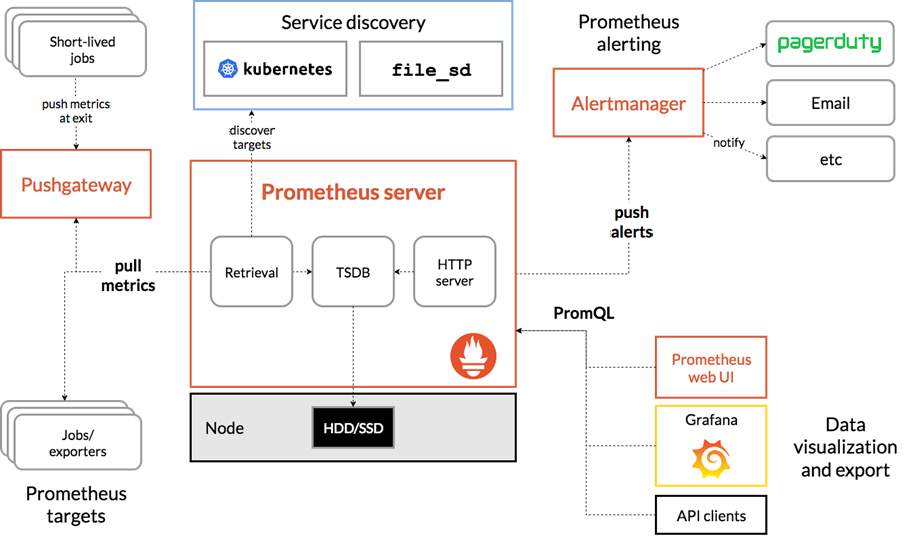
从这个架构图,也可以看出 Prometheus 的主要模块包含, Server, Exporters, Pushgateway, PromQL, Alertmanager, WebUI 等。
它大致使用逻辑是这样:
Prometheus server 定期从静态配置的 targets 或者服务发现的 targets 拉取数据。
当新拉取的数据大于配置内存缓存区的时候,Prometheus 会将数据持久化到磁盘(如果使用 remote storage 将持久化到云端)。
Prometheus 可以配置 rules,然后定时查询数据,当条件触发的时候,会将 alert 推送到配置的 Alertmanager。
Alertmanager 收到警告的时候,可以根据配置,聚合,去重,降噪,最后发送警告。
可以使用 API, Prometheus Console 或者 Grafana 查询和聚合数据。
2. promethues 的部署
下载最新版的服务端 prometheus 和客户端 node_exporter
Github 地址: https://github.com/prometheus/prometheus/releases/download/v2.39.1/prometheus-2.30.1.linux-amd64.tar.gz
普罗米修斯下载网址:https://prometheus.io/download/
[root@VM_2-45 ~]# wget https://github.com/prometheus/prometheus/releases/download/v2.25.0/prometheus-2.30.0.linux-amd64.tar.gz
[root@VM ~]# tar zxf  prometheus-2.30.0.linux-amd64.tar.gz -C /usr/local
[root@VM ~]# cd /usr/local/
[root@VM local]# mv prometheus-2.30.0.linux-amd64/ prometheus
[root@ VM prometheus]# pwd
/usr/local/prometheus
[root@ VM prometheus]# ./prometheus --version
prometheus, version 2.30.0 (branch: HEAD, revision: 52c693a63be1096158667557f934d2d0d207c4d9)
  build user:       root@03a85e24f43f
  build date:       20211214-15:58:16
  go version:       go1.17.5
  platform:         linux/amd64
prometheus.yml 配置文件解释
# my global config
global:
  scrape_interval:     15s # Set the scrape interval to every 15 seconds. Default is every 1
# 默认情况下,每15s拉取一次目标采样点数据。
minute.
   evaluation_interval: 15s # Evaluate rules every 15 seconds. The default is every 1 minute.
# 每15秒评估一次规则。默认值为每1分钟。
 # scrape_timeout is set to the global default (10s).

# Alertmanager configuration
alerting:
  alertmanagers:
  - static_configs:
    - targets:
      # - alertmanager:9093

# Load rules once and periodically evaluate them according to the global 'evaluation_interval'.
rule_files:
  # - "first_rules.yml"
  # - "second_rules.yml"

# A scrape configuration containing exactly one endpoint to scrape:
# Here it's Prometheus itself.
scrape_configs:
  # job名称会增加到拉取到的所有采样点上,同时还有一个instance目标服务的host:port标签也会增加到采样点上
  - job_name: 'prometheus'
scrape_interval: 5s
# 覆盖global的采样点,拉取时间间隔5s
    static_configs:
    - targets: ['localhost:9090']
启动服务
[root@VM prometheus]# ./prometheus --config.file=prometheus.yml
在启动时可以指定信息启动
# 指定配置文件
--config.file="prometheus.yml"
# 默认指定监听地址端口,可修改端口
--web.listen-address="0.0.0.0:9090"
# 最大连接数
--web.max-connections=512
# tsdb数据存储的目录,默认当前data/
--storage.tsdb.path="data/"
# premetheus 存储数据的时间,默认保存15天
--storage.tsdb.retention=15d
# 通过命令热加载无需重启 curl -XPOST 192.168.2.45:9090/-/reload
--web.enable-lifecycle
# 可以启用 TLS 或 身份验证 的配置文件的路径
--web.config.file=""
启动选项了解用命令./prometheus --help来进行查看
用supervisorctl进行管理:
[program:prometheus]
command= /usr/local/prometheus/prometheus --config.file=/usr/local/prometheus/prometheus.yml
#user=prometheus
autostart=true
startsecs=5
autorestart = true
startretries = 3
redirect_stderr=true
stdout_logfile=/data/logs/prometheus.log
stdout_logfile_maxbytes = 20MB
stdout_logfile_backups = 20
[root@VM supervisord.d]# netstat -ntulp | grep 9090
tcp6       0      0 :::9090                 :::*                    LISTEN      6832/prometheus
访问:http://localhost:9090


 286
286


 被折叠的 条评论
为什么被折叠?
被折叠的 条评论
为什么被折叠?
 到【灌水乐园】发言


