


折线图Chart
在这里,虽然不是以通用程序为目标,但稍微变更一下就可以用于其他用途。因此,作为图表的绘制区域,左下方的原点坐标为(0.0,0.0),右上角的坐标为(1.0,1.0)进行正规化。但是,这是X、Y的值是非负值的情况,处理负值时,原点的位置会移动。
Chart01.c
// 折线图
// tcc chart01.c ../lib/winlib.o

#include <windows.h>
#include <time.h>
#include <sys/stat.h>

enum MARGIN { LEFT = 50, TOP = 26, RIGHT = 70, BOTTOM = 24 };

RECT rect;		        // 窗口客户端区域
int width, height;  	// 图形绘制区域的宽度和高度
double* data;
int nData;
struct tm  tmBgn;	    // 开始日期
double vMax = 1000.0;
double vMin = 0.0;

int nx(double x) { return (int)(rect.left + LEFT + x*width + 0.5); }
int ny(double y) { return (int)(rect.top + TOP + (1.0-y)*height + 0.5); }
int yVal(double v){ return ny((v - vMin)/(vMax - vMin)); }

HWND crWindow(HINSTANCE, LPSTR, WNDPROC, int, int, int, int);

void setData(HWND hWnd) {
    char path[256], buf[256];
    time_t t, timeNow = time(NULL);
    int n;

    memset(&tmBgn, 0, sizeof(tmBgn));	// 零清除
    tmBgn.tm_year = 2011 - 1900;	    // 2011年
    tmBgn.tm_mon  =    9 - 1;	    	// 9月
    tmBgn.tm_mday =    4;		        // 4日(周日)
    t = mktime(&tmBgn);
    nData = (timeNow - t)/(24*60*60);
    data = (double*)calloc(nData, sizeof(double));
    for (n = 0; n < nData; n++) {
	struct stat buf;
	struct tm *tm = localtime(&t);
	wsprintf(path, "c:/Temp/www-access-log/access%d%02d%02d.txt",
			tm->tm_year+1900, tm->tm_mon+1, tm->tm_mday);
	stat(path, &buf);
	data[n] = (double)buf.st_size/1000.0;
	t += 24 * 60 * 60;
    }
}

void paint(HWND hwnd){
    int n;
    double x, y, xLast, yLast;
    char buf[32];
    RECT rc;
    PAINTSTRUCT ps;
    HDC hdc = BeginPaint(hwnd, &ps);
    time_t t;

    GetClientRect(hwnd, &rect);
    width  = (rect.right - rect.left) - LEFT - RIGHT;
    height = (rect.bottom - rect.top) - TOP - BOTTOM;
    SetRect(&rc, nx(0.0), 0, nx(1.0), ny(1.0));
    DrawText(hdc, "访问日志文件大小(KB)", -1, &rc, DT_CENTER | DT_SINGLELINE | DT_VCENTER);
    for (n = 0; n <= 5; n++) {		// Y轴
	y = (double)n / 5;
	MoveToEx(hdc, nx(0.0), ny(y), NULL);
	LineTo(hdc, nx(1.0)+6, ny(y));
	sprintf(buf, "%d", n*1000/5);
	SetRect(&rc, nx(1.0), ny(y)-10, nx(1.0)+60, ny(y)+10);
        DrawText(hdc, buf, -1, &rc, DT_CENTER | DT_SINGLELINE | DT_VCENTER);
    }
    t = mktime(&tmBgn);
    for (n = 0; n < nData; n+=7) {	// X轴
	struct tm *tm = localtime(&t);
	x = (n + 0.5) / nData;
	MoveToEx(hdc, nx(x), ny(0.0), NULL);
	LineTo(hdc, nx(x), ny(1.0));
	SetRect(&rc, nx(x)-50, ny(0), nx(x)+50, ny(0)+24);
	wsprintf(buf, "%d-%02d-%02d", tm->tm_year+1900, tm->tm_mon+1, tm->tm_mday);
        DrawText(hdc, buf, -1, &rc, DT_CENTER | DT_SINGLELINE | DT_VCENTER);
	t += 7 * 24 * 60 * 60;
    }
    xLast = 0.5 / nData;
    yLast = yVal(data[0]);
    MoveToEx(hdc, nx(xLast), yLast, NULL);
    for (n = 1; n < nData; n++) {	 // 折线图
	x = (n + 0.5) / nData;
	y = yVal(data[n]);
	LineTo(hdc, nx(x), y);
	xLast = x;
	yLast = y;
    }
    EndPaint(hwnd, &ps);
}

LRESULT CALLBACK WindowProc(HWND hwnd, UINT uMsg, WPARAM wParam, LPARAM lParam) {
    switch (uMsg) {
    case WM_PAINT:   paint(hwnd);  break;
    case WM_DESTROY: PostQuitMessage(0); break;
    default: return DefWindowProc(hwnd, uMsg, wParam, lParam);
    }
    return 0;
}

int WINAPI WinMain(HINSTANCE hInstance, HINSTANCE hPrevInstance, LPSTR lpCmdLine, int nCmdShow) {
    HWND hWnd = crWindow(hInstance, TEXT("Chart"), WindowProc, 10, 10, 800, 300);
    if (!hWnd) return FALSE;
    SetWindowText(hWnd, TEXT("Chart01"));
    setData(hWnd);
    return msgLoop();
}
这个项目的实施结果如下图所示。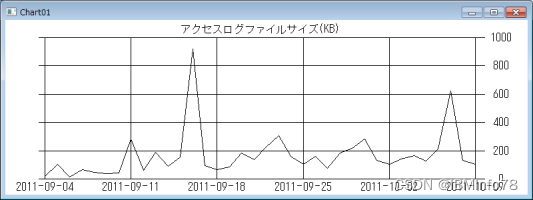
在访问量的推移图中追加移动平均。
在前节的图表中,追加7天移动平均的程序如下所示。
Chart02.c
// 折线图。 在chart01.c添加移动平均值。
// tcc chart02.c ../lib/winlib.o

#include <windows.h>
#include <time.h>
#include <sys/stat.h>

enum MARGIN { LEFT = 50, TOP = 26, RIGHT = 70, BOTTOM = 24 };

RECT rect;		// 窗口客户端区域
int width, height;  	// 图形绘制区域的宽度和高度
double* data;
double* mvavg;		 // 移动平均(7天)数据
int nData;
struct tm  tmBgn;	// 开始日期
double vMax = 1000.0;
double vMin = 0.0;

int nx(double x) { return (int)(rect.left + LEFT + x*width + 0.5); }
int ny(double y) { return (int)(rect.top + TOP + (1.0-y)*height + 0.5); }
int yVal(double v){ return ny((v - vMin)/(vMax - vMin)); }

HWND crWindow(HINSTANCE, LPSTR, WNDPROC, int, int, int, int);

void setData(HWND hWnd) {
    double sum;		// 移动平均
    char path[256], buf[256];
    time_t t, timeNow = time(NULL);
    int n;

    memset(&tmBgn, 0, sizeof(tmBgn));	 // 零清除
    tmBgn.tm_year = 2011 - 1900;	 // 2011年
    tmBgn.tm_mon  =    9 - 1;		// 9月
    tmBgn.tm_mday =    4;		 // 4日(周日)
    t = mktime(&tmBgn);
    nData = (timeNow - t)/(24*60*60);
    data  = (double*)calloc(nData, sizeof(double));
    mvavg = (double*)calloc(nData, sizeof(double));
    sum = 0.0;
    for (n = 0; n < nData; n++) {
	struct stat buf;
	struct tm *tm = localtime(&t);
	wsprintf(path, "c:/Temp/www-access-log/access%d%02d%02d.txt",
			tm->tm_year+1900, tm->tm_mon+1, tm->tm_mday);
	stat(path, &buf);
	data[n] = (double)buf.st_size/1000.0;
	t += 24 * 60 * 60;
	sum += data[n];
	if (n >= 7) sum -= data[n-7];
	mvavg[n] = sum / 7;
    }
}

void paint(HWND hwnd){
    int n;
    double x, y, xLast, yLast;
    char buf[32];
    RECT rc;
    PAINTSTRUCT ps;
    HDC hdc = BeginPaint(hwnd, &ps);
    HPEN hPen, hOldPen;
    time_t t;

    GetClientRect(hwnd, &rect);
    width  = (rect.right - rect.left) - LEFT - RIGHT;
    height = (rect.bottom - rect.top) - TOP - BOTTOM;
    SetRect(&rc, nx(0.0), 0, nx(1.0), ny(1.0));
    DrawText(hdc, "访问日志文件大小(KB)", -1, &rc, DT_CENTER | DT_SINGLELINE | DT_VCENTER);
    for (n = 0; n <= 5; n++) {		 // Y轴
	y = (double)n / 5;
	MoveToEx(hdc, nx(0.0), ny(y), NULL);
	LineTo(hdc, nx(1.0)+6, ny(y));
	sprintf(buf, "%d", n*1000/5);
	SetRect(&rc, nx(1.0), ny(y)-10, nx(1.0)+60, ny(y)+10);
        DrawText(hdc, buf, -1, &rc, DT_CENTER | DT_SINGLELINE | DT_VCENTER);
    }
    t = mktime(&tmBgn);
    for (n = 0; n < nData; n+=7) {	// X轴
	struct tm *tm = localtime(&t);
	x = (n + 0.5) / nData;
	MoveToEx(hdc, nx(x), ny(0.0), NULL);
	LineTo(hdc, nx(x), ny(1.0));
	SetRect(&rc, nx(x)-50, ny(0), nx(x)+50, ny(0)+24);
	wsprintf(buf, "%d-%02d-%02d", tm->tm_year+1900, tm->tm_mon+1, tm->tm_mday);
        DrawText(hdc, buf, -1, &rc, DT_CENTER | DT_SINGLELINE | DT_VCENTER);
	t += 7 * 24 * 60 * 60;
    }

    xLast = 0.5 / nData;
    yLast = yVal(data[0]);
    MoveToEx(hdc, nx(xLast), yLast, NULL);
    for (n = 1; n < nData; n++) {	// 折线图
	x = (n + 0.5) / nData;
	y = yVal(data[n]);
	LineTo(hdc, nx(x), y);
	xLast = x;
	yLast = y;
    }

    // 绘制移动平均图
    hPen = CreatePen(PS_SOLID, 2, 0xFF);	// RED
    hOldPen = SelectObject(hdc, hPen);
    xLast = 6.5 / nData;
    yLast = yVal(mvavg[6]);
    MoveToEx(hdc, nx(xLast), yLast, NULL);
    for (n = 7; n < nData; n++) {	// 折线图
	x = (n + 0.5) / nData;
	y = yVal(mvavg[n]);
	LineTo(hdc, nx(x), y);
	xLast = x;
	yLast = y;
    }
    SelectObject(hdc, hOldPen);
    DeleteObject(hPen);

    EndPaint(hwnd, &ps);
}

LRESULT CALLBACK WindowProc(HWND hwnd, UINT uMsg, WPARAM wParam, LPARAM lParam) {
    switch (uMsg) {
    case WM_PAINT:   paint(hwnd);  break;
    case WM_DESTROY: PostQuitMessage(0); break;
    default: return DefWindowProc(hwnd, uMsg, wParam, lParam);
    }
    return 0;
}

int WINAPI WinMain(HINSTANCE hInstance, HINSTANCE hPrevInstance, LPSTR lpCmdLine, int nCmdShow) {
    HWND hWnd = crWindow(hInstance, TEXT("Chart"), WindowProc, 10, 10, 800, 300);
    if (!hWnd) return FALSE;
    SetWindowText(hWnd, TEXT("Chart02"));
    setData(hWnd);
    return msgLoop();
}
这个项目的实施结果如下图所示。
求7天的移动平均(红色)的话,根据星期的变动会被吸收,变成非常光滑的折线图。
单对数图
当Y轴的数值波动很大时,只把Y轴做成对数的单对数图(下图)是有效的。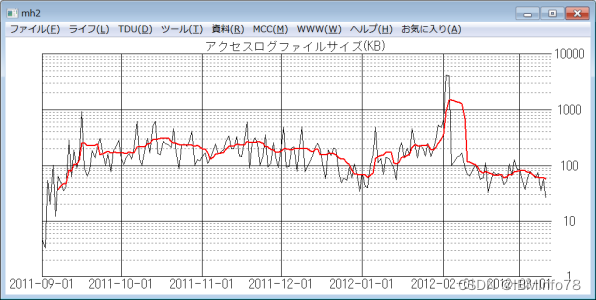
节目如下所示。drawLogGraph函数是单对数图的绘图函数,是drawLinearGraph函数之前显示的线性(比例)刻度图的绘图函数。
Graph01.c
// 折线图。
// mcc -shared graph01.c

#include <windows.h>
#include <math.h>
#include <stdio.h>
#include <stdlib.h>
#include <string.h>
#include <time.h>
#include <sys/stat.h>

#define EXPORT __declspec(dllexport)

#define LEFT  	60
#define TOP   	26
#define RIGHT 	70
#define BOTTOM 	30

RECT rect;		// 窗口客户端区域
int width, height;  	// 图形绘制区域的宽度和高度
double* data;
double* mvavg;		// 移动平均(7天)数据
int nData;
struct tm  tmBgn;	// 开始日期
double vMax;
double vMin;
void *null = 0;

int nx(double x) { return (int)(rect.left + LEFT + x*width + 0.5); }
int ny(double y) { return (int)(rect.top + TOP + (1.0-y)*height + 0.5); }
double yVal(double v){
    return (double)ny((log10(v) - log10(vMin))/(log10(vMax) - log10(vMin)));
}

EXPORT void setData() {
    double sum;		// 移动平均
    char path[256], buf[256];
    time_t t, timeNow = time(NULL);
    int n;
    int factor;

    memset(&tmBgn, 0, sizeof(tmBgn));	// 零清除
    tmBgn.tm_year = 2011 - 1900;	// 2011年
    tmBgn.tm_mon  =    9 - 1;		// 9月
    tmBgn.tm_mday =    1;		 // 1天
    t = mktime(&tmBgn);
    nData = (timeNow - t)/(24*60*60);
    data  = calloc(nData, sizeof(double));
    mvavg = calloc(nData, sizeof(double));
    sum = 0.0;
    for (n = 0; n < nData; n++) {
	struct _stat buf;
	struct tm *tm = localtime(&t);
	wsprintf(path, "c:/Temp/www-access-log/access%d%02d%02d.txt",
			tm->tm_year+1900, tm->tm_mon+1, tm->tm_mday);
	_stat(path, &buf);
	data[n] = (double)buf.st_size/1000.0;
	if (data[n] == 0) break;
	if (n == 0) {
	    vMax = data[n];
	    vMin = data[n];
	} else {
	    if (data[n] > vMax) vMax = data[n];
	    if (data[n] < vMin) vMin = data[n];
	}
	t += 24 * 60 * 60;
	sum += data[n];
	if (n >= 7) sum -= data[n-7];
	mvavg[n] = sum / 7;	// 7天的移动平均
    }
    nData = n;
    vMin = pow(10.0, floor(log10(vMin < 1.0 ? 1.0 : vMin)));
    vMax = pow(10.0, ceil(log10(vMax)));
}

// 纵轴(日志大小)为对数大小(片对数图)
EXPORT void drawLogGraph(HWND hwnd) {
    int n, k, nY;
    double x, y, xLast, yLast, yBase;
    char buf[256];
    RECT rc;
    PAINTSTRUCT ps;
    HDC hdc = BeginPaint(hwnd, &ps);
    HPEN hPen, hOldPen;
    time_t t;
    int DAYS = 30;
    int NY = (int)(log10(vMax) - log10(vMin));

    GetClientRect(hwnd, &rect);
    width  = (rect.right - rect.left) - LEFT - RIGHT;
    height = (rect.bottom - rect.top) - TOP - BOTTOM;
    SetRect(&rc, nx(0.0), 0, nx(1.0), ny(1.0));
    DrawText(hdc, "访问日志文件大小(KB)",
		-1, &rc, DT_CENTER | DT_SINGLELINE | DT_VCENTER);
    for (n = 0; n <= NY; n++) {		// Y轴
	y = (double)n / NY;
	MoveToEx(hdc, nx(0.0), ny(y), NULL);
	LineTo(hdc, nx(1.0)+6, ny(y));
	sprintf(buf, "%.0f", vMin*pow(10.0, (double)n));
	SetRect(&rc, nx(1.0), ny(y)-10, nx(1.0)+70, ny(y)+10);
        DrawText(hdc, buf, -1, &rc, DT_CENTER | DT_SINGLELINE | DT_VCENTER);
    }

    // Y轴方向辅助划线
    hPen = CreatePen(PS_DOT, 1, 0x808080);
    hOldPen = SelectObject(hdc, hPen);
    nY = (int)vMin;
    for (n = 0; n < NY; n++) {		// Y轴
	yBase = vMin * pow(10.0, (double)n);
	for (k = 2; k < 10; k++) {
	    y = yBase * k;
	    MoveToEx(hdc, nx(0.0), (int)yVal(y), NULL);
	    LineTo(hdc, nx(1.0)+6, (int)yVal(y));
	}
    }
    SelectObject(hdc, hOldPen);
    DeleteObject(hPen);

    t = mktime(&tmBgn);
    for (n = 0; n < nData; n++) {	// X轴
	struct tm *tm = localtime(&t);
	if (tm->tm_mday == 1) {
	    x = (double)n / nData;
	    MoveToEx(hdc, nx(x), ny(0.0), NULL);
	    LineTo(hdc, nx(x), ny(1.0));
	    SetRect(&rc, nx(x)-60, ny(0.0), nx(x)+60, ny(0.0)+24);
	    wsprintf(buf, "%d-%02d-%02d", tm->tm_year+1900, tm->tm_mon+1, tm->tm_mday);
            DrawText(hdc, buf, -1, &rc, DT_CENTER | DT_SINGLELINE | DT_VCENTER);
	}
	t += 24 * 60 * 60;
    }

    xLast = 0.0;
    yLast = yVal(data[0]);
    MoveToEx(hdc, nx(xLast), (int)yLast, null);
    for (n = 1; n < nData; n++) {	// 折线图
	x = (double)n / nData;
	y = yVal(data[n]);
	LineTo(hdc, nx(x), (int)y);
	xLast = x;
	yLast = y;
    }

    // 绘制移动平均图
    hPen = CreatePen(PS_SOLID, 2, 0xFF);	// RED
    hOldPen = SelectObject(hdc, hPen);
    xLast = 6.0 / nData;
    yLast = yVal(mvavg[6]);
    MoveToEx(hdc, nx(xLast), (int)yLast, null);
    for (n = 7; n < nData; n++) {	 // 折线图
	x = (double)n / nData;
	y = yVal(mvavg[n]);
	LineTo(hdc, nx(x), (int)y);
	xLast = x;
	yLast = y;
    }
    SelectObject(hdc, hOldPen);
    DeleteObject(hPen);

    EndPaint(hwnd, &ps);
}

EXPORT void drawLinearGraph(HWND hwnd) {
    int n;
    double x, y, xLast, yLast;
    char buf[32];
    RECT rc;
    PAINTSTRUCT ps;
    HDC hdc = BeginPaint(hwnd, &ps);
    HPEN hPen, hOldPen;
    time_t t;
    int DAYS = 30;

    GetClientRect(hwnd, &rect);
    width  = (rect.right - rect.left) - LEFT - RIGHT;
    height = (rect.bottom - rect.top) - TOP - BOTTOM;
    SetRect(&rc, nx(0.0), 0, nx(1.0), ny(1.0));
    DrawText(hdc, "访问日志文件大小(KB)",
		-1, &rc, DT_CENTER | DT_SINGLELINE | DT_VCENTER);
    for (n = 0; n <= 5; n++) {		// Y轴
	y = (double)n / 5;
	MoveToEx(hdc, nx(0.0), ny(y), NULL);
	LineTo(hdc, nx(1.0)+6, ny(y));
	sprintf(buf, "%.0f", n*vMax/5);
	SetRect(&rc, nx(1.0), ny(y)-10, nx(1.0)+60, ny(y)+10);
        DrawText(hdc, buf, -1, &rc, DT_CENTER | DT_SINGLELINE | DT_VCENTER);
    }
    t = mktime(&tmBgn);
    for (n = 0; n < nData; n+=DAYS) {	// X轴
	struct tm *tm = localtime(&t);
	x = (n + 0.5) / nData;
	MoveToEx(hdc, nx(x), ny(0.0), NULL);
	LineTo(hdc, nx(x), ny(1.0));
	SetRect(&rc, nx(x)-60, ny(0.0), nx(x)+60, ny(0.0)+24);
	wsprintf(buf, "%d-%02d-%02d", tm->tm_year+1900, tm->tm_mon+1, tm->tm_mday);
        DrawText(hdc, buf, -1, &rc, DT_CENTER | DT_SINGLELINE | DT_VCENTER);
	t += DAYS * 24 * 60 * 60;
    }

    xLast = 0.5 / nData;
    yLast = yVal(data[0]);
    MoveToEx(hdc, nx(xLast), (int)yLast, null);
    for (n = 1; n < nData; n++) {	// 折线图
	x = (n + 0.5) / nData;
	y = yVal(data[n]);
	LineTo(hdc, nx(x), (int)y);
	xLast = x;
	yLast = y;
    }

    // 绘制移动平均图
    hPen = CreatePen(PS_SOLID, 2, 0xFF);	// RED
    hOldPen = SelectObject(hdc, hPen);
    xLast = 6.5 / nData;
    yLast = yVal(mvavg[6]);
    MoveToEx(hdc, nx(xLast), (int)yLast, null);
    for (n = 7; n < nData; n++) {	// 折线图
	x = (n + 0.5) / nData;
	y = yVal(mvavg[n]);
	LineTo(hdc, nx(x), (int)y);
	xLast = x;
	yLast = y;
    }
    SelectObject(hdc, hOldPen);
    DeleteObject(hPen);

    EndPaint(hwnd, &ps);
}


 919
919


 被折叠的 条评论
为什么被折叠?
被折叠的 条评论
为什么被折叠?
 到【灌水乐园】发言


