


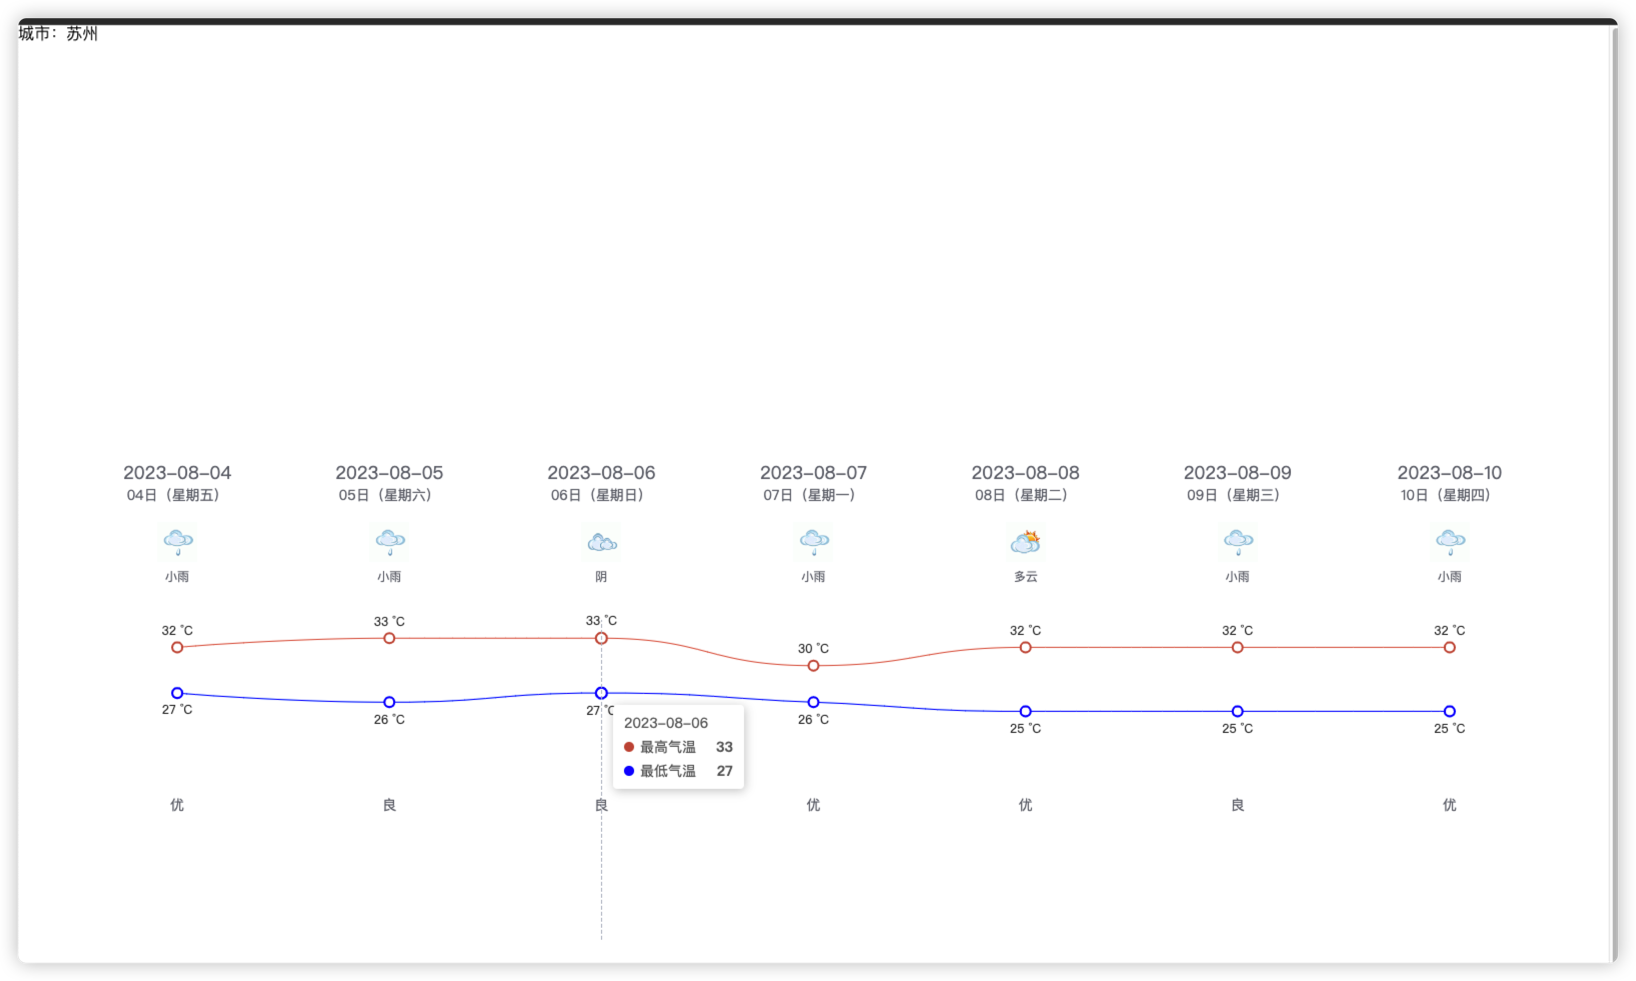
实现效果:
这里我用的天气接口是网上开源的,可以自己找一下。
稍微简单封装了一下axiso以及接口
封装的axios:
// import { useUserStore } from '@/stores/user'
import axios from 'axios'
import router from '@/router'
import { ElMessage } from 'element-plus'

const baseURL = 'https://v0.yiketianqi.com'

const instance = axios.create({
    baseURL,
    timeout: 100000
})

// instance.interceptors.request.use(
//     (config) => {
//         const userStore = useUserStore()
//         if (userStore.token) {
//             config.headers.Authorization = userStore.token
//         }
//         return config
//     },
//     (err) => Promise.reject(err)
// )

instance.interceptors.response.use(
    (res) => {
        if (res.data.code === 0 || res.status == 200) {
            return res
        }
        ElMessage({ message: res.data.message || '服务异常', type: 'error' })
        return Promise.reject(res.data)
    },
    (err) => {
        ElMessage({ message: err.response.data.message || '服务异常', type: 'error' })
        console.log(err)
        if (err.response?.status === 401) {
            router.push('/login')
        }
        return Promise.reject(err)
    }
)

export default instance
export { baseURL }
封装的接口:
import instance from '../../utils/requestWeather'

export function getWeather() {
    return instance({
        url: '/api?unescape=1&version=v9&appid=75878732&appsecret=kcKOD1Qz',
        method: 'GET',
    })
}
具体展示页面:
<template>
  <div>城市:{{ weatherData.city }}</div>
  <div class="container">
    <div id="main" style="width: 100%; height: 500px"></div>
  </div>
</template>

<script setup>
import * as echarts from 'echarts'
import { onMounted, reactive, ref } from 'vue'
import { getWeather } from '../../api/weather/weather'

const draw = () => {
  var chartDom = document.getElementById('main')
  var myChart = echarts.init(chartDom)
  myChart.clear()
  myChart.setOption(option)
  // echarts表格自适应!!
  setTimeout(function () {
    window.onresize = function () {
      myChart.resize()
    }
  }, 200)
}
onMounted(() => {
  getweatherData()
})
const weatherData = ref({})
const weatherDate = reactive([])
const airLevel = reactive([])
const weatherDay = reactive([])
const tem1 = reactive([]) //最高温度
const tem2 = reactive([]) //最低温度
const getweatherData = async () => {
  try {
    const res = await getWeather()
    weatherData.value = res.data
    console.log('日期', weatherData.value.data)
    weatherData.value.data.forEach((item) => {
      weatherDate.push(item.date)
      airLevel.push(item.air_level)
      weatherDay.push(item.day)
      tem1.push(item.tem1)
      tem2.push(item.tem2)
    })
    console.log('数据', weatherData.value.data)
    draw()
  } catch (error) {
    console.log('error:', error)
  }
}
var option = reactive({
  grid: {
    show: true,
    backgroundColor: 'transparent',
    opacity: 0.3,
    borderWidth: '0',
    top: '180',
    bottom: '0'
  },
  tooltip: {
    trigger: 'axis'
  },
  legend: {
    show: false
  },
  xAxis: [
    // 日期
    {
      type: 'category',
      boundaryGap: false,
      position: 'top',
      offset: 130,
      zlevel: 100,
      axisLine: {
        show: false
      },
      axisTick: {
        show: false
      },
      axisLabel: {
        interval: 0,
        formatter: ['{a|{value}}'].join('\n'),
        rich: {
          a: {
            // color: 'white',
            fontSize: 18
          }
        }
      },
      nameTextStyle: {},
      data: weatherDate
    },
    // 星期
    {
      type: 'category',
      boundaryGap: false,
      position: 'top',
      offset: 110,
      zlevel: 100,
      axisLine: {
        show: false
      },
      axisTick: {
        show: false
      },
      axisLabel: {
        interval: 0,
        formatter: ['{a|{value}}'].join('\n'),
        rich: {
          a: {
            // color: 'white',
            fontSize: 14
          }
        }
      },
      nameTextStyle: {
        fontWeight: 'bold',
        fontSize: 19
      },
      data: weatherDay
    },
    // 天气图标,这边我是写死的
    {
      type: 'category',
      boundaryGap: false,
      position: 'top',
      offset: 20,
      zlevel: 100,
      axisLine: {
        show: false
      },
      axisTick: {
        show: false
      },
      axisLabel: {
        interval: 0,
        formatter: function (value, index) {
          return '{' + index + '| }\n{b|' + value + '}'
        },
        rich: {
          0: {
            backgroundColor: {
              // image: require('@/assets/weather_icon/' + this.weatherIconDic[this.weatherData.weather[0]] + '.png')
              image: 'https://d.scggqx.com/forecast/img/小雨.png'
            },
            height: 40,
            width: 40
          },
          1: {
            backgroundColor: {
              // image: require('@/assets/weather_icon/' + this.weatherIconDic[this.weatherData.weather[1]] + '.png')
              image: 'https://d.scggqx.com/forecast/img/小雨.png'
            },
            height: 40,
            width: 40
          },
          2: {
            backgroundColor: {
              // image: require('@/assets/weather_icon/' + this.weatherIconDic[this.weatherData.weather[2]] + '.png')
              image: 'https://d.scggqx.com/forecast/img/阴.png'
            },
            height: 40,
            width: 40
          },
          3: {
            backgroundColor: {
              // image: require('@/assets/weather_icon/' + this.weatherIconDic[this.weatherData.weather[3]] + '.png')
              image: 'https://d.scggqx.com/forecast/img/小雨.png'
            },
            height: 40,
            width: 40
          },
          4: {
            backgroundColor: {
              // image: require('@/assets/weather_icon/' + this.weatherIconDic[this.weatherData.weather[4]] + '.png')
              image: 'https://d.scggqx.com/forecast/img/多云.png'
            },
            height: 40,
            width: 40
          },
          5: {
            backgroundColor: {
              // image: require('@/assets/weather_icon/' + this.weatherIconDic[this.weatherData.weather[5]] + '.png')
              image: 'https://d.scggqx.com/forecast/img/小雨.png'
            },
            height: 40,
            width: 40
          },
          6: {
            backgroundColor: {
              // image: require('@/assets/weather_icon/' + this.weatherIconDic[this.weatherData.weather[6]] + '.png')
              image: 'https://d.scggqx.com/forecast/img/小雨.png'
            },
            height: 40,
            width: 40
          },
          b: {
            // color: 'white',
            fontSize: 12,
            lineHeight: 30,
            height: 20
          }
        }
      },
      nameTextStyle: {
        fontWeight: 'bold',
        fontSize: 19
      },
      // data: this.weatherData.weather
      data: ['小雨', '小雨', '阴', '小雨', '多云', '小雨', '小雨']
    },
    // 天气描述,这边我也是写死的
    {
      type: 'category',
      boundaryGap: false,
      position: 'top',
      offset: -200,
      zlevel: -200,
      axisLine: {
        show: false
      },
      axisTick: {
        show: false
      },
      axisLabel: {
        interval: 0,
        formatter: ['{a|{value}}'].join('\n'),
        rich: {
          a: {
            // color: 'white',
            fontSize: 14
          }
        }
      },
      nameTextStyle: {
        fontWeight: 'bold',
        fontSize: 19
      },
      data: airLevel
    }
  ],
  yAxis: {
    type: 'value',
    show: false,
    axisLabel: {
      formatter: '{value} °C',
      color: 'white'
    }
  },
  series: [
    {
      name: '最高气温',
      type: 'line',
      data: tem1,
      symbol: 'emptyCircle',
      symbolSize: 10,
      showSymbol: true,
      smooth: true,
      itemStyle: {
        normal: {
          color: '#C95843'
        }
      },
      label: {
        show: true,
        position: 'top',
        // color: 'white',
        formatter: '{c} °C'
      },
      lineStyle: {
        width: 1
        // color: 'white'
      },
      areaStyle: {
        opacity: 1,
        color: 'transparent'
      }
    },
    {
      name: '最低气温',
      type: 'line',
      data: tem2,
      symbol: 'emptyCircle',
      symbolSize: 10,
      showSymbol: true,
      smooth: true,
      itemStyle: {
        normal: {
          color: 'blue'
        }
      },
      label: {
        show: true,
        position: 'bottom',
        // color: 'white',
        formatter: '{c} °C'
      },
      lineStyle: {
        width: 1
        // color: 'white'
      },
      areaStyle: {
        opacity: 1,
        color: 'transparent'
      }
    }
  ]
})
</script>

<style lang="scss" scoped>
.container {
  height: 100vh;
  display: flex;
  justify-content: center;
  align-items: center;
}
</style>
至此,天气预报走势图就完成了,日期,天气描述图片,星期,空气质量这些展示就是通过设置多个x轴控制offset,zlevel属性来实现的。


 4752
4752

 被折叠的 条评论
为什么被折叠?
被折叠的 条评论
为什么被折叠?
 到【灌水乐园】发言


