


距离过年还有4天,哦耶耶!!!
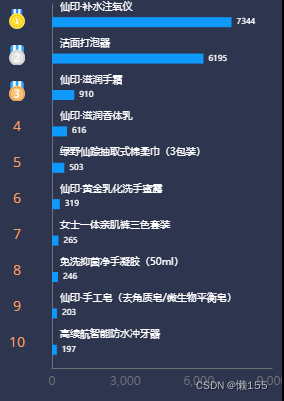
UI图要你这样实现,该怎么办尼,看我的博客就对了,哈哈哈
  var option = {
                    grid:{
                        top:10,
                        right:10,
                        left:40,
                    },
                    xAxis: {
                        show:true,
                        minInterval: 3000,//最小值
                        axisLine:{
                            show:true,//X轴要展示
                        },
                        axisTick:{
                            show:false, //刻度线不展示
                        },
                        splitLine:{
                            show:true,
                            lineStyle:{
                                color:['#2E354F'],
                                width:1,
                                type:'solid'
                            }
                        },
                        axisLabel: {
                            show: true,
                            interval:1
                        },
                    },
                    yAxis: {
                        type: 'category',
                        inverse: true, //反向坐标
                        data:[a,b,c,d,e,f],//Y轴的name
                        axisTick:{
                            show:false,
                        },
                        splitLine:{
                            show:false,
                        },

                        axisLabel: { //标签相关设置,最重要的部分
                            show: true,
                            inside: true,
                            splitNumber: 50,
                            boundaryGap: [20, 20],
                            textStyle: {
                                color: "#fff",
                                verticalAlign: "bottom",
                                align: "left",
                                padding: [200, 0, 10, 0],
                                fontSize:10
                            },
                        },
                    },
                    series: [
                        {
                            type: 'bar',
                            data: salesVolum,//后端传的值
                            color:"#0F99FB",
                            fontSize:10,
                            label: {
                                show: true,
                                position: 'right',
                                fontSize:8,
                                color:'#fff'
                            },
                            top:-54,
                            emphasis:{
                                label:{
                                    show:true,
                                },
                            },
                            barWidth:10,
                        }
                    ],
                };
然后就可以实现最开始图的样子了


 1017
1017

 被折叠的 条评论
为什么被折叠?
被折叠的 条评论
为什么被折叠?
 到【灌水乐园】发言


