


D3.JS中常用的绘制图形的的API
其实SVG 提供的图形标签(圆形、矩形、线条、路径等)其实只是构成图形的基本元素,一张完整图表则是由几百个这些小元件组成的,如果只使用 SVG 提供的图形,就需要很辛苦地一个一个建立图形,才能完成一张图表。为了省去这个麻烦,D3 创建了很多不同的 API 来协助建构复杂图形/图表,常用的 有如下几种。
- Generator 产生
标签 中的d属性 - Component:产生 DOM 元素
- Layout:产生整张图表
-
d3.line() 方法
d3.line() :分别是 x 跟 y 值,d3.line().x().y() 这两个参数可以是数字或是方法,用来计算出路径的起始点坐标,绘制出线条;
<body>
    <svg width="500" height="400" style="border: 1px solid red"  >
        <path
            d="M50 20 C80 90,40 200,250,100" stroke="black"    // 以前的计算方式,比较繁琐
            fill="red"
            stroke-width="5"
        ></path>

    </svg>
</body>
</html>
<script>
  // 使用d3.line()
  const list = [{ x: 20, y: 200 }, { x: 40, y: 300 }, { x: 70, y: 130 }, { x: 100, y: 190 }, { x: 20, y: 250 }]
    const line = d3.line()
        .x(d => d.x)
        .y(d => d.y)
    d3.select('svg')
        .append('path')
        .attr('d', line(list))
        .attr('stroke', 'black')
        .attr('stroke-width', '5')
        .attr('fill', 'red')
</script>

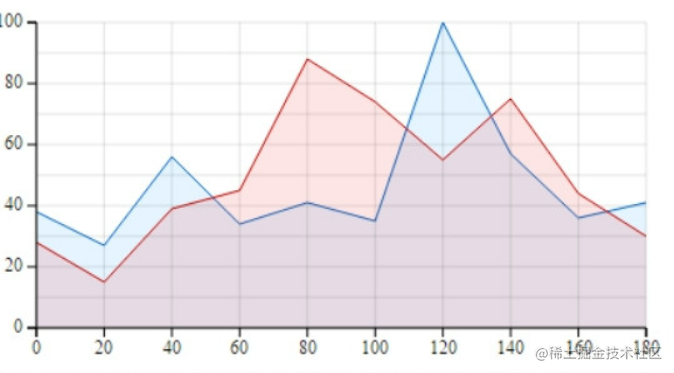
该方法有三个参数;area.x( ) 计算出X的坐标,area.y1( ) y轴做边界;area.y0( ) 开始绘制区域的y轴范围
<body>
    <svg width="500" height="400" style="border: 1px solid red">
        <!-- <path d="M50 20 C80 90,40 200,250,100" stroke="black" fill="red" stroke-width="5"></path> -->
    </svg>
</body>

</html>
<script>
    const list = [{ x: 20, y: 20 }, { x: 40, y: 30 }, { x: 70, y: 130 }, { x: 100, y: 190 }]
    const area = d3.area()
        .x(d => d.x)
        .y1(d => d.y)
        .y0(20)  // 决定绘制区域离原点坐标X轴多远
    d3.select('svg')
        .append('path')
        .attr('d', area(list))
        .attr('stroke', 'black')
        .attr('stroke-width', '5')
        .attr('fill', 'red')
</script>

以上方法一般用在折线图中比较方便
-
d3.arc( ) 用来绘制圆弧
参数 作用 arc.innerRadius( ) 内弧范围 arc.outerRadius( ) 外层弧范围 arc.startAngle( ) 起始角度 arc.endAngle( ) 结束角度 - 弧形的中心点永远 [0 , 0],如果想要移动这个弧形就用 transform (x , y)操作
- 弧形角度由 .startAngle( ) 跟.endAngle( ) 去控制,当start 跟 end 的角度加起来大于或等于 τ (也就是2π) 的时候,就会形成一个完整的圆型
- .startAngle( ) 起始角度从指针12点钟方向开始,顺时针开始画弧
- pie ( ) 这个API 会将数据处理成 arc( ) 需要的 start 跟 end 角度,所以 arc( ) 通常跟 pie( ) 搭配使用
<body>
    <svg width="500" height="400" style="border: 1px solid red">
        <!-- <path d="M50 20 C80 90,40 200,250,100" stroke="black" fill="red" stroke-width="5"></path> -->
    </svg>
</body>

</html>
<script>
    const arc = d3.arc()
        .innerRadius(140)  // 内弧半径
        .outerRadius(150)  // 外弧班级
        .startAngle(0)  // 开始角度  从0开始顺时针
        .endAngle(Math.PI * 0.5)   // Math.PI 表示一个圆的周长与直径的比例,约为 3.14159:2Π就是一整个圆

    d3.select('svg')
        .append("g")
        .attr("transform", "translate(200,250)")
        .append('path')
        .attr('d', arc())
        .attr('stroke', 'pink')
        .attr('fill', 'red')
</script>

D3.stack( ) 图形块的使用
stack( ) 这个 API 主要用来画条形图,需要搭配 scale( )、axis( ) 等API 才能完整的画出一个条形图。
<body>
    <svg width="500" height="400" style="border: 1px solid red">
        <!-- <path d="M50 20 C80 90,40 200,250,100" stroke="black" fill="red" stroke-width="5"></path> -->
    </svg>
</body>

</html>
<script>
    const list = [
        { name: 125, color: 300, age: 120 },
        { name: 165, color: 230, age: 300 },
        { name: 230, color: 303, age: 350 },
    ];
    const stack = d3.stack()
        .keys(['name', 'color', 'age'])
    const stackedSeries = stack(list)
    const colorScale = d3.scaleOrdinal()   // 设置颜色的比例尺
        .domain(['name', 'color', 'age'])
        .range(["red", "blue", "purple"])


    const g = d3.select('svg')
        .style("padding",'20')
        .selectAll('g')
        .data(stackedSeries)
        .enter()
        .append('g')
        .attr('fill', d => colorScale(d.key))


    g.selectAll('rect')
        .data(d => {
            console.log(d);   // 这里的d是取到的stackedSeries处理后的数组值
            return d
        })
        .join('rect')
        .attr('width', d => d[1] - d[0])    // 计算出叠加的每一个矩形宽度
        .attr('x', d => d[0])    // 计算出x的坐标
        .attr('y', (d, i) => i * 50)  // y坐标表示间距
        .attr('height', 20);  // 高度可以固定
</script>


 1762
1762


 被折叠的 条评论
为什么被折叠?
被折叠的 条评论
为什么被折叠?
 到【灌水乐园】发言


