


R语言生成多模型预测结果仿真数据、使用pROC包计算每一个模型的roc曲线,使用roc.test函数对两个模型roc曲线执行德龙检验(delong test)
目录
R语言生成多模型预测结果仿真数据、使用pROC包计算每一个模型的roc曲线,使用roc.test函数对两个模型roc曲线执行德龙检验(delong test)
R语言生成多模型预测结果仿真数据、使用pROC包计算每一个模型的roc曲线,使用roc.test函数对两个模型roc曲线执行德龙检验(delong test)
Delong检验(DeLong's test)是常用的用于比较两个分类器性能的假设检验。它基于ROC曲线下面积(AUC)的差异来比较两个分类器的性能。Delong检验将两个分类器的ROC曲线的差异转换为一个z统计量,并计算其p值,以考虑该差异是否显著。在医学诊断和生物统计学等领域,Delong检验常用于比较两个医学诊断测试或两个生物标志物的性能。
仿真数据
library(pROC)

# Create some example data
set.seed(123)
y_true <- sample(c(0, 1), 100, replace = TRUE)
y_model1 <- runif(100)
y_model2 <- rnorm(100)
R语言生成多模型预测结果仿真数据、使用pROC包计算每一个模型的roc曲线,使用roc.test函数对两个模型roc曲线执行德龙检验(delong test)
# Calculate ROC curves for each model
roc_model1 <- roc(y_true, y_model1)
roc_model2 <- roc(y_true, y_model2)
# Use the roc.test function to perform the Delong test
roc.test(roc_model1, roc_model2)
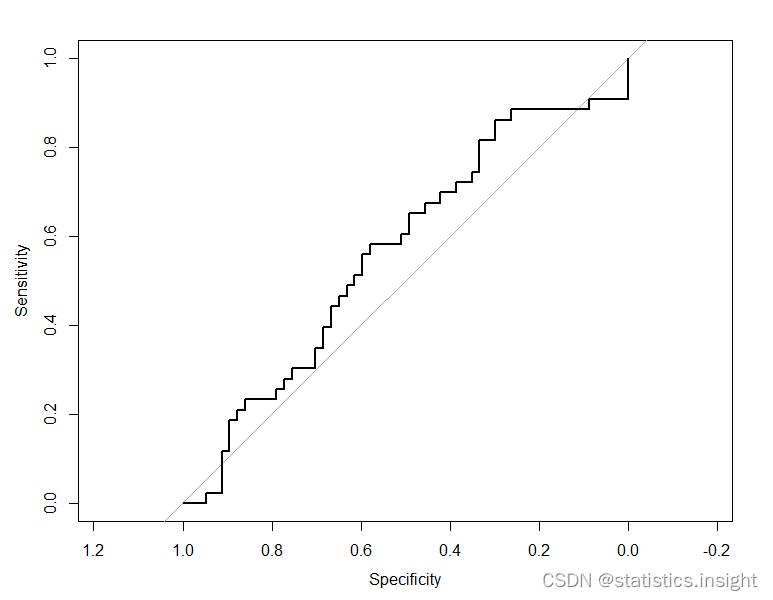
> plot(roc_model1)
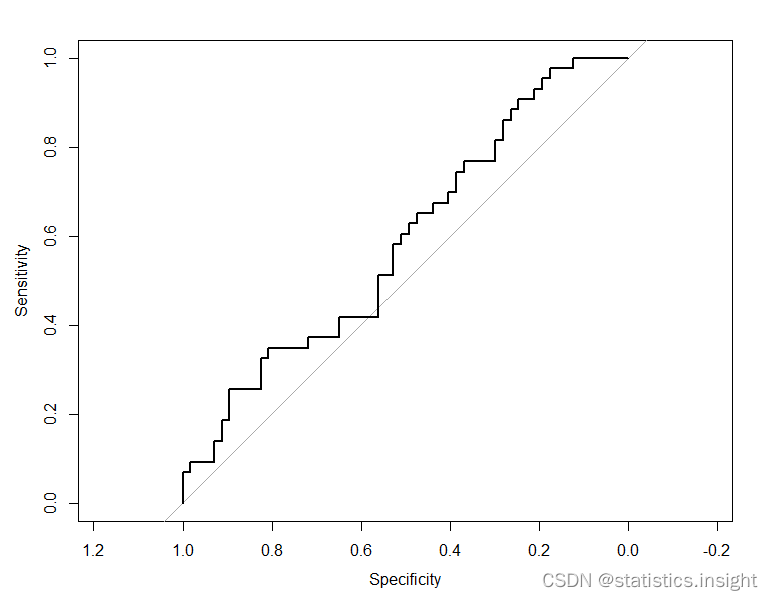
> plot(roc_model2)> plot(roc_model1)
> plot(roc_model2)
>
> roc.test(roc_model1, roc_model2)
Bootstrap test for two correlated ROC curves
data: roc_model1 and roc_model2
D = -0.31798, boot.n = 2000, boot.stratified = 1, p-value = 0.7505
alternative hypothesis: true difference in AUC is not equal to 0
sample estimates:
AUC of roc1 AUC of roc2
0.5618115 0.5883313
Delong Test, also known as DeLong's test, is a hypothesis test used to compare the performance of two classifiers. It is a statistical method that is commonly used to compare the area under the receiver operating characteristic (ROC) curves (AUCs) of two classifiers.
The ROC curve is a graphical representation of the performance of a binary classifier system as its discrimination threshold is varied. The AUC metric measures the overall ability of the classifier to discriminate between positive and negative cases. It can range from 0 to 1, where 1 indicates perfect discrimination and 0.5 indicates random guessing.
To perform the Delong test, the AUCs of the two classifiers are first calculated. The AUC values are then used to estimate the covariance matrix of the difference in the AUCs, which is used to calculate the test statistic, z.
The Delong test assumes that the difference between the two classifiers is normally distributed. If the null hypothesis is true, that is, the two classifiers have equal performance, then the test statistic follows a standard normal distribution.
The p-value of the Delong test is calculated using a two-tailed test. If the p-value is less than the significance level (usually 0.05), then there is evidence that the two classifiers have different performance. Otherwise, there is not enough evidence to conclude that the two classifiers have different performance.
安利一个R语言的优秀博主及其CSDN专栏:
博主博客地址:
Data+Science+Insight的博客_CSDN博客-R语言从入门到机器学习,数据科学从0到1,机器学习面试+横扫千军领域博主


 670
670

 被折叠的 条评论
为什么被折叠?
被折叠的 条评论
为什么被折叠?
 到【灌水乐园】发言


