


案例分析Prometheus监控MySQL主从数据库
1. 规划节点
节点规划,见表1。
表1 节点规划
| IP | 主机名 | 节点 |
|---|---|---|
| 192.168.100.3 | master | Prometheus + Grafana |
| 192.168.100.3 | master | mysql/master + mysqld_exporter + node_exporter |
| 192.168.100.4 | node | mysql/master + mysqld_exporter + node_exporter |
案例实施
1. 基础环境准备
(1)配置节点时间同步
[root@master ~]# yum install -y chrony
[root@master ~]# systemctl enable chronyd --now
[root@master ~]# vim /etc/chrony.conf
...
# Use public servers from the pool.ntp.org project.
# Please consider joining the pool (http://www.pool.ntp.org/join.html).
#server 0.centos.pool.ntp.org iburst
#server 1.centos.pool.ntp.org iburst
#server 2.centos.pool.ntp.org iburst
#server 3.centos.pool.ntp.org iburst
#server 192.168.100.3 iburst
server ntp1.aliyun.com iburst
server ntp2.aliyun.com iburst
server ntp3.aliyun.com iburst
...
# Allow NTP client access from local network.
#allow 192.168.0.0/16
allow 192.168.100.0/16
...
(2)重启服务
[root@master ~]# systemctl restart chronyd
(3)同步阿里云时间服务器
[root@master ~]# chronyc sources
210 Number of sources = 2
MS Name/IP address         Stratum Poll Reach LastRx Last sample
===============================================================================
^- 120.25.115.20                 2   6    25     2  +3773us[+3773us] +/-   26ms
^* 203.107.6.88                  2   6    17    10  +1189us[+4744us] +/-   19ms
[root@master ~]# date
Thu Sep 26 08:39:22 CST 2024
2. 配置MySQL主从
(1)配置 yum 源
[root@master ~]# vim /etc/yum.repos.d/centos.repo
[centos]
name=centos
baseurl=file:///opt/centos
gpgcheck=0
[k8s]
name=k8s
baseurl=file:///opt/kubernetes-repo
gpgcheck=0
(2)安装 mariadb 服务
master节点安装
[root@master ~]# yum install -y mariadb-server mariadb
启动服务
[root@master ~]# systemctl enable mariadb --now
设置mysql登录密码
[root@master ~]# mysqladmin password 000000
master节点配置 my.cnf 文件
[root@master ~]# vim /etc/my.cnf
[mysqld]
log_bin=mysql-bin
server_id=1
datadir=/var/lib/mysql
socket=/var/lib/mysql/mysql.sock
重启服务
[root@master ~]# systemctl restart mariadb
node节点安装
[root@node ~]# yum install -y mariadb-server mariadb
启动服务
[root@node ~]# systemctl enable mariadb --now
设置mysql登录密码
[root@node ~]# mysqladmin password 000000
node节点配置 my.cnf 文件
[root@node ~]# vim /etc/my.cnf
[mysqld]
log_bin=mysql-bin
server_id=2
datadir=/var/lib/mysql
socket=/var/lib/mysql/mysql.sock
重启服务
[root@node ~]# systemctl restart mariadb
(3)sql语句配置主从
master节点
[root@master ~]# mysql -uroot -p000000
Welcome to the MariaDB monitor.  Commands end with ; or \g.
Your MariaDB connection id is 3
Server version: 5.5.68-MariaDB MariaDB Server

Copyright (c) 2000, 2018, Oracle, MariaDB Corporation Ab and others.

Type 'help;' or '\h' for help. Type '\c' to clear the current input statement.

MariaDB [(none)]> grant replication slave on *.* to 'slave'@'%' identified by '000000';
Query OK, 0 rows affected (0.00 sec)

MariaDB [(none)]> grant replication slave on *.* to 'slave'@'localhost' identified by '000000';
Query OK, 0 rows affected (0.00 sec)

MariaDB [(none)]> flush privileges;
Query OK, 0 rows affected (0.00 sec)
node节点
[root@node ~]# mysql -uroot -p000000
Welcome to the MariaDB monitor.  Commands end with ; or \g.
Your MariaDB connection id is 6
Server version: 5.5.68-MariaDB MariaDB Server

Copyright (c) 2000, 2018, Oracle, MariaDB Corporation Ab and others.

Type 'help;' or '\h' for help. Type '\c' to clear the current input statement.

MariaDB [(none)]> CHANGE MASTER TO
    -> MASTER_HOST='192.168.100.3',
    -> MASTER_USER='slave',
    -> MASTER_PASSWORD='000000';
Query OK, 0 rows affected (0.01 sec)

MariaDB [(none)]> start slave;
Query OK, 0 rows affected (0.00 sec)

MariaDB [(none)]> show slave status\G
*************************** 1. row ***************************
               Slave_IO_State: Waiting for master to send event
                  Master_Host: 192.168.100.3
                  Master_User: slave
                  Master_Port: 3306
                Connect_Retry: 60
              Master_Log_File: mysql-bin.000001
          Read_Master_Log_Pos: 752
               Relay_Log_File: mariadb-relay-bin.000002
                Relay_Log_Pos: 1036
        Relay_Master_Log_File: mysql-bin.000001
             Slave_IO_Running: Yes
            Slave_SQL_Running: Yes
              Replicate_Do_DB:
          Replicate_Ignore_DB:
           Replicate_Do_Table:
       Replicate_Ignore_Table:
      Replicate_Wild_Do_Table:
  Replicate_Wild_Ignore_Table:
                   Last_Errno: 0
                   Last_Error:
                 Skip_Counter: 0
          Exec_Master_Log_Pos: 752
              Relay_Log_Space: 1332
              Until_Condition: None
               Until_Log_File:
                Until_Log_Pos: 0
           Master_SSL_Allowed: No
           Master_SSL_CA_File:
           Master_SSL_CA_Path:
              Master_SSL_Cert:
            Master_SSL_Cipher:
               Master_SSL_Key:
        Seconds_Behind_Master: 0
Master_SSL_Verify_Server_Cert: No
                Last_IO_Errno: 0
                Last_IO_Error:
               Last_SQL_Errno: 0
               Last_SQL_Error:
  Replicate_Ignore_Server_Ids:
             Master_Server_Id: 1
1 row in set (0.01 sec)
3. 编写启动项(方法一)
(1)安装 Prometheus
[root@master ~]# tar -zxvf prometheus-2.37.0.linux-amd64.tar.gz -C /usr/local/
[root@master ~]# mv /usr/local/prometheus-2.37.0.linux-amd64 /usr/local/prometheus
[root@master ~]# cd /usr/lib/systemd/system/
[root@master system]# cat prometheus.service
[Unit]
Description=prometheus

[Service]
ExecStart=/usr/local/prometheus/prometheus --config.file=/usr/local/prometheus/prometheus.yml
ExecReload=/bin/kill -HUP $MAINPID
KillMode=process
Restart=on-failure

[Install]
WantedBy=multi-user.target
重新加载 Systemd 配置文件
[root@master system]# systemctl daemon-reload
[root@master system]# systemctl enable prometheus --now
[root@master system]# netstat -ntpl | grep 9090
(2)安装 Grafana
[root@master ~]# tar -zxvf grafana-enterprise-8.3.6.linux-amd64.tar.gz -C /usr/local/
[root@master ~]# cd /usr/lib/systemd/system/
[root@master system]# cat grafana.service
[Unit]
Description=grafana

[Service]
ExecStart=/usr/local/grafana-8.3.6/bin/grafana-server -homepath=/usr/local/grafana-8.3.6/
ExecReload=/bin/kill -HUP $MAINPID
KillMode=process
Restart=on-failure

[Install]
WantedBy=multi-user.target
重新加载 Systemd 配置文件
[root@master system]# systemctl daemon-reload
[root@master system]# systemctl enable grafana --now
[root@master ~]# netstat -ntpl | grep 3000
(3)安装 Node Exporter
[root@master ~]# scp node_exporter-1.3.1.linux-amd64.tar.gz mysqld_exporter-0.12.1.linux-amd64.tar.gz master:/root/
[root@master ~]# scp node_exporter-1.3.1.linux-amd64.tar.gz mysqld_exporter-0.12.1.linux-amd64.tar.gz node:/root/
[root@master ~]# tar -zxvf node_exporter-1.3.1.linux-amd64.tar.gz -C /usr/local/
[root@master ~]# cd /usr/lib/systemd/system
[root@master system]# cat node_exporter.service
[Unit]
Description=node_exporter

[Service]
ExecStart=/usr/local/node_exporter-1.3.1.linux-amd64/node_exporter
Restart=always

[Install]
WantedBy=multi-user.target
重新加载 Systemd 配置文件
[root@master system]# systemctl daemon-reload
[root@master system]# systemctl enable node_exporter --now
[root@master system]# netstat -ntpl | grep node
(4)编写启动项
[root@master ~]# cd /usr/lib/systemd/system
[root@master system]# cat mysqld_exporter.service
[Unit]
Description=mysqld_exporter

[Service]
ExecStart=/usr/local/mysqld_exporter-0.12.1.linux-amd64/mysqld_exporter --config.my-cnf=/usr/local/mysqld_exporter-0.12.1.linux-amd64/my.cnf
Restart=always

[Install]
WantedBy=multi-user.target
重新加载 Systemd 配置文件
[root@master system]# systemctl daemon-reload
[root@master system]# systemctl enable mysqld_exporter --now
[root@master system]# netstat -ntpl | grep mysqld
4. 二进制启动(方法二)
(1)启动 Prometheus
[root@master ~]# tar -zxvf prometheus-2.37.0.linux-amd64.tar.gz -C /usr/local/
[root@master ~]# cd /usr/local/prometheus-2.37.0.linux-amd64/
[root@master prometheus-2.37.0.linux-amd64]# nohup ./prometheus &
[root@master prometheus-2.37.0.linux-amd64]# netstat -ntpl | grep 9090
(2)启动 Grafana
[root@master ~]# tar -zxvf grafana-enterprise-8.3.6.linux-amd64.tar.gz -C /usr/local/
[root@master ~]# cd /usr/local/grafana-8.3.6/bin
[root@master bin]# nohup ./grafana-server &
[root@master bin]# netstat -ntpl | grep 3000
(3)启动 Node Exporter
[root@master ~]# tar -zxvf node_exporter-1.3.1.linux-amd64.tar.gz -C /usr/local/
[root@master ~]# cd /usr/local/node_exporter-1.3.1.linux-amd64/
[root@master node_exporter-1.3.1.linux-amd64]# nohup ./node_exporter &
[root@master node_exporter-1.3.1.linux-amd64]# netstat -ntpl | grep 9100
(4)安装 mysqld_exporter
[root@master ~]# tar -zvxf mysqld_exporter-0.12.1.linux-amd64.tar.gz -C /usr/local/
[root@master ~]# cd /usr/local/mysqld_exporter-0.12.1.linux-amd64/
[root@master mysqld_exporter-0.14.0.linux-amd64]# cat my.cnf
[client]
user=root
password='123456'
[root@master mysqld_exporter-0.14.0.linux-amd64]# ./mysqld_exporter --config.my-cnf=./my.cnf
5. 配置 Prometheus 监控
(1)编写监控系统的配置文件
[root@master ~]# cd /usr/local/prometheus/
[root@master prometheus]# cat prometheus.yml
# my global config
global:
  scrape_interval: 5s
  evaluation_interval: 5s

# Alertmanager configuration
alerting:
  alertmanagers:
    - static_configs:
        - targets:
          # - alertmanager:9093

# Load rules once and periodically evaluate them according to the global 'evaluation_interval'.
rule_files:
  # - "first_rules.yml"
  # - "second_rules.yml"

# Scrape configurations
scrape_configs:
  - job_name: "prometheus"
    static_configs:
      - targets: ["localhost:9090"]

  - job_name: "mysql-master-slave"
    static_configs:
      - targets: ["192.168.100.3:9104"]
      - targets: ["192.168.100.4:9104"]
        labels:
          instance: mysql-master-slave

  - job_name: "nodes"
    static_configs:
      - targets: ["192.168.100.3:9100"]
      - targets: ["192.168.100.4:9100"]
        labels:
          instance: nodes
  - job_name: "grafana"
    static_configs:
      - targets: ["192.168.100.3:3000"]
        labels:
          instance: grafana
(2)重启 Prometheus 后刷新页面
# 启动项方式部署
[root@master system]# systemctl restart prometheus
# 二进制启动
[root@master prometheus-2.37.0.linux-amd64]# netstat -ntpl | grep prometheus
tcp6       0      0 :::9090                 :::*                    LISTEN      128942/./prometheus
[root@master prometheus-2.37.0.linux-amd64]# pkill -9 prometheus
[root@master prometheus-2.37.0.linux-amd64]# ./prometheus
(3)登录到 Prometheus 控制台查看状态
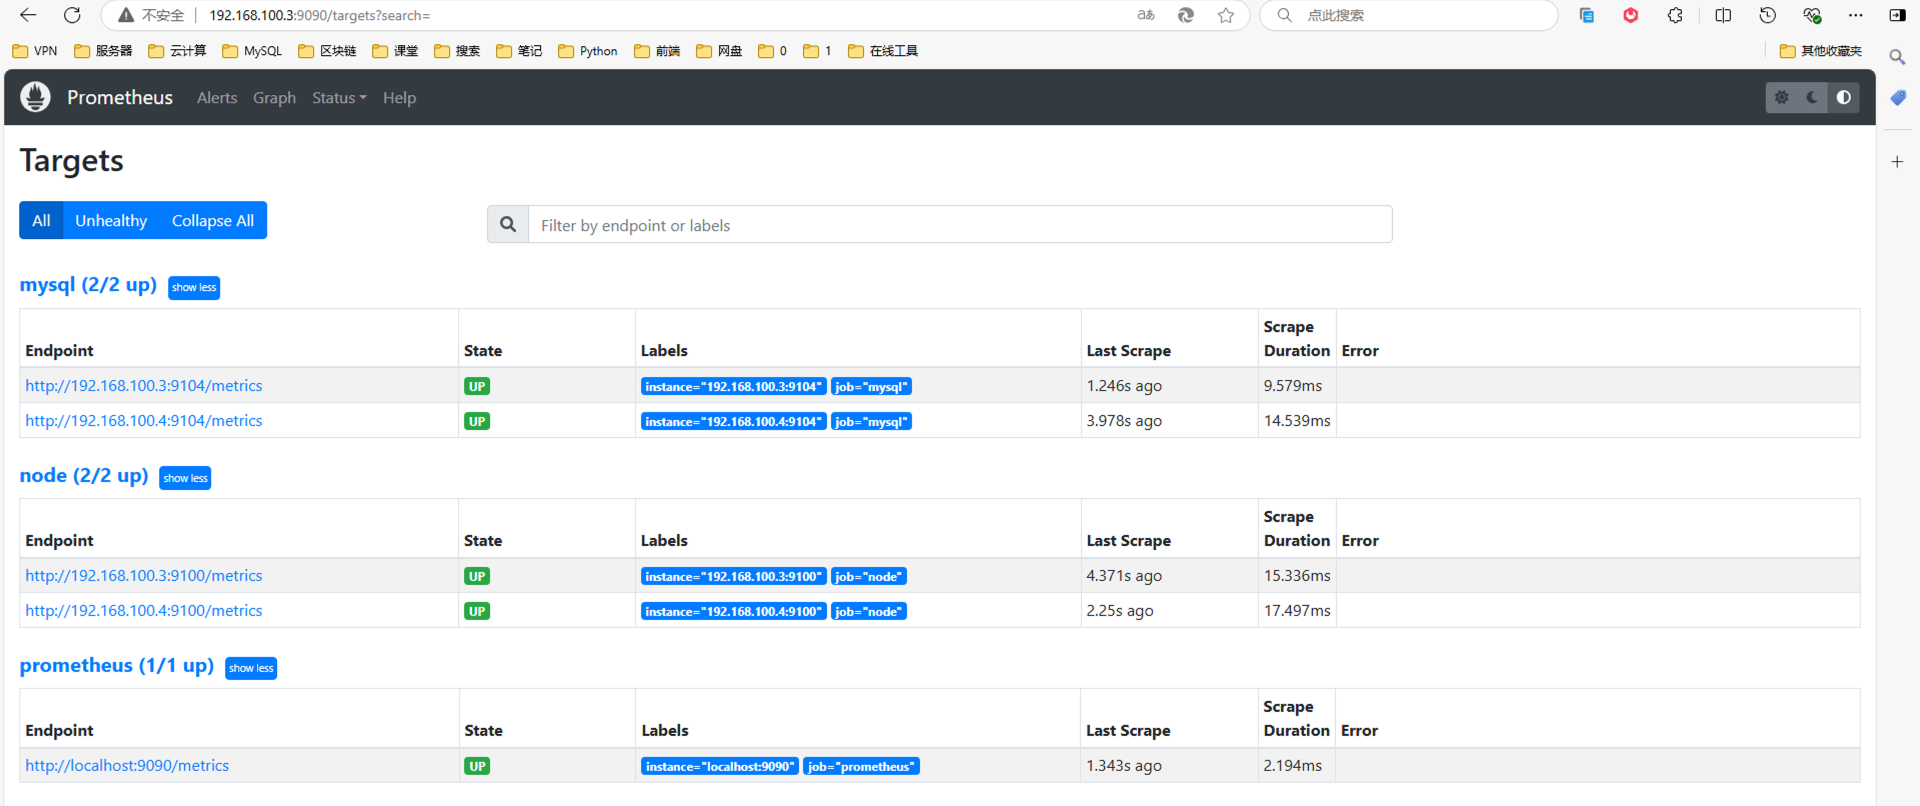
如果出现报错 out of bounds 删除数据目录
[root@master prometheus-2.37.0.linux-amd64]# ll
total 206628
drwxr-xr-x 2 3434 3434        38 Jul 14  2022 console_libraries
drwxr-xr-x 2 3434 3434       173 Jul 14  2022 consoles
drwxr-xr-x 8 root root       206 Sep 26 07:00 data
-rw-r--r-- 1 3434 3434     11357 Jul 14  2022 LICENSE
-rw------- 1 root root    434968 Sep 25 19:07 nohup.out
-rw-r--r-- 1 3434 3434      3773 Jul 14  2022 NOTICE
-rwxr-xr-x 1 3434 3434 109655433 Jul 14  2022 prometheus
-rw-r--r-- 1 3434 3434      1175 Sep 25 19:11 prometheus.yml
-rwxr-xr-x 1 3434 3434 101469395 Jul 14  2022 promtool
[root@master prometheus-2.37.0.linux-amd64]# rm -rf data/
再次启动 Prometheus
[root@master prometheus-2.37.0.linux-amd64]# ./prometheus
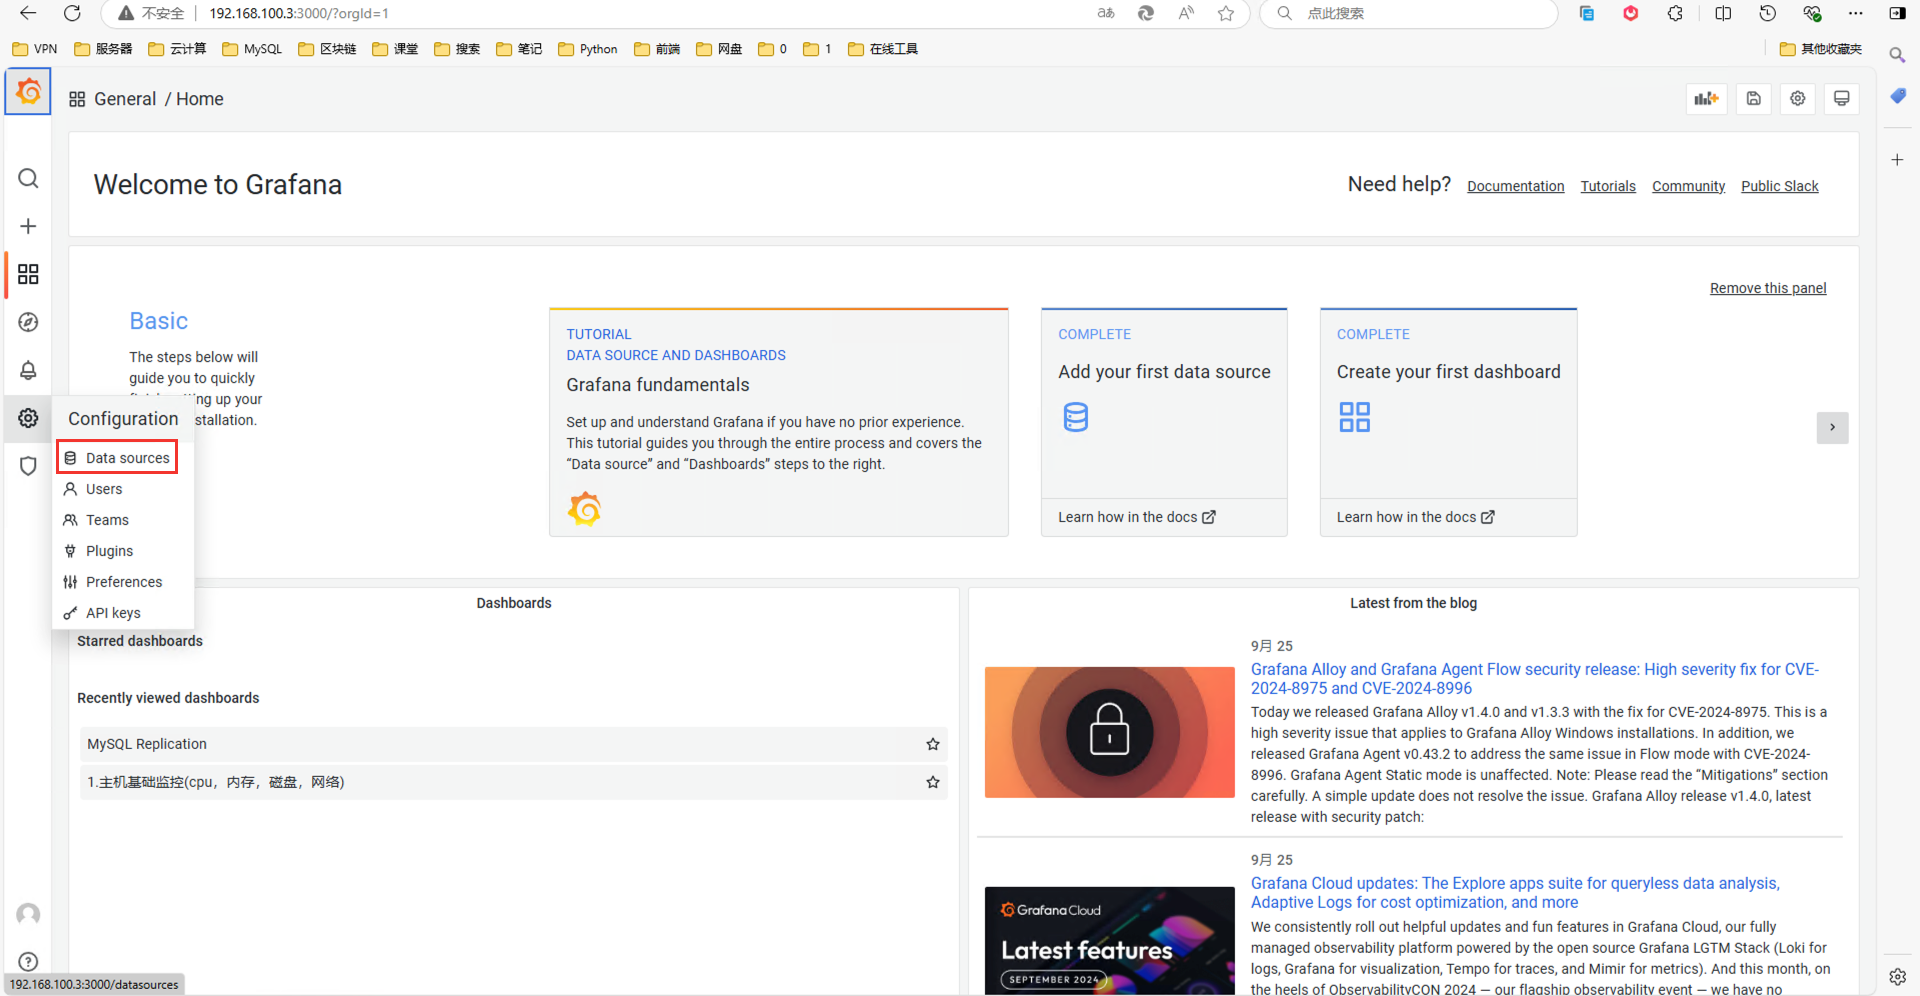
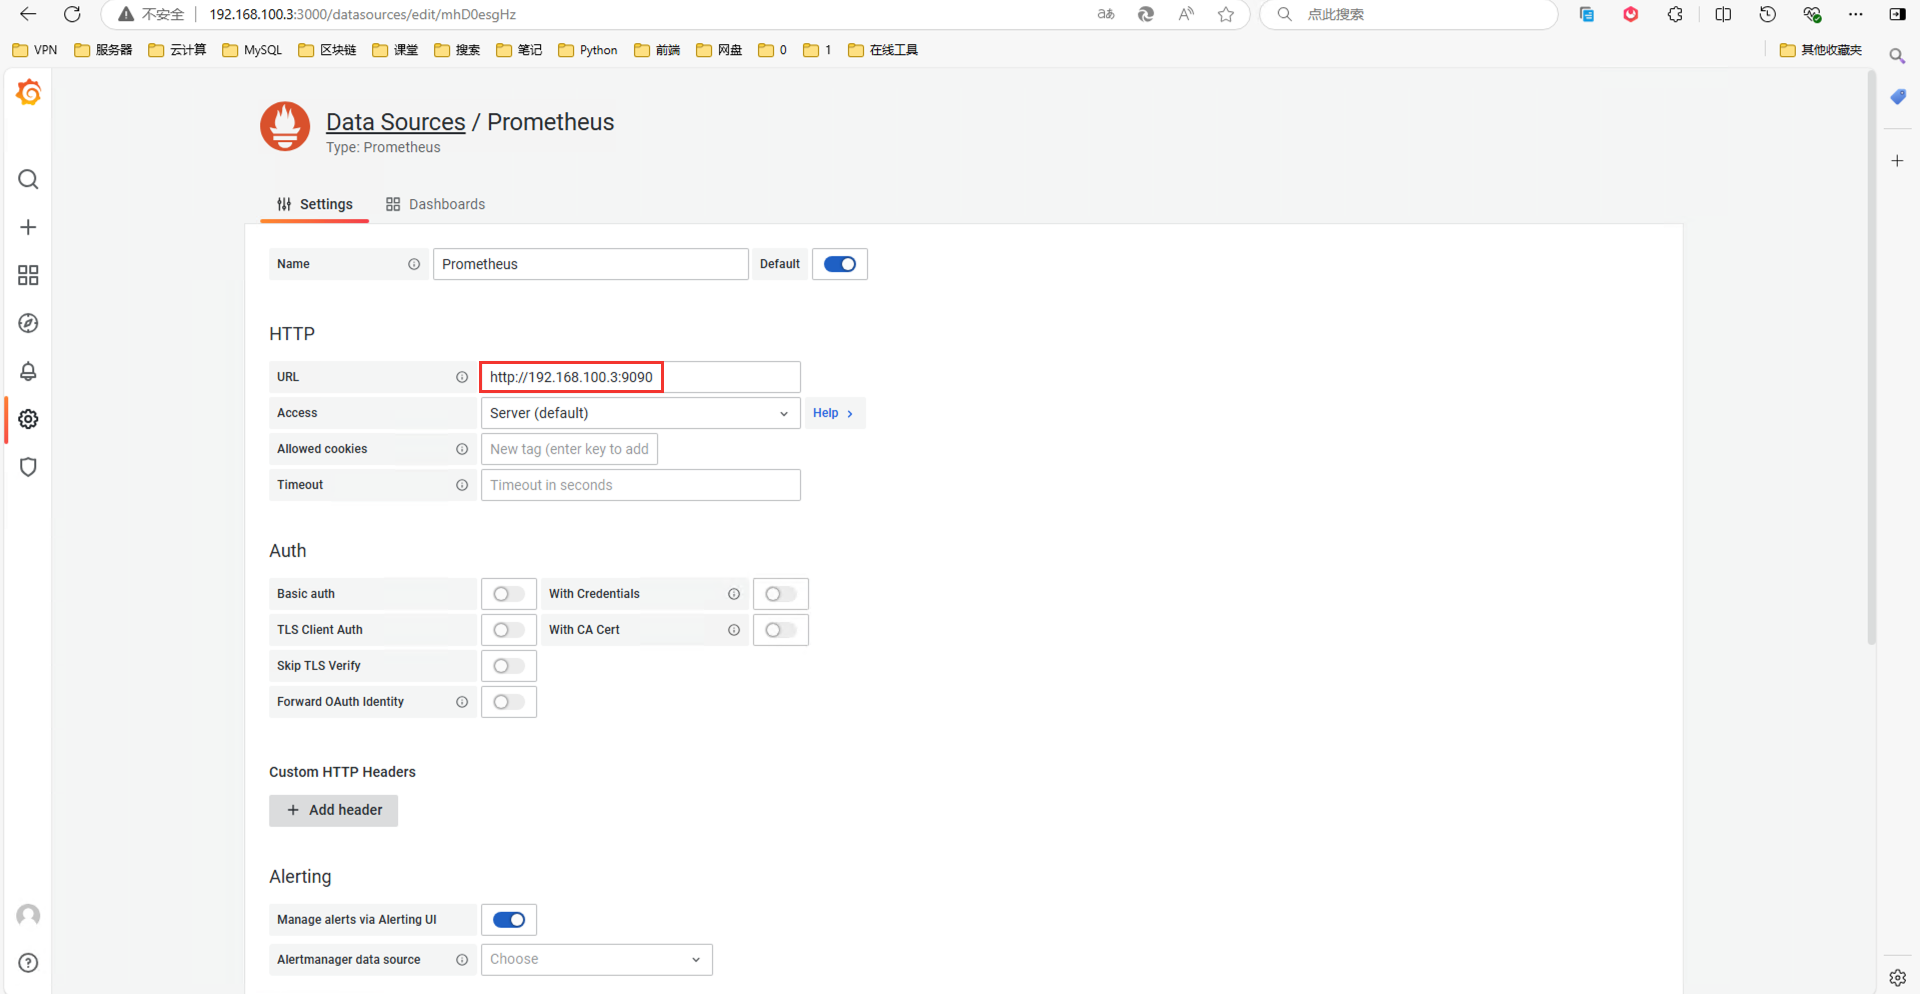
(4)配置 Grafana 监控模版
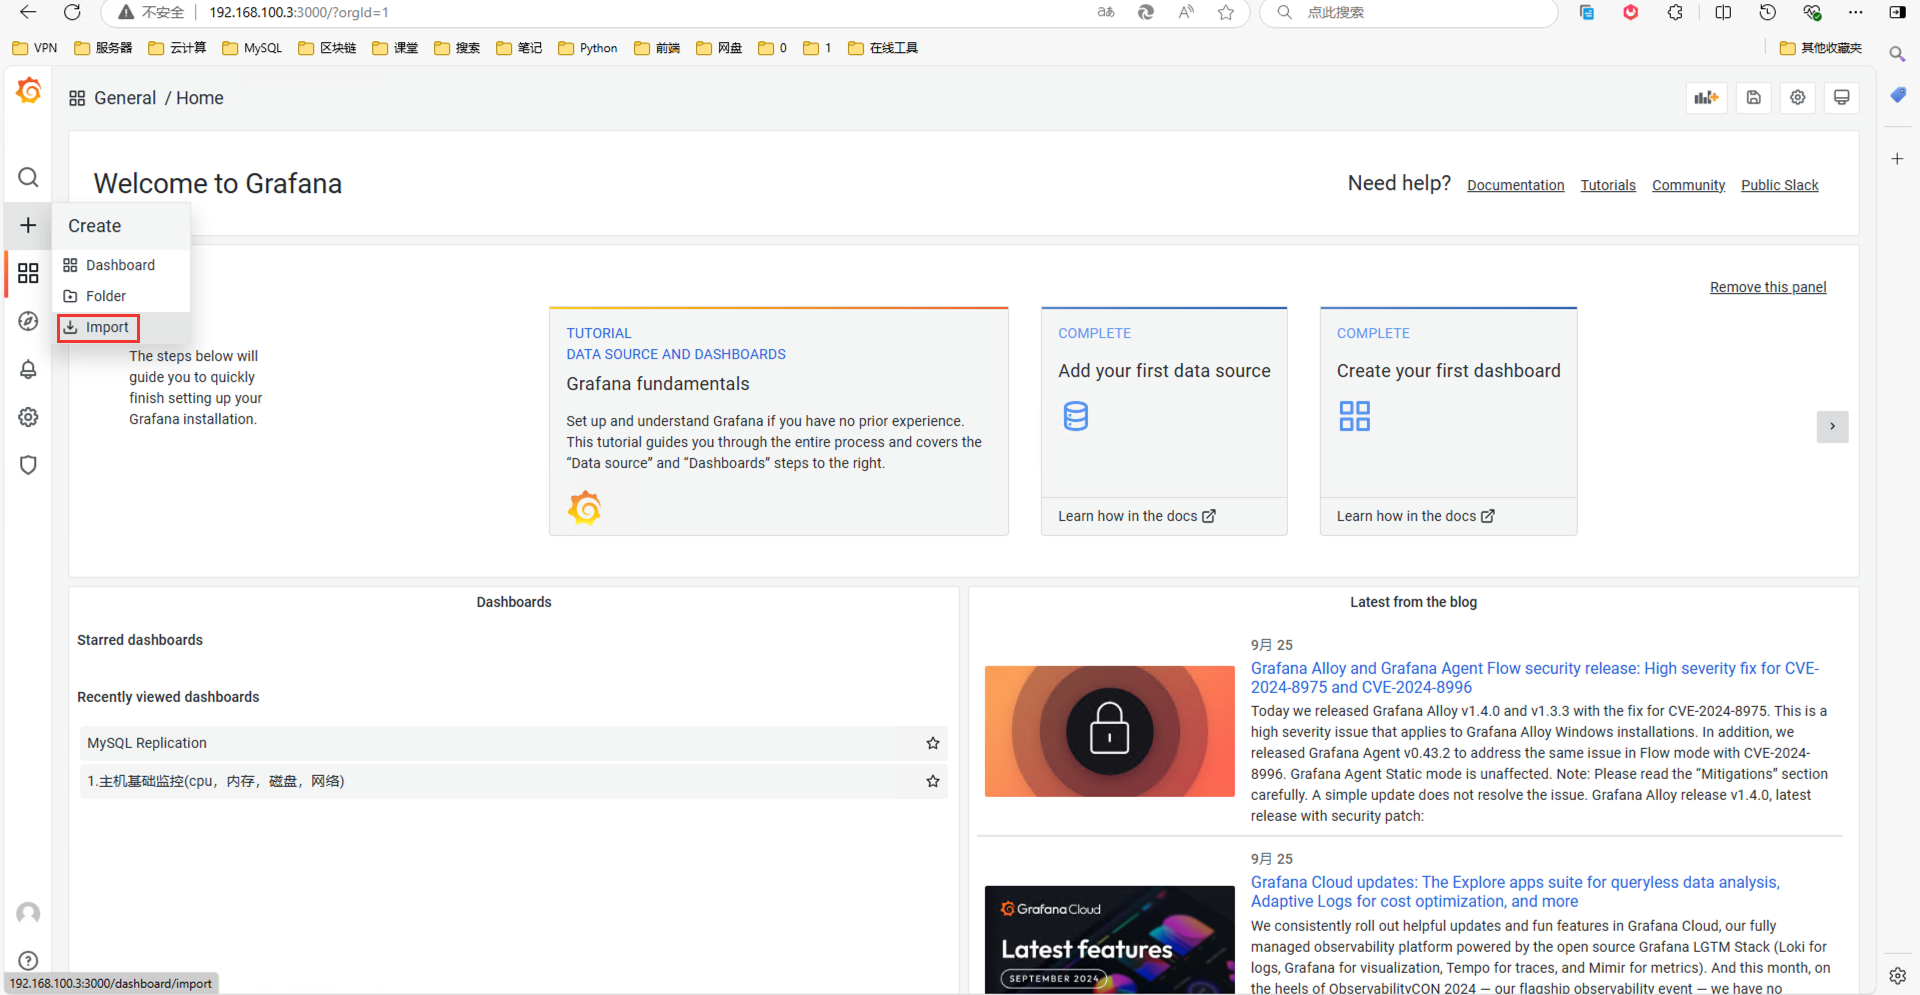
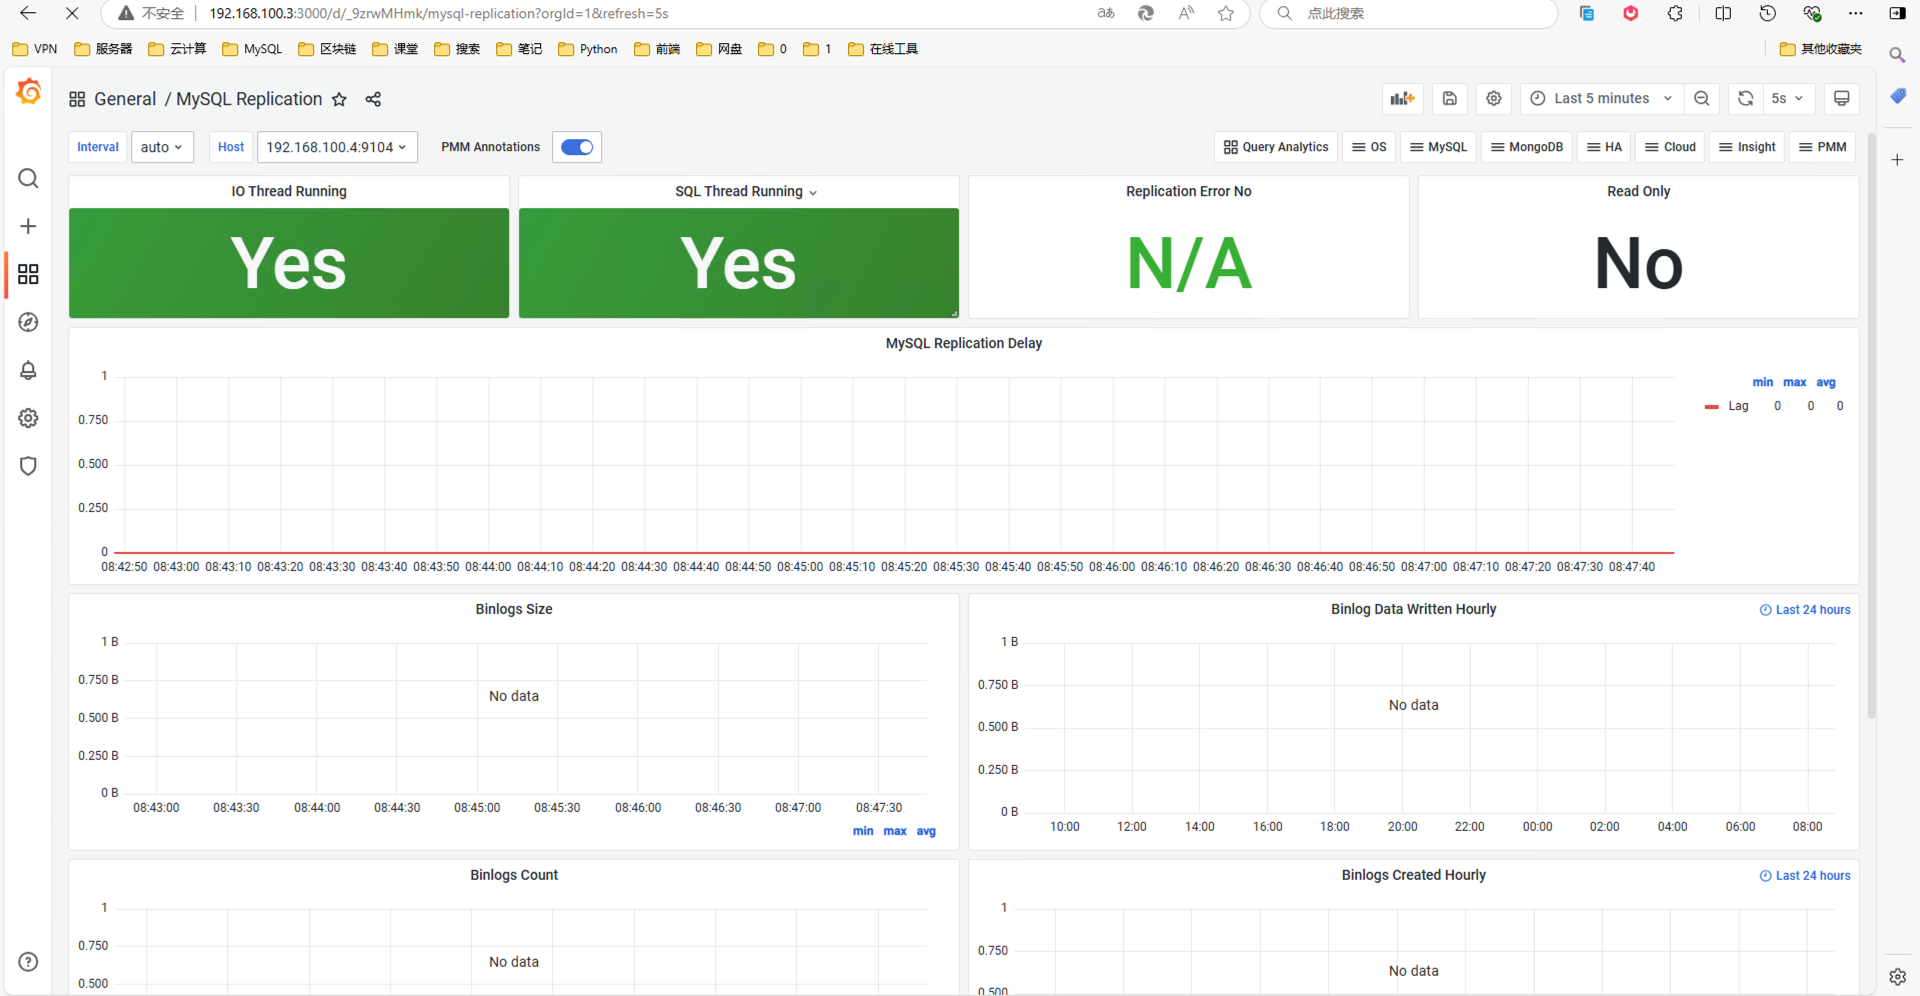
(5)配置 Grafana Dashboard
(6)查看 MySQL 状态
监控模板7371
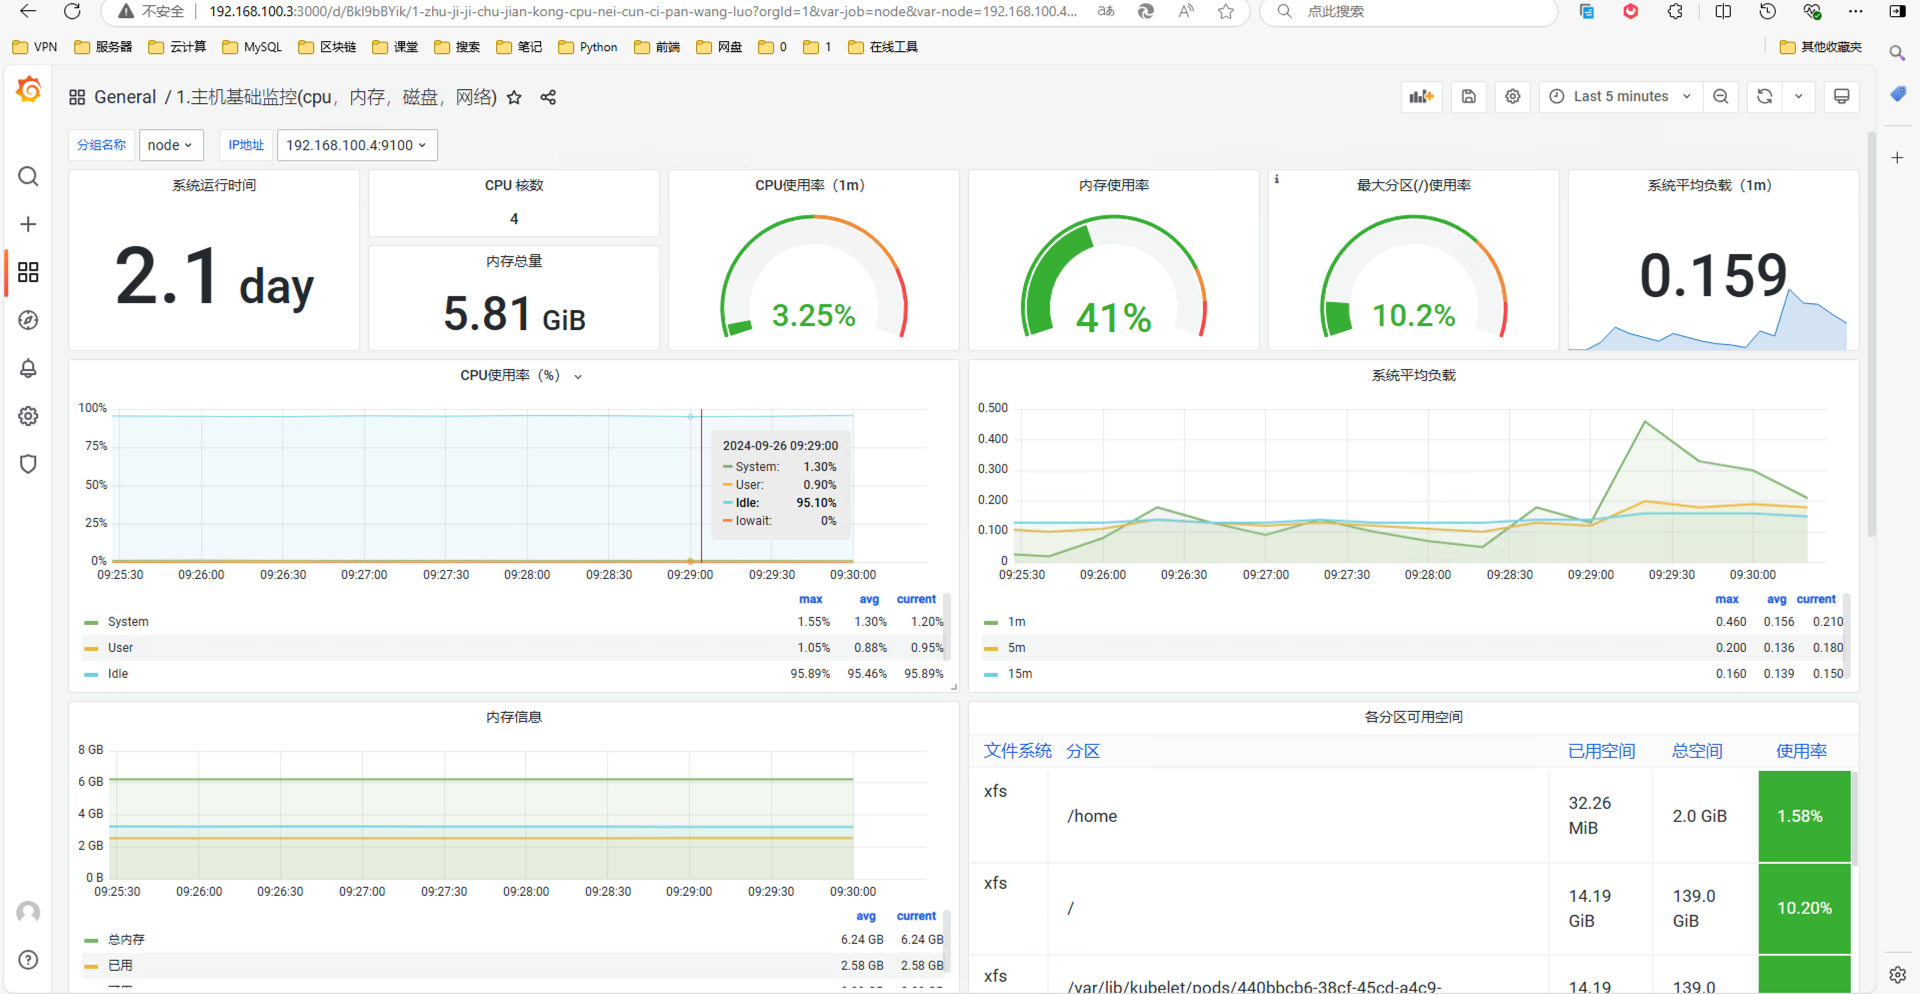
(7)查看 Node 状态
监控模版12227


 7万+
7万+

 被折叠的 条评论
为什么被折叠?
被折叠的 条评论
为什么被折叠?
 到【灌水乐园】发言


