


一、前言
通过这个系列,我们将学习 canvas 的基本内容,并且通过两个案例实现,即一个表格绘制工具(其支持表格数据渲染),一个画图工具(其支持常见图形绘制,以及撤销和恢复等功能),来掌握基于 canvas 的复杂交互实现。
今天我们首先实现一个表格绘制工具。
二、功能设计
- 绘制表格数据并填充单元格内容
- 单元格点击触发事件
- 支持动态调整列宽
三、具体实现
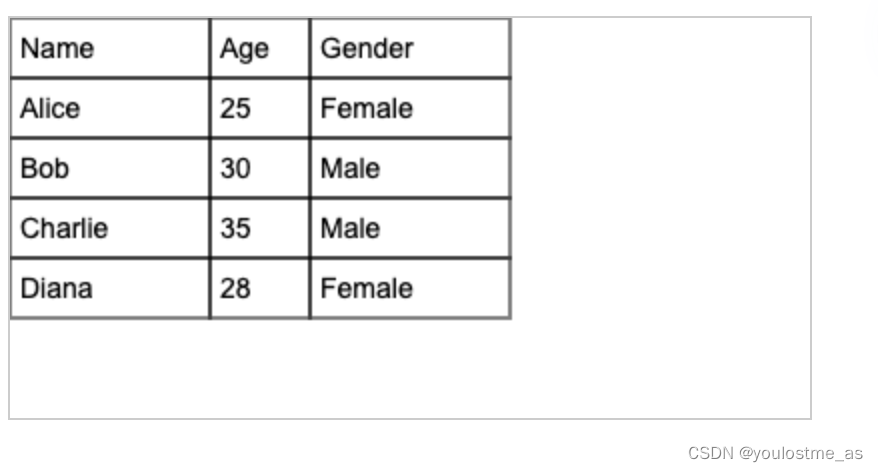
1. 绘制表格数据并填充单元格内容
<canvas id="myCanvas" width="400" height="200"></canvas>
canvas {
  border: 1px solid #ccc;
}
const canvas = document.getElementById('myCanvas');
const ctx = canvas.getContext('2d');
const data = [
  ['Name', 'Age', 'Gender'],
  ['Alice', 25, 'Female'],
  ['Bob', 30, 'Male'],
  ['Charlie', 35, 'Male'],
  ['Diana', 28, 'Female']
];
const columnWidths = [100, 50, 100]; // 列宽
const rowHeight = 30; // 行高
const borderWidth = 1; // 边框宽度

function drawTable() {
  ctx.clearRect(0, 0, canvas.width, canvas.height);
  ctx.fillStyle = '#fff'; // 设置填充颜色为白色
  ctx.fillRect(0, 0, canvas.width, canvas.height);

  for (let i = 0; i < data.length; i++) {
    for (let j = 0; j < data[i].length; j++) {
      const cellX = j === 0 ? 0 : columnWidths.reduce((accumulator, currentValue, idx) => { if (idx < j) { return accumulator + currentValue } else { return accumulator } }, 0);
      const cellY = i * rowHeight;
      const cellWidth = columnWidths[j];
      const cellHeight = rowHeight;

      // 绘制单元格边框
      ctx.strokeStyle = '#000'; // 设置边框颜色为黑色
      ctx.lineWidth = borderWidth;
      ctx.strokeRect(cellX, cellY, cellWidth, cellHeight);

      // 绘制单元格内容
      ctx.fillStyle = '#000'; // 设置文本颜色为黑色
      ctx.font = '14px Arial'; // 设置字体样式
      ctx.fillText(data[i][j], cellX + 5, cellY + 20); // 绘制文本内容
    }
  }
}

drawTable();
2. 单元格点击触发事件
2.1 点击单元格时触发 alert
思路:我们可以在单元格上添加点击事件,并在点击事件处理函数中获取单元格的内容,然后调用 alert() 方法进行弹窗提示。
const canvas = document.getElementById('myCanvas');
const ctx = canvas.getContext('2d');

const data = [
  ['Name', 'Age', 'Gender'],
  ['Alice', 25, 'Female'],
  ['Bob', 30, 'Male'],
  ['Charlie', 35, 'Male'],
  ['Diana', 28, 'Female']
];
const columnWidths = [100, 50, 100]; // 列宽
const rowHeight = 30; // 行高
const borderWidth = 1; // 边框宽度

// main code
canvas.addEventListener('click', function(event) {
  const x = event.offsetX;
  const y = event.offsetY;

  const rowIndex = Math.floor(y / rowHeight);

  // 注意,列是动态列宽
  let columnIndex = -1;
  let totalWidth = 0;
  for (let i = 0; i < columnWidths.length; i++) {
    totalWidth += columnWidths[i];
    if (x < totalWidth) {
      columnIndex = i;
      break;
    }
  }
  if (data[rowIndex] && data[rowIndex][columnIndex]) {
    const content = data[rowIndex][columnIndex];
    alert(content);
  }
});

function drawTable() {
  ctx.clearRect(0, 0, canvas.width, canvas.height);
  ctx.fillStyle = '#fff'; // 设置填充颜色为白色
  ctx.fillRect(0, 0, canvas.width, canvas.height);

  for (let i = 0; i < data.length; i++) {
    for (let j = 0; j < data[i].length; j++) {
      const cellX = j === 0 ? 0 : columnWidths.reduce((accumulator, currentValue, idx) => { if (idx < j) { return accumulator + currentValue } else { return accumulator } }, 0);
      const cellY = i * rowHeight;
      const cellWidth = columnWidths[j];
      const cellHeight = rowHeight;

      // 绘制单元格边框
      ctx.strokeStyle = '#000'; // 设置边框颜色为黑色
      ctx.lineWidth = borderWidth;
      ctx.strokeRect(cellX, cellY, cellWidth, cellHeight);

      // 绘制单元格内容
      ctx.fillStyle = '#000'; // 设置文本颜色为黑色
      ctx.font = '14px Arial'; // 设置字体样式
      ctx.fillText(data[i][j], cellX + 5, cellY + 20); // 绘制文本内容
    }
  }
}

drawTable();
在这个实现中,需要注意不同列的宽度不一样,我们需要根据点击位置来动态计算对应的列索引。可以通过循环遍历每一列的宽度,累加宽度值,并在累加值大于点击位置的 x 坐标时,就找到了对应的列索引。然后再根据点击位置的 y 坐标计算出行索引。这样就可以正确地根据点击位置找到对应的单元格了。
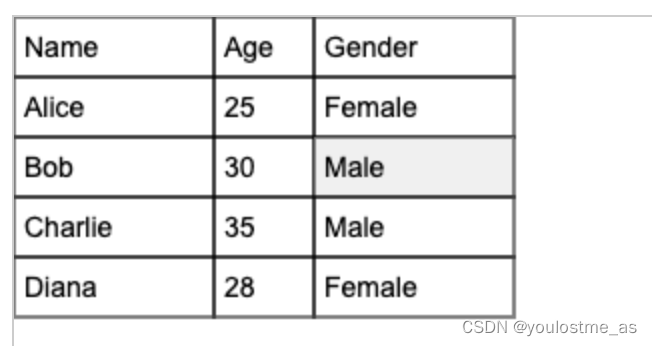
2.2 点击单元格时触发高亮色
思路:我们可以在点击事件处理函数中记录当前点击的单元格索引,然后在绘制表格的函数中根据记录的索引信息来绘制高亮效果。
const canvas = document.getElementById('myCanvas');
const ctx = canvas.getContext('2d');
const data = [
  ['Name', 'Age', 'Gender'],
  ['Alice', 25, 'Female'],
  ['Bob', 30, 'Male'],
  ['Charlie', 35, 'Male'],
  ['Diana', 28, 'Female']
];
const columnWidths = [100, 50, 100]; // 列宽
const rowHeight = 30; // 行高
const borderWidth = 1; // 边框宽度

// main code
let highlightedCell = null; // 用于记录高亮的单元格索引
canvas.addEventListener('click', function(event) {
  const x = event.offsetX;
  const y = event.offsetY;

  const rowIndex = Math.floor(y / rowHeight);

  // 注意,列是动态列宽
  let columnIndex = -1;
  let totalWidth = 0;
  for (let i = 0; i < columnWidths.length; i++) {
    totalWidth += columnWidths[i];
    if (x < totalWidth) {
      columnIndex = i;
      break;
    }
  }
  if (data[rowIndex] && data[rowIndex][columnIndex]) {
	highlightedCell = {
      row: rowIndex,
      column: columnIndex,
    }
    drawTable();
  }
});

function drawTable() {
  ctx.clearRect(0, 0, canvas.width, canvas.height);
  ctx.fillStyle = '#fff'; // 设置填充颜色为白色
  ctx.fillRect(0, 0, canvas.width, canvas.height);

  for (let i = 0; i < data.length; i++) {
    for (let j = 0; j < data[i].length; j++) {
      const cellX = j === 0 ? 0 : columnWidths.reduce((accumulator, currentValue, idx) => { if (idx < j) { return accumulator + currentValue } else { return accumulator } }, 0);
      const cellY = i * rowHeight;
      const cellWidth = columnWidths[j];
      const cellHeight = rowHeight;

      if (highlightedCell && highlightedCell.row === i && highlightedCell.column === j) {
        ctx.fillStyle = '#f0f0f0'; // 设置高亮背景色为灰色
        ctx.fillRect(cellX, cellY, cellWidth, cellHeight);
      }

      // 绘制单元格边框
      ctx.strokeStyle = '#000'; // 设置边框颜色为黑色
      ctx.lineWidth = borderWidth;
      ctx.strokeRect(cellX, cellY, cellWidth, cellHeight);

      // 绘制单元格内容
      ctx.fillStyle = '#000'; // 设置文本颜色为黑色
      ctx.font = '14px Arial'; // 设置字体样式
      ctx.fillText(data[i][j], cellX + 5, cellY + 20); // 绘制文本内容
    }
  }
}

drawTable();
3. 支持动态调整列宽
要支持拖拽调整列宽,你可以通过监听鼠标按下、移动和释放事件来实现。
并且,我们添加了一个小优化,在鼠标移动到边框范围内时,鼠标将展示为拖拽形态。
const canvas = document.getElementById('myCanvas');
const ctx = canvas.getContext('2d');
const data = [
  ['Name', 'Age', 'Gender'],
  ['Alice', 25, 'Female'],
  ['Bob', 30, 'Male'],
  ['Charlie', 35, 'Male'],
  ['Diana', 28, 'Female']
];
const columnWidths = [100, 50, 100]; // 列宽
const rowHeight = 30; // 行高
const borderWidth = 1; // 边框宽度

// main code
let isResizing = false; // 是否正在调整列宽
let resizingColumnIndex = -1; // 正在调整列宽的列索引
let startX = 0; // 调整列宽时鼠标按下的起始位置
canvas.addEventListener('mousemove', function(event) {
  // 悬浮遇到边框切换鼠标形态
  const x = event.offsetX;
  let isHovering = false;
  let totalWidth = 0;
  for (let i = 0; i < columnWidths.length - 1; i++) {
    totalWidth += columnWidths[i];
    if (Math.abs(x - totalWidth) < 5) { // 假设拖拽宽度小于5像素
      isHovering = true;
      break;
    }
  }
  if(isHovering) {
    canvas.style.cursor = 'col-resize';
  } else {
    canvas.style.cursor = 'default';
  }

  // 若鼠标 mousedown 的区域是边框并且正在拖动
  if (isResizing) {
    const offsetX = x - startX;
    columnWidths[resizingColumnIndex] += offsetX; // 调整列宽

    startX = x;
    drawTable(); // 重新绘制表格以更新列宽
  }
});
canvas.addEventListener('mousedown', function(event) {
  const x = event.offsetX;

  // 判断鼠标是否在列边界上
  let totalWidth = 0;
  for (let i = 0; i < columnWidths.length - 1; i++) {
    totalWidth += columnWidths[i];
    if (Math.abs(x - totalWidth) < 5) { // 假设拖拽宽度小于5像素
      isResizing = true;
      resizingColumnIndex = i;
      startX = x;
      break;
    }
  }
});
canvas.addEventListener('mouseup', function(event) {
  isResizing = false;
  resizingColumnIndex = -1;
});


function drawTable() {
  ctx.clearRect(0, 0, canvas.width, canvas.height);
  ctx.fillStyle = '#fff'; // 设置填充颜色为白色
  ctx.fillRect(0, 0, canvas.width, canvas.height);

  for (let i = 0; i < data.length; i++) {
    for (let j = 0; j < data[i].length; j++) {
      const cellX = j === 0 ? 0 : columnWidths.reduce((accumulator, currentValue, idx) => { if (idx < j) { return accumulator + currentValue } else { return accumulator } }, 0);
      const cellY = i * rowHeight;
      const cellWidth = columnWidths[j];
      const cellHeight = rowHeight;

      // 绘制单元格边框
      ctx.strokeStyle = '#000'; // 设置边框颜色为黑色
      ctx.lineWidth = borderWidth;
      ctx.strokeRect(cellX, cellY, cellWidth, cellHeight);

      // 绘制单元格内容
      ctx.fillStyle = '#000'; // 设置文本颜色为黑色
      ctx.font = '14px Arial'; // 设置字体样式
      ctx.fillText(data[i][j], cellX + 5, cellY + 20); // 绘制文本内容
    }
  }
}

drawTable();


 1788
1788

 被折叠的 条评论
为什么被折叠?
被折叠的 条评论
为什么被折叠?
 到【灌水乐园】发言


