案例
使用
<template>
<div>
<div id="echarts" style="width: 500px;height: 400px;"></div>
</div>
</template>
<script setup lang="ts">
import { ref, reactive, toRefs, onMounted, onBeforeUnmount, onActivated, onDeactivated, nextTick } from 'vue'
import resize from './utils/resize';
import * as echarts from 'echarts/core';
import {
TitleComponent,
ToolboxComponent,
TooltipComponent,
GridComponent,
LegendComponent
} from 'echarts/components';
import { LineChart } from 'echarts/charts';
import { UniversalTransition } from 'echarts/features';
import { CanvasRenderer } from 'echarts/renderers';
echarts.use([
TitleComponent,
ToolboxComponent,
TooltipComponent,
GridComponent,
LegendComponent,
LineChart,
CanvasRenderer,
UniversalTransition
]);
const { mounted, chart, beforeDestroy, activated, deactivated } = resize();
onBeforeUnmount(() => {
beforeDestroy();
});
onActivated(() => {
activated();
});
onDeactivated(() => {
deactivated();
});
onMounted(() => {
mounted();
nextTick(() => {
initChart();
});
});
const initChart = () => {
// 设置option
const option = {
tooltip: {
trigger: 'axis'
},
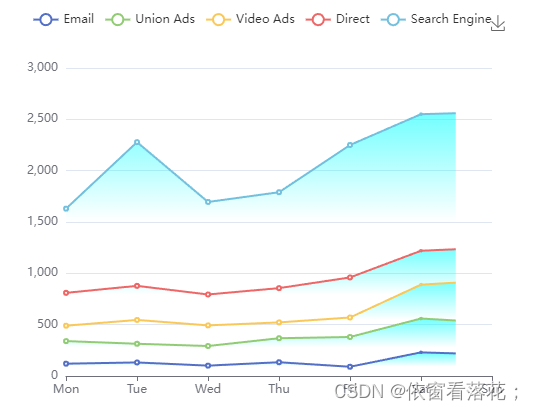
legend: {
data: ['Email', 'Union Ads', 'Video Ads', 'Direct', 'Search Engine']
},
grid: {
left: '3%',
right: '4%',
bottom: '3%',
containLabel: true
},
toolbox: {
feature: {
saveAsImage: {}
}
},
xAxis: {
type: 'category',
boundaryGap: false,
data: ['Mon', 'Tue', 'Wed', 'Thu', 'Fri', 'Sat', 'Sun']
},
yAxis: {
type: 'value'
},
series: [
{
name: 'Email',
type: 'line',
stack: 'Total',
data: [120, 132, 101, 134, 90, 230, 210],
areaStyle: {
color: {
//线性渐变
type: 'linear',
x: 0,
y: 0,
x2: 0,
y2: 1,
colorStops: [{
offset: 0, color: 'rgba(1, 255, 255, 0.8)', // 0% 处的颜色
}, {
offset: 0.6, color: 'rgba(1, 255, 255,0)', // 100% 处的颜色
}],
global: false, // 缺省为 false
},
},
},
{
name: 'Union Ads',
type: 'line',
stack: 'Total',
data: [220, 182, 191, 234, 290, 330, 310],
areaStyle: {
color: {
//线性渐变
type: 'linear',
x: 0,
y: 0,
x2: 0,
y2: 1,
colorStops: [{
offset: 0, color: 'rgba(1, 255, 255, 0.8)', // 0% 处的颜色
}, {
offset: 0.6, color: 'rgba(1, 255, 255,0)', // 100% 处的颜色
}],
global: false, // 缺省为 false
},
},
},
{
name: 'Video Ads',
type: 'line',
stack: 'Total',
data: [150, 232, 201, 154, 190, 330, 410],
areaStyle: {
color: {
//线性渐变
type: 'linear',
x: 0,
y: 0,
x2: 0,
y2: 1,
colorStops: [{
offset: 0, color: 'rgba(1, 255, 255, 0.8)', // 0% 处的颜色
}, {
offset: 0.6, color: 'rgba(1, 255, 255,0)', // 100% 处的颜色
}],
global: false, // 缺省为 false
},
},
},
{
name: 'Direct',
type: 'line',
stack: 'Total',
data: [320, 332, 301, 334, 390, 330, 320],
areaStyle: {
color: {
//线性渐变
type: 'linear',
x: 0,
y: 0,
x2: 0,
y2: 1,
colorStops: [{
offset: 0, color: 'rgba(1, 255, 255, 0.8)', // 0% 处的颜色
}, {
offset: 0.6, color: 'rgba(1, 255, 255,0)', // 100% 处的颜色
}],
global: false, // 缺省为 false
},
},
},
{
name: 'Search Engine',
type: 'line',
stack: 'Total',
data: [820, 1400, 901, 934, 1290, 1330, 1320],
areaStyle: {
color: {
//线性渐变
type: 'linear',
x: 0,
y: 0,
x2: 0,
y2: 1,
colorStops: [{
offset: 0, color: 'rgba(1, 255, 255, 0.8)', // 0% 处的颜色
}, {
offset: 0.6, color: 'rgba(1, 255, 255,0)', // 100% 处的颜色
}],
global: false, // 缺省为 false
},
},
}
]
}
// 获取dom
const chartDom: any = document.getElementById('echarts')
// 重新初始化ECharts图表实例时不会出现冲突
chartDom.removeAttribute('_echarts_instance_')
// 初始化
const myChart = echarts.init(chartDom)
// loading
myChart.showLoading({
text: 'loading',
color: '#c23531',
textColor: '#000',
maskColor: 'rgba(255, 255, 255, 0.2)',
zlevel: 0,
})
setTimeout(() => {
// setOption前隐藏loading事件
myChart.hideLoading()
// 使用setoption
option && myChart.setOption(option)
// 数据赋值
chart.value = myChart
}, 1000)
}
</script>
<style scoped></style>
resize.ts
import { ref } from 'vue';
export default function () {
  const chart = ref<any>();
  const sidebarElm = ref<Element>();

  const chartResizeHandler = () => {
    if (chart.value) {
      chart.value.resize();
    }
  };

  const sidebarResizeHandler = (e: TransitionEvent) => {
    if (e.propertyName === 'width') {
      chartResizeHandler();
    }
  };

  const initResizeEvent = () => {
    window.addEventListener('resize', chartResizeHandler, {passive:true});
  };

  const destroyResizeEvent = () => {
    window.removeEventListener('resize', chartResizeHandler);
  };

  const initSidebarResizeEvent = () => {
    sidebarElm.value = document.getElementsByClassName('sidebar-container')[0];
    if (sidebarElm.value) {
      sidebarElm.value.addEventListener(
        'transitionend',
        sidebarResizeHandler as EventListener,
        {passive:true}
      );
    }
  };

  const destroySidebarResizeEvent = () => {
    if (sidebarElm.value) {
      sidebarElm.value.removeEventListener(
        'transitionend',
        sidebarResizeHandler as EventListener
      );
    }
  };

  const mounted = () => {
    initResizeEvent();
    initSidebarResizeEvent();
  };

  const beforeDestroy = () => {
    destroyResizeEvent();
    destroySidebarResizeEvent();
  };

  const activated = () => {
    initResizeEvent();
    initSidebarResizeEvent();
  };

  const deactivated = () => {
    destroyResizeEvent();
    destroySidebarResizeEvent();
  };

  return {
    chart,
    mounted,
    beforeDestroy,
    activated,
    deactivated
  };
}


 173
173


 被折叠的 条评论
为什么被折叠?
被折叠的 条评论
为什么被折叠?
 到【灌水乐园】发言


