


Abstract
We present RabbitTClust, a fast and memory-efficient genome clustering tool based on sketch-based distance estimation.
RabbitTClust: 工具名称。
Fast and Memory-efficient: RabbitTClust被设计为具有高速和低内存占用的特性。
Genome Clustering Tool: RabbitTClust是用于基因组聚类的工具。
Sketch-based Distance Estimation:基于草图的距离估计方法。
Our approach enables efficient processing of large-scale datasets by combining dimensionality reduction techniques with streaming and parallelization on modern multi-core platforms.
Efficient Processing of Large-scale Datasets: 实现对大规模数据集的高效处理。
Dimensionality Reduction Techniques: 降维通过减少数据维度来简化数据表示。
Streaming and Parallelization: 采用了流水线处理和并行化技术。
Modern Multi-core Platforms: 用于在现代多核平台上运行。
113,674 complete bacterial genome sequences from RefSeq, 455 GB in FASTA format, can be clustered within less than 6 min and 1,009,738 GenBank assembled bacterial genomes, 4.0 TB in FASTA format, within only 34 min on a 128-core workstation.
FASTA format: 采用FASTA格式存储。
RefSeq:由NCBI(美国国家生物技术信息中心)维护的参考序列数据库。
Our results further identify 1269 redundant genomes, with identical nucleotide content, in the RefSeq bacterial genomes database.
identical nucleotide content:核苷酸内容完全相同。
Background
Clustering nucleotide sequences is an important operation in bioinformatics with applications including duplicate detection [1] and species boundary identification [2]. With the progress of sequencing technologies, more and more genome sequences are generated at explosive speed. So far, over one million assembled bacteria genomes have been submitted to NCBI GenBank [3] comprising several terabytes in size. Even though widely used tools, such as CD-HIT [4] and UCLUST [5], rely on fast heuristics, they can become prohibitively slow or memory intensive when clustering long genomic sequences because of their alignment-based distance measures.
在生物信息学中,核苷酸序列聚类重要,应用于重复检测和物种边界识别。随着测序技术的进步,基因组序列的生成速度呈指数级增长。
尽管CD-HIT和UCLUST工具,依赖于快速的启发式算法,但对长基因组序列聚类时,由于它们基于序列对齐的距离测量,可能会速度缓慢或占用大量内存,难以处理。
Traditional alignment-based algorithms [6, 7] often fail to compute pairwise similarities in practical time, especially for complete assembled genomes. Recently, k-mer-based alignment-free algorithms [8] and sketching strategies [9] are becoming popular for estimating sequence similarities. Mash [10] introduced fast genome distance estimation using MinHash sketches which approximates the distance by selecting a small subset of hashed and sorted k-mers. This strategy provides an approach to efficiently compute distances between sequences with a length of 10 million or even longer.
传统的基于序列对齐的算法,尤其是完整组装的基因组,无法在实际时间内计算成对的相似性。最近,基于k-mer的无序列对齐算法和基于草图的策略变得popular。Mash引入了使用MinHash草图进行快速基因组距离估计的方法,选择一小部分经过哈希和排序的k-mer来近似距离。提供了一种有效计算长度达到1000万+的序列测距方法。
MinHash: MinHash是一种概率性算法,基于集合的Jaccard相似性。通过使用随机排列(permutation)来生成一系列哈希值,并选择最小的哈希值作为该集合的"MinHash值"。通过比较不同集合的MinHash值,可以估算它们之间的Jaccard相似性。
Mash: Mash是建立在MinHash基础上的工具,它使用MinHash sketches(一种压缩的MinHash表示)来近似基因组之间的距离。Mash通过选择一小部分k-mer并生成相应的MinHash值计算基因组之间的相似性。
Hierarchical clustering approaches often rely on a matrix of pairwise distances among input objects. However, memory requirements of the distance matrix can become prohibitive for large-scale input data. In order to reduce compute and memory consumption, clustering algorithms based on heuristics often choose the longest sequence as the representative sequence and only compute the distance between representative genomes and other genomes [11]. As a consequence, heuristic clustering algorithm may output sub-optimal results [12]. Furthermore, popular tools such as CD-HIT and UCLUST have been designed for clustering short read or protein sequences. They often fail when clustering long assembled genome sequences.
在生物信息学中,层次聚类方法通常使用 输入对象之间的成对距离矩阵。对于大规模输入数据,距离矩阵的内存需求不切实际。为减少计算和内存消耗,基于启发式的聚类算法通常会选择最长的序列作为代表性序列,并仅计算代表基因组与其他基因组之间的距离。这样做的结果是,启发式聚类算法可能输出次优的结果。一些流行的工具如CD-HIT和UCLUST在对长序列的组装基因组进行聚类时表现不佳。我们提出RabbitTClust,结合了降维技术、流处理和并行化,在现代多核平台上高效处理大规模数据集,提高聚类效率。
clustering algorithms based on heuristics:启发式方法是选择最长的序列作为代表性序列,并仅计算代表性基因组与其他基因组之间的距离,以减少计算和内存需求。
Nowadays, many tasks such as read mapping [13] or metagenome discovery [14] are reference-based. In some cases, several different versions of genome submissions to NCBI RefSeq with similar contents exist, which may lead to ambiguous results. Other applications such as RabbitUniq [15] and fastv [16] are based on unique k-mers of the reference genomes to identify microorganisms. These methods can miss partial unique k-mers when processing repeats or redundant genomes. Thus, when running reference-based applications, removing highly similar genomes can be beneficial to avoid errors caused by redundant references [15]. Identification of boundaries between microbial species is often based on computing the pairwise Average Nucleotide Identity (ANI) of large collections of microbial genomes (such as fastANI [2] and its re-evaluations [17, 18]).
当今许多生物信息学任务的性质,其中包括读映射(read mapping)和宏基因组发现(metagenome discovery),这些任务通常是基于已知的参考数据。在某些情况下,对NCBI RefSeq提交的基因组存在多个不同版本,但它们的内容相似,这可能导致结果的模糊性。此外,RabbitUniq和fastv,利用参考基因组的唯一 k-mer 来识别微生物。当处理重复或冗余的基因组时,这些方法可能错过部分唯一 k-mer。因此,在运行基于参考的应用程序时,删除高度相似的基因组可能有益,以避免由冗余参考引起的错误。微生物物种之间的边界通常是基于大量微生物基因组的成对平均核苷酸同源性(Average Nucleotide Identity,ANI)进行确定的,例如使用 fastANI 及其重新评估。
Recent tools for large-scale clustering of biological sequences include Linclust [19], Gclust [20], and MeShClust3 [21]. Linclust measures similarities by gapless local alignment, which suffers from high runtimes and has a significant memory footprint. Gclust is a parallelized clustering tool for microbial genomic data using sparse suffix arrays (SSAs) and maximal exact matches (MEMs) for similarity measurement. However, generation of SSAs and MEMs between large collections of long genomic genomes also suffers from both high computational and high space complexity. Even though MeShClust3 is able to cluster about 10,000 bacterial genomes in about 50 h, it is not able to deal with millions of genomes in practical time. This establishes the need for an approach that can cluster large amounts of long genomic sequences in practical time on modern hardware platforms with high computational efficiency and low memory requirements.
一些用于大规模生物序列聚类的工具
Linclust:使用无缝局部比对来测量相似性。存在高运行时间和显著的内存占用问题。
Gclust:是一种用于微生物基因组数据的并行化聚类工具。使用稀疏后缀数组(SSA)和最大精确匹配(MEM)进行相似性测量。生成大量长基因组之间的SSA和MEM也存在高计算和高空间复杂性。
MeShClust3:能够在大约50小时内聚类约10,000个细菌基因组。无法在实际时间内处理数百万个基因组。
We address this need by proposing RabbitTClust, an efficient clustering toolkit based on MinHash sketch distance measurement for large-scale genome datasets. Fast sketching (an approximate, compact summary of the original data) is used to compute similarities among genomes with a small memory footprint. It consists of two modules:
- clust-mst (minimum-spanning-tree-based single-linkage hierarchical clustering), and
- clust-greedy (greedy incremental clustering)
clust-mst relies on a graph-based linear space clustering algorithm based on minimum spanning tree (MST) computation [22] to perform single-linkage hierarchical clustering. Our MST construction relies on dynamically generating and merging partial clustering results without storing the whole distance matrix, which in turn allows for both memory reduction and efficient parallelization. clust-greedy chooses the longest genome in each cluster as representative and only computes distances of incoming genomes against the representative. Distances between incoming and representative genomes can be computed simultaneously in multi-threaded fashion.
RabbitTClust是一个基于MinHash sketch距离测量的高效聚类工具包,适用大规模基因组数据集。快速草图(原始数据的近似、紧凑的摘要)用于在小内存占用的情况下计算基因组之间的相似性。该工具包含两个模块:
1. clust-mst(基于最小生成树的单链接分层聚类):使用基于图的线性空间聚类算法,基于最小生成树(MST)计算,执行单链接分层聚类。MST的构建依赖于动态生成和合并部分聚类结果,而无需存储整个距离矩阵,从而实现了内存的减少和高效的并行化。
2. clust-greedy(贪婪增量聚类):选择每个簇中最长的基因组作为代表,并仅计算传入基因组与代表之间的距离。传入基因组与代表基因组之间的距离可以同时以多线程方式计算。
As a result, RabbitTClust advances the scalability of genome clustering methods and is able to carry out terabyte-scale experiments on a single computer workstation.
Results
Performance comparison
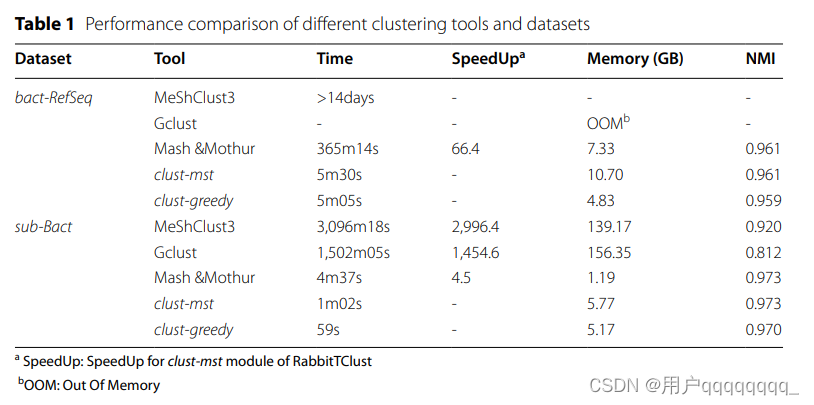
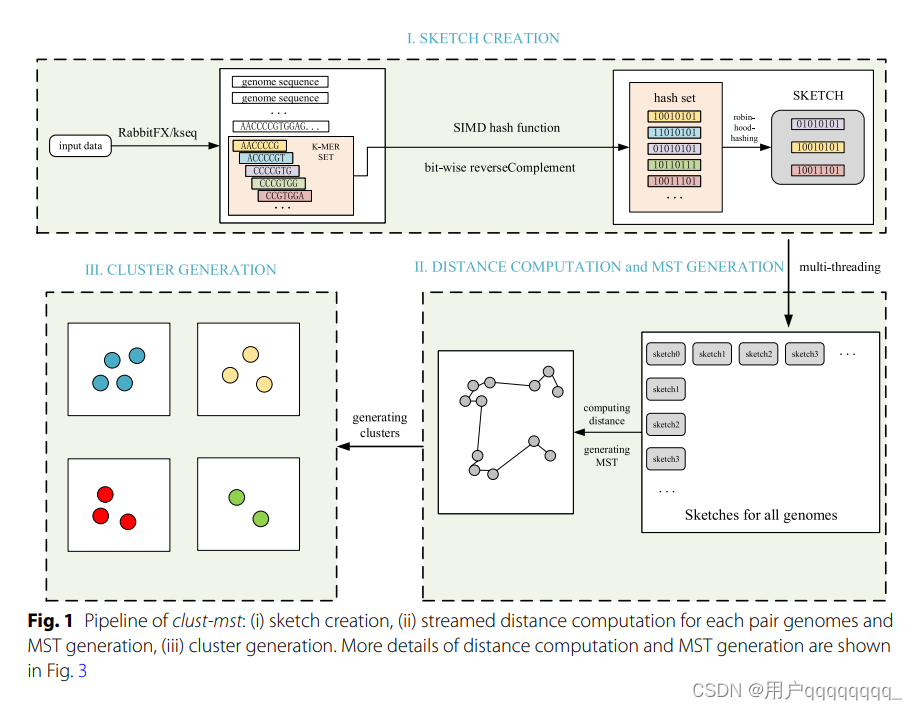
Performance comparison Te pipelines of clust-mst and clust-greedy are illustrated in Figs. 1 and 2, respectively. More details are explained in the “Methods” section. RabbitTClust can efciently fnish the clustering of the bacterial genomes from NCBI RefSeq Release 211 [23] (bact-RefSeq) and Genbank Release 249 [3] (bact-GenBank) on a workstation with two 64-core AMD EPYC 7T83 CPUs, 256 GB DDR4 memory, and 7.68 TB WD SN640 SSD. Te bact-RefSeq dataset (455 GB in FASTA format) consists of 113,674 complete genomes, while bact-Genbank contains 1,009,738 genomes with valid taxonomy-check-status [24]. Te total size of bact-Genbank is 4.0 TB in FASTA format. Using a distance threshold of 0.05 and 128 threads, clust-mst fnishes the clustering of bact-RefSeq within 6 min and with a memory footprint of 10.70 GB. Based on the ground truth from the NCBI RefSeq species taxonomy identifer (species-taxid), the created clustering of clust-mst has an NMI score of 0.961. Using a distance threshold of 0.05 and 128 threads, clust-greedy fnishes the clustering of bact-GenBank within 34 min, a memory footprint of 16.45 GB, and an NMI score of 0.956 (based on NCBI Genbank species-taxid).
RabbitTClust的性能比较以及在不同数据集上的聚类效果。
RabbitTClust在一台装有两个64核AMD EPYC 7T83 CPU、256 GB DDR4内存和7.68 TB WD SN640 SSD的工作站上,能够高效完成对来自NCBI RefSeq Release 211和Genbank Release 249的细菌基因组的聚类。
使用距离阈值为0.05和128个线程,clust-mst在6分钟内完成了对bact-RefSeq的聚类,内存占用为10.70 GB。与NCBI RefSeq物种分类标识(species-taxid)的真实数据进行比较,clust-mst创建的聚类具有0.961的NMI值。
bact-GenBank,使用距离阈值为0.05和128个线程,clust-greedy在34分钟内完成了聚类,内存占用为16.45 GB,NCBI Genbank species-taxid的NMI值为0.956。
NMI: 表示规范化互信息(Normalized Mutual Information),是一种用于评估聚类质量的指标。其值介于0和1之间,数值越高表示聚类效果越好,与真实分类的一致性越高。
Mothur [25] can finish hierarchical clustering with a PHYLIP-based distance matrix. In addition, Mash [10] can compute a PHYLIP-based distance matrix of genomes with the triangle option. Using 128 threads on the 128-core workstation, the Mash &Mothur pipeline (Mash v.2.3 and Mothur v.1.48.0) can finish hierarchical clustering of bact-RefSeq with a runtime of 6 h, a memory footprint of 7.33 GB and an NMI score of 0.961. Compared to the Mash &Mothur pipeline, clust-mst of RabbitTClust thus achieves a speedup of 66 with identical NMI score (see Table 1).
Mothur: Mothur是一个用于分析16S rRNA基因数据的生物信息学工具。用于执行基于PHYLIP(PHYLogeny Inference Package)距离矩阵的分层聚类。
Mash: Mash是一个使用三角选项计算基因组之间的PHYLIP距离矩阵。PHYLIP距离矩阵是一种用于表示生物学序列相似性的方法。
使用包含128个核心的工作站上的128个线程,Mash和Mothur的联合流水线能够在6小时内完成对bact-RefSeq的分层聚类。内存占用为7.33 GB,NMI值为0.961。
RabbitTClust的clust-mst模块以相同的NMI分数取得了66倍的加速。
CD-HIT, UCLUST, and Linclust can not deal with both bact-RefSeq and bact-GenBank and run out of memory. Furthermore, Gclust and MeShClust3, can not finish the clustering of the full RefSeq dataset (bact-RefSeq) in practical runtime. To compare efficiency and accuracy of RabbitTClust with these tools, we created a subset of bact-RefSeq called sub-Bact, which contains 10,562 genomes with a total size of 43 GB in FASTA format. We execute MeShClust3 (v.2.0) with the commands meshclust -d sub-Bacteria.fna -o sub-Bacteria.clust -t 0.84 -b 1000 -v 4000 (as recommended in [21]) and Gclust (v.1.0.0) using gclust -both -nuc -threads 128 -ext 1 -chunk 2000MB sub-Bacteria.sorted.fna > sub-Bacteria.clust with a larger chunk size for better thread scalability. Using 128 threads, MeShClust3 and Gclust can finish the clustering of sub-Bact with a runtime of 51.60 h and 25.01 h, a memory footprint of 139.17 GB and 156.35 GB, and an NMI score of 0.920 and 0.812, respectively. In comparison, clust-mst can finish the clustering of sub-Bact with a runtime of only 61.76 s, a memory footprint of 5.77 GB, and an NMI score of 0.973. Mash &Mothur requires 276.84 s, has a memory footprint of 1.19 GB, and also achieves NMI score of 0.973. Compared to MeshClust3, Gclust, and Mash &Mothur pipeline, clust-mst thus achieves speedups of at least 2996.4, 1454.6, and 4.5 for the sub-Bact dataset, respectively. Details are summarized in Table 1.
在处理大规模基因组数据时的性能对比
CD-HIT, UCLUST, Linclust: 无法处理数据,且会由于内存不足而无法运行。
Gclust,MeShClust3: 无法在实际运行时间内完成对完整RefSeq数据集的聚类。
为了比较RabbitTClust与这些工具的效率和准确性,创建了一个名为sub-Bact的bact-RefSeq子集,其中包含10,562个基因组,总大小为43 GB。使用MeShClust3和Gclust对sub-Bact进行聚类,以及使用clust-mst和Mash & Mothur pipeline进行对比。
相较于MeShClust3、Gclust和Mash & Mothur流水线,clust-mst在sub-Bact数据集上实现了至少2996.4倍、1454.6倍和4.5倍的加速。
Efficiency and scalability
The combination of efcient algorithms and highly optimized implementation makes the two modules of RabbitTClust fast, scalable, and memory efcient. We adopt a lowcomplexity MinHash sketching algorithm to estimate the pairwise distances for both clust-mst and clust-greedy. Consider a genomic sequence of length L and the sketch size S (number of sampled k-mers for distance estimation) with S ≪ L. Te computational complexity of sketch-based distance measurement of two genomic sequences of length L is O(S), while the traditional alignment-based approach requires O(L2).
Consider N to be the number of genomic input sequences. Te streaming MST generation algorithm for clust-mst exhibits linear space complexity of O(N) and avoids storing the full pairwise distance matrix with N2/2 entries. clust-greedy also has linear space complexity O(N) since it only needs to store the label (representative or redundant) of each genome instead of pairwise distances.
RabbitTClust两个模块(clust-mst和clust-greedy)的高效算法和高度优化实现的组合,使其具有快速、可扩展和内存高效的特性。
MinHash Sketching Algorithm: 采用了低复杂度的MinHash sketching算法来估算clust-mst和clust-greedy之间的成对距离。MinHash是一种近似算法,用于对两个基因组序列进行距离估算。对于长度为L的基因组序列和sketch大小S(用于距离估算的采样k-mers数量),计算两个基因组序列之间的sketch-based距离的计算复杂度为O(L/S),而传统的基于比对的方法则需要O(L)。
计算复杂度说明:
对于clust-mst:空间复杂度O(N),避免了存储完整的成对距离矩阵。
对于clust-greedy:空间复杂度O(N),只需存储每个基因组的标签(代表性或冗余),而不是成对距离。
RabbitTClust takes full advantage of modern compute platforms by featuring fast I/O parsing, multi-threading, and vectorization of inner loops. The sketch creation for each genome is a time-consuming part for both clust-mst and clust-greedy. It is thus parallelized using both multi-threading and vectorization. For multi-threading, thread scalability is bottlenecked by sequence parsing as the thread number grows. We use the efcient FASTA parsing libraries RabbitFX [26] and kseq [27] to eliminate parsing bottlenecks, thus, achieving better performance and thread scalability. Distance computation is another hotspot kernel. Our streaming strategy for MST generation can be parallelized with the distance computation as shown in Fig. 3. For clust-greedy, the distances of each incoming genome with all representative genomes are also computed in parallel. Since there is no dependency between multiple threads, distance computation can achieve good thread scalability.
RabbitTClust充分利用现代计算平台的特性,包括快速I/O解析、多线程处理和循环向量化。
1.现代计算平台的充分利用:
快速I/O解析:RabbitTClust采用了高效的FASTA解析库以消除解析瓶颈,提高性能和线程可伸缩性。
多线程:利用多线程来加速处理。2. sketch创建的并行化:
时间消耗较大的部分: 每个基因组的sketch创建是一个耗时的步骤。
多线程和矢量化:采用多线程和矢量化技术来并行化sketch创建过程,提高效率。3. 距离计算的优化:
热点内核:距离计算是关键的性能热点。
流式策略的并行化:clust-mst中的流式MST生成策略与距离计算一起并行化,以提高效率。
clust-greedy的并行计算:clust-greedy中,每个新基因组与所有代表基因组的距离也可以并行计算,因为多线程之间没有依赖关系,距离计算具有很好的线程可伸缩性。Hotspot kernel:在计算中特别耗费资源、需要大量计算的核心或部分。
Methods
RabbitTClust pipeline
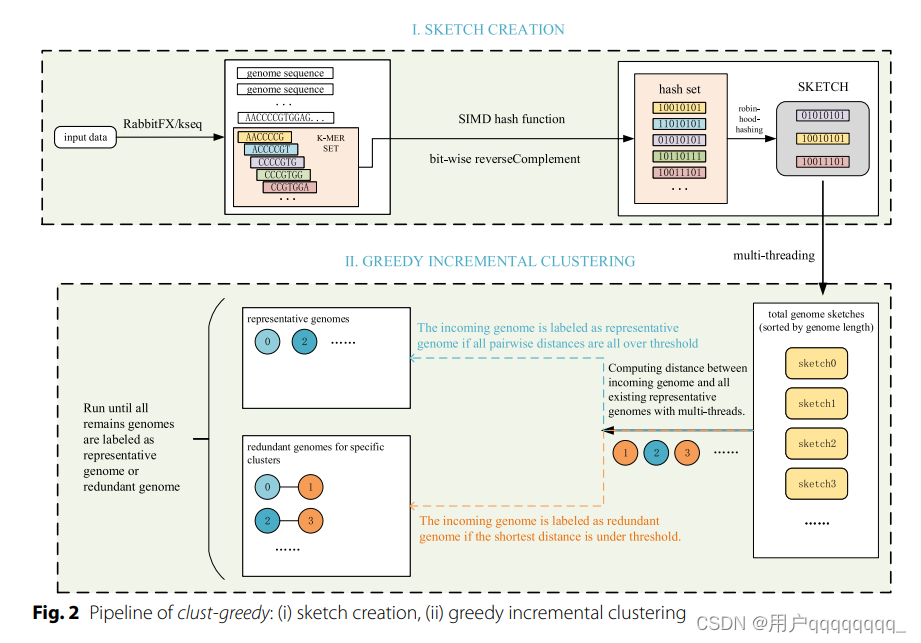
The clust-mst pipeline (see Fig. 1) consists of four parts: (i) sketch creation, (ii) pairwise genome distance computation, (iii) MST generation, and (iv) cluster generation. The clust-greedy pipeline (see Fig. 2) consists of three parts: (i) sketch creation, (ii) distance computation, and (iii) greedy incremental clustering. Both of them support two types of input: a single genome file or a list of genome files. RabbitFX and kseq are used for efficient sequence parsing of the single genome file or the file list, respectively.
clust-mst流程:(i) sketch创建,(ii)基因组两两距离计算,(iii) MST生成,和(iv) cluster生成。
clust-greedy流程:(i) sketch创建,(ii)距离计算,和(iii)贪婪增量聚类。
支持两种类型的输入:单个基因组文件或基因组文件列表。对于单个基因组文件或文件列表,分别使用RabbitFX和kseq进行高效的序列解析。
After parsing, k-mers (i.e., substrings of length k) are generated by decomposing the genome sequences and their reverse complements in a sliding-window way. Only canonical k-mers (the smallest hash value between a k-mer and its reverse complement) are used to create sketches. S minimum hash values are chosen to compose a sketch where S denotes the sketch size. Note that the hash function should be uniform and deterministic [9]. Uniformity ensures that hash values converted from the input k-mer set of a genome are mapped evenly across the hash value space, which provides a representative sampling of MinHash sketches. Determinism ensures that the same input k-mer always produces the same hash value. Considering efficiency and the features mentioned above, we use the MurmurHash3 function in RabbitTClust. MurmurHash3 [36] is a popular non-cryptographic hash function that converts k-mers to integers. To improve efficiency, we include a vectorized implementation of MurmurHash3 with SIMD instructions which manipulates multiple k-mers concurrently [37].、
解析后,通过在滑动窗口中分解基因组序列及其反向互补链(在DNA序列中,每个碱基都有一个对应的碱基,它们是互补的。DNA的两个链以相反的方向排列,这两个链称为互补链。),生成了 k-mers(即长度为 k 的子串)。
仅使用规范的 k-mers(在 k-mer 和 其反向互补链的最小哈希值)来创建sketch。选择 S 个最小哈希值组成一个sketch,其中 S 表示sketch的大小。
均匀性确保基因组的输入 k-mer 集转换的哈希值在哈希值空间中均匀分布,从而提供 MinHash sketches 的代表性抽样。
确定性确保相同的输入 k-mer 总是产生相同的哈希值。
MurmurHash3:流行的非加密哈希函数,将 k-mer 转换为整数。为了提高效率,我们包括了一个使用 SIMD 指令的 MurmurHash3 的矢量化实现,可以同时处理多个 k-mer 。
Distance computation in clust-mst is used to estimate pairwise genome similarities for each pair of sketches. MST generation is done by using a streaming strategy together with distance computation in parallel, as illustrated in Fig. 3. After the MST is constructed, the final clusters are generated by cutting off edges over the threshold in the MST.
在 clust-mst 中,距离计算用于估算每对 sketches 之间的基因组相似性。MST 的生成通过使用流水线策略与并行距离计算一起完成,如图 3 所示。
在 MST 构建完成后,通过在 MST 中切除超过阈值的边来生成最终的聚类。
For clust-greedy, the sketches are sorted by genome length in descending order. The sketch corresponding to the longest genome is added to the representative set. Each sketch in this set represents a cluster. For each remaining sketch, we compute the distances between the current incoming sketch and all representative sketches. If the distance between this incoming sketch and representative sketches A is the minimum distance and is less than the threshold, the incoming genome is added to the cluster A. If all distances to representative sketches are over the threshold, the incoming sketch is used as the representative of a new representative sketch set. Clustering is finished after all the remaining sketches are processed.
对于 clust-greedy,sketches 按照基因组长度降序排序。与最长基因组对应的 sketch 被添加到代表集中。这个集合中的每个 sketch 代表一个聚类。对于每个剩余的 sketch,我们计算当前进入 sketch 与所有代表 sketch 之间的距离。
如果这个进入 sketch 与代表 sketch A 之间的距离是最小距离且小于阈值,那么进入的基因组将被添加到聚类 A 中。
如果与代表 sketch 的所有距离都超过阈值,则进入的 sketch 被用作新的代表 sketch 集的代表。
在处理所有剩余的 sketches 后,聚类完成。
Sketching and distance measurement
We rely on sketching of k-mers for similarity estimation among input genome sequences based on their Mash distance [10] or AAF distance [33] using resemblance Jaccard or containment coefcients. This reduces the size of the input data set by several orders-ofmagnitude (the sketch size for Jaccard coefcient and the mean value of variable sketch sizes for containment coefcient are 1000 k-mers per genome by default). Consider two genomic sequences G1 and G2. The Jaccard Index J for their resemblance can be approximated by J(G1, G2) ≈ J(S(G1), S(G2)) = |S(G1) ∩ S(G2)|/|S(G1) ∪ S(G2)| where S(G1) and S(G2) are hash value sets of the two subsampled k-mer sketches of G1 and G2. Mash [10] proposed Mash distance based on a Poisson distribution of the point mutation rate defned as D = −1 k ln 2J 1+J , where k is the k-mer size and J is Jaccard index. Mash distance correlates well with the ANI as D ≈ 1 − ANI.
在 RabbitTClust 中,我们依赖于对 k-mers 进行草图处理,以便基于它们的 Mash 距离或 AAF 距离进行输入基因组序列的相似性估算,使用 Jaccard 相似性或包含系数(AAF)。这可以将输入数据集的大小减小数个数量级(默认情况下,草图大小的平均值为每个基因组 1000 个 k-mers)。
several orders of magnitude:表示数量级(magnitude)之间相差很大的表达。在科学和数学中,一个数量级的增加通常表示数值乘以某个固定的常数,例如10。如果某个值从 1 增加到 1000,那么这就是增加了三个数量级,因为 1000 是 1 的 10 的三次方。同样,从 1000 减少到 1 也是减少了三个数量级。
考虑两个基因组序列 G1 和 G2。它们之间的 Jaccard 指数 J 可以通过 J(G1, G2) ≈ J(S(G1), S(G2)) = |S(G1) ∩ S(G2)|/|S(G1) ∪ S(G2)| 进行估算,其中 S(G1) 和 S(G2) 分别是 G1 和 G2 的两个子采样 k-mer 草图的哈希值集合。Mash提出了基于点突变速率泊松分布的 Mash 距离,定义为 D = −1/k ln(2J/(1+J)),其中 k 是 k-mer 大小,J 是 Jaccard 指数。Mash 距离与 ANI 呈很好的相关性,因为 D ≈ 1 − ANI。
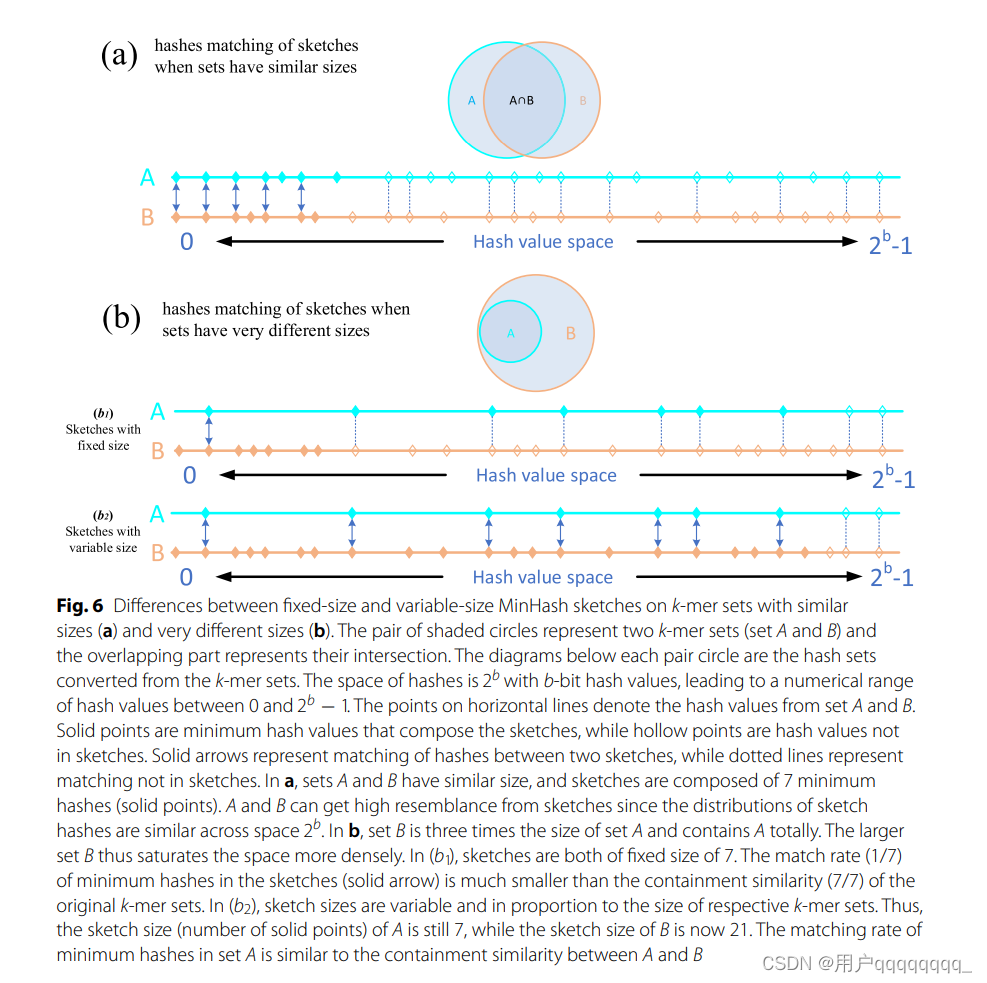
Fixed-size sketches are suitable for computing the resemblance Jaccard coefcient when the lengths of genomes are roughly equal but not in the case of signifcantly different sizes. When de-duplicating, we also offer a containment analysis option to find duplicate sequences of different sizes. Compared to resemblance, the variable-sizesketch-based containment method is more suitable for genomes with signifcantly different sizes. The hash value distributions of fixed-size sketches are diferent when the genomes are of very different sizes, so the matching rate of hashes in the two sketch sets is much smaller than the containment similarity of original genomes, see Fig. 6b. Containment coefcient of G1 in G2 is approximated by c ≈ |S(G1) ∩ S(G2)|/|S(G1)|, whereby sketch sizes are proportional to the size of the respective genomes [38]. AAF distance is defned as d = −1 k ln c where c is the containment coefcient [32]. As is shown in Fig. 6b, the matching rate of minimum hashes in the sketch of the smaller genome is similar to the containment similarity between the two genomes.
Fixed-size sketches (固定大小草图):适用于计算 Jaccard 相似系数,特别是在基因组长度大致相等的情况下。如果基因组长度相差很大,使用固定大小的 sketch 可能不太合适,因为 hash 值的分布会有很大差异。
Variable-size sketch-based containment method (基于可变大小草图的包含方法):适用于具有显著不同大小的基因组。在去重过程中,还提供了包含分析选项,以查找不同大小的重复序列。相较于 Jaccard 相似性,基于可变大小的 sketch 的包含方法更适用于基因组长度相差很大的情况。Containment 系数衡量了 G1 在 G2 中的包含程度。
Containment 系数被近似定义为 c ≈ |S(G1) ∩ S(G2)|/|S(G1)|,其中 sketch 的大小与相应基因组的大小成比例。AAF(Average Amino Acid Frequencies)距离用于衡量包含系数,其定义为 d = −1/k ln c。
当基因组大小相差较大时,使用固定大小的 sketch 会导致 hash 值的分布差异较大,而与原始基因组的包含相似性相比,两个 sketch 集合中哈希的匹配率要小得多。
Minimum spanning tree for single-linkage hierarchical clustering
Hierarchical clustering requires computation of all pairwise distances. Te dimension of the distance matrix is O(N2), where N is the number of genomes. It is unpractical to store the whole matrix in memory for large input datasets. However, the memory footprint of the MST is only linear with respect to the number of genomes which is signifcantly smaller than the whole distance matrix. Thus, we have designed a parallelized streaming approach for MST generation. Subsequently, the MST is chosen to generate clusters by cutting of the edges whose lengths are over a predefned threshold.
层次聚类需要全部两两距离的计算。距离矩阵的维度是 O(N^2),其中 N 是基因组的数量。对于大型输入数据集,将整个矩阵存储在内存中是不切实际的。然而,最小生成树(MST)的内存占用与基因组数量呈线性关系,远远小于整个距离矩阵。
设计了一个并行化的流式方法来生成 MST。随后,选择 MST 生成聚类,通过切断长度超过预定义阈值的边来实现。
Our streaming method is inspired by the edge-partition-based distributed MST algorithm [39]. The all-to-all distance matrix can be considered as a complete graph. In this complete graph, vertices express genomes, and the weights of edges express their pairwise distances. When the graph is partitioned into several sub-graphs, any edge that does not belong to the MST of a sub-graph containing the edge does not belong to the MST of the original graph [40]. Tis property guarantees that the MST can be constructed by merging sub-MSTs in streaming fashion, which avoids storing the whole distance matrix in memory. In our implementation, the sub-MSTs are concurrently constructed using multiple threads. As shown in Fig. 3, t rows of the distance matrix compose a sub-graph. P sub-MSTs are generated from P sub-graphs concurrently, where P is the thread number. P sub-MSTs are updated as new pairwise distances are calculated. Te fnal MST is merged from the P sub-MSTs after fnishing the whole distance computing.
流式处理方法受到了基于边分区的分布式最小生成树算法的启发。全对全距离矩阵可以被看作是一个完全图。在这个完全图中,顶点表示基因组,边的权重表示它们之间的两两距离。当图被划分为几个子图时,不属于包含该边的子图的 MST 的任何边都不属于原始图的 MST 。这个特性确保了 MST 可以通过合并子 MST 来以流式方式构建,而无需在内存中存储整个距离矩阵。在这个实现中,使用多个线程同时构建了子 MST。
如图 3 所示,距离矩阵的 t 行形成一个子图。P 个子 MST 同时从 P 个子图中生成,其中 P 是线程数。随着新的两两距离的计算,P 个子 MST 被更新。在完成整个距离计算后,从 P 个子 MST 中合并得到最终的 MST。
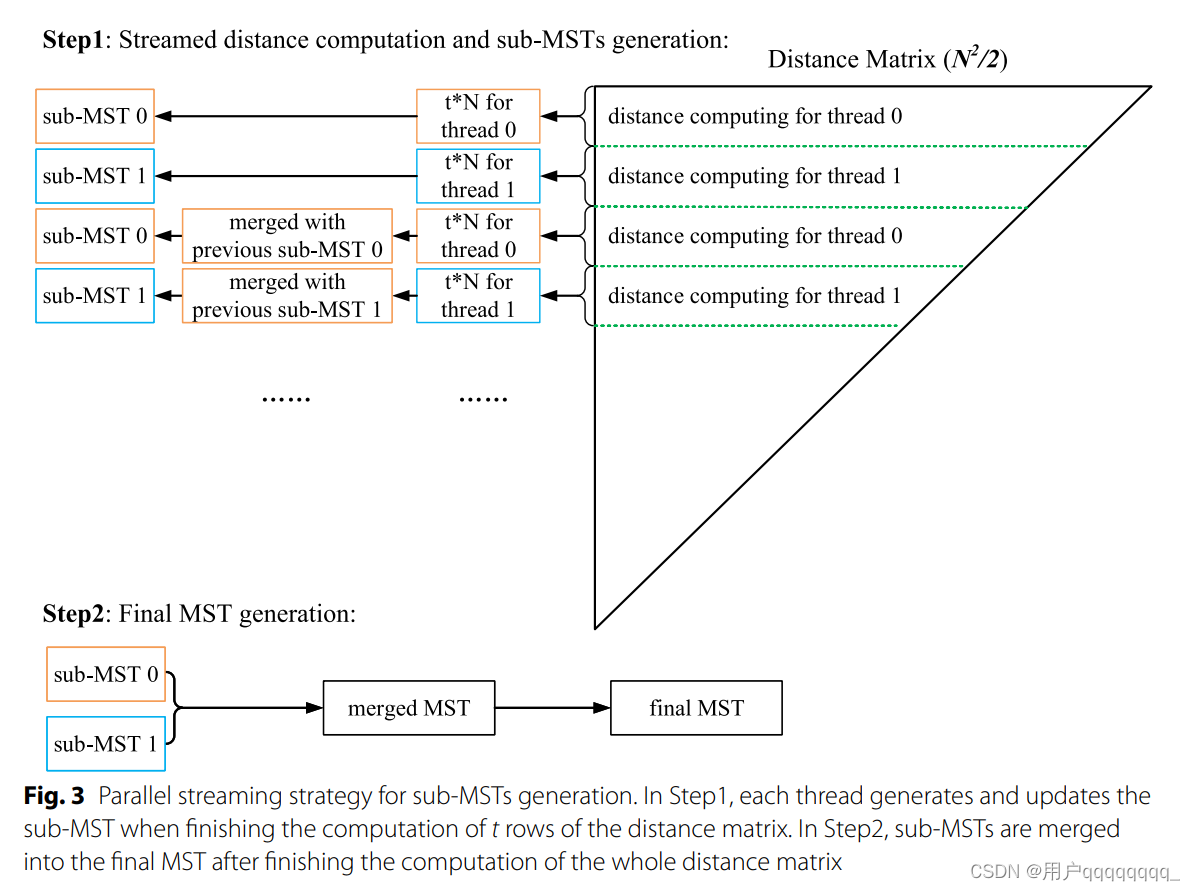
For runtime consideration, the distance computation and sub-MST generation and updating are implemented in parallel by multiple threads. Only P sub-MSTs and P subgraphs are stored in memory for MST generation. For N input genomes, the magnitude of sub-graphs and sub-MSTs is t · N and N, respectively. For P threads, the total memory footprint is of a magnitude of O(P · (t + 1) · N). Te parameter t is used to control the dimension of the sub-graphs which is set to 8 by default. Since P and t are much smaller than N, the total memory footprint is typically linear in the number of genomes
为了提高效率,距离计算、子图生成和更新都是通过多个线程并行实现的。在内存中仅存储了P个子最小生成树和P个子图,用于最终生成整个最小生成树。对于N个输入基因组,子图和子最小生成树的数量分别是t · N和N。对于P个线程,总的内存占用的数量级为O(P · (t + 1) · N)。其中,参数t用于控制子图的维度,默认设置为8。由于P和t通常远小于N,因此总的内存占用通常是基于基因组数量的线性的。
The time consumption of generating clusters from the MST is comparatively small. Since the MST for a dataset will not change as long as the sketch parameters do not change, we store the MST information into an output file. Clusters with different thresholds can be generated from the stored MST fle without re-generating the MST again. Users can run with -f option to use the stored MST file as an input.
生成基于最小生成树(MST)的聚类的时间开销相对较小。只要sketch参数不改变,数据集的最小生成树(MST)就不会改变,因此将MST信息存储到输出文件中。使用不同阈值可以从存储的MST文件中生成不同的聚类,而无需重新生成MST。
用户可以使用 -f选项来指定已存储的MST文件作为输入。
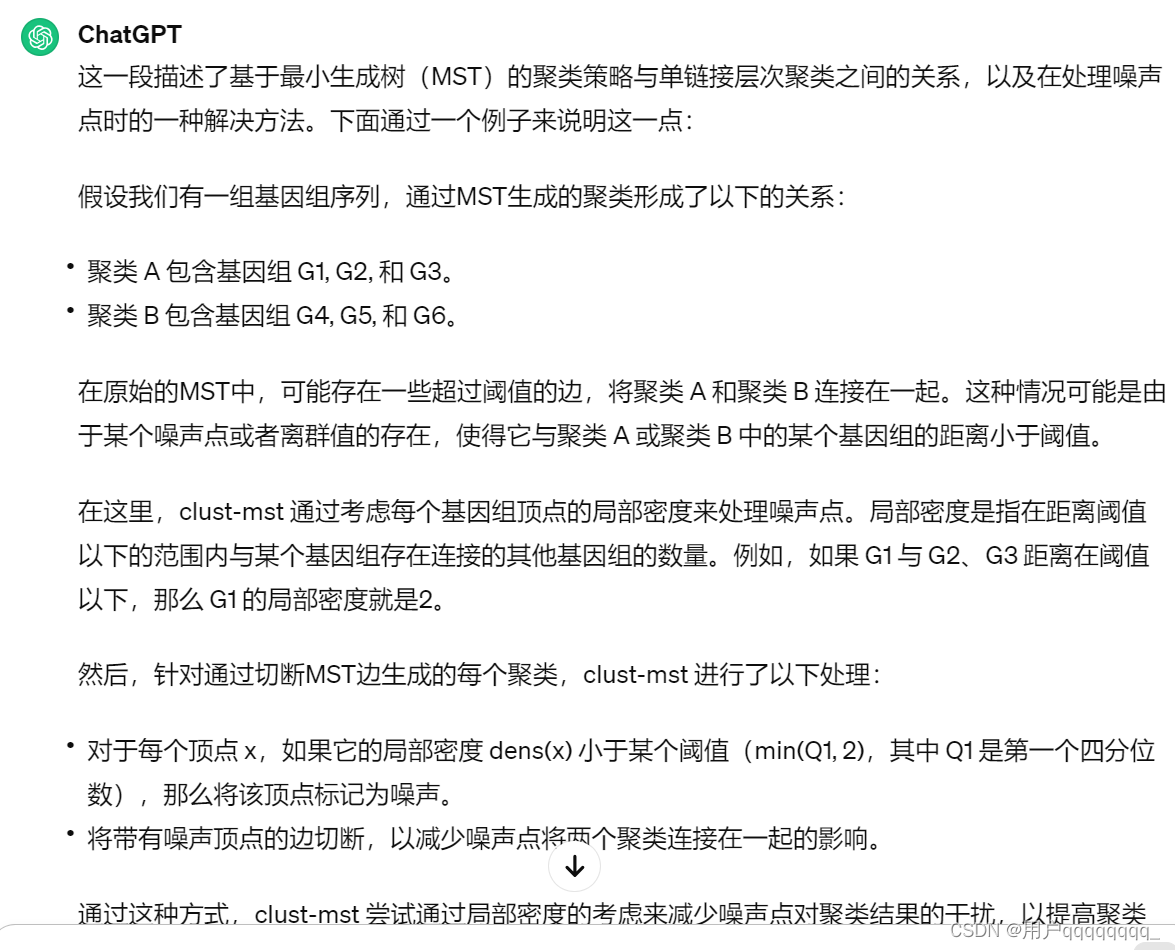
Note that the MST-based clustering strategy is equal to the single-linkage hierarchical clustering, which may chain two separated clusters together by the noise point. clust-mst takes into account the local density of each genome vertex [41]. For each vertex, the local density is defned as the number of vertices with a distance under the threshold. For each cluster generated by cutting of the over threshold edges of the MST, in default the vertex, x, is labeled as noise when its local density dens(x) < min(Q1, 2), where the Q1 is the frst quartile. clust-mst will then cut the edges with the noise vertices to reduce the impact of chaining two clusters together by noise vertices.
MST(最小生成树)基于的聚类策略等同于单链接层次聚类。单链接层次聚类可能会通过噪点将两个分离的聚类链接在一起。
clust-mst 考虑了每个基因组顶点的局部密度。对于每个顶点,局部密度被定义为距离低于阈值的顶点数。对于通过切断MST的超过阈值的边而生成的每个聚类,默认情况下,当其局部密度 dens(x) < min(Q1, 2) 时,顶点 x 被标记为噪声,其中 Q1 是第一四分位数。
然后,clust-mst 将切断与噪声顶点相关的边,以减小通过噪声顶点将两个聚类链接在一起的影响。

Benchmarking clustering accuracy
We use purity and NMI (Normalized Mutual Information) score [42] to assess the quality of clustering results. Te ground truth of bacteria genomes from NCBI Refseq and Genbank databases are the species taxonomy identifer (species-taxid) from the assembly summary report fles.
作者采用了纯度和NMI分数这两个指标来评估基因组聚类结果的质量。
在这个评估中,已知的物种分类信息来自于NCBI RefSeq和GenBank数据库,具体是从组装摘要报告文件中提取的物种分类标识符。
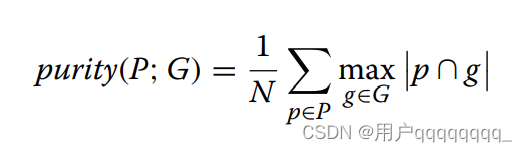
Purity is used to measure the degrees of mixing for each cluster. A purity score of 1.0 means the elements in a predicted cluster are all from the same real class. For the predicted clusters P, the ground truth class G, and the total genome number N, the purity can be computed by Eq. 1. However, purity does not penalize scattered cluster result leading to a purity score of 1.0 if each element serves as a single cluster.
Purity用于衡量每个聚类中混合程度。纯度分数为1.0表示预测的聚类中的元素来自同一个类别。
the ground truth class:数据集中的实际类别或分类标签。
对于预测的聚类P、地面真实类别G和总基因组数N。
纯度不能很好地处理聚类结果中的分散性。
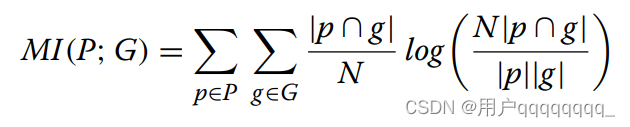
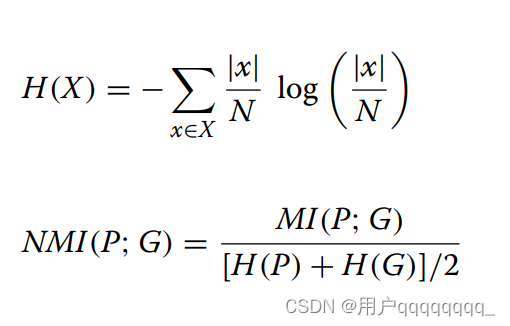
NMI is a normalization of the Mutual Information (MI) score to scale the results between 0 (no mutual information) and 1.0 (perfect correlation). Equation (2) describes the MI of predicted clusters P and ground truth class G to reveal the mutual dependency between P and G, where N denotes the total number of genomes. MI is normalized by the average entropy of P and G to scale the results between 0 and 1. Entropy and NMI are computed as shown in Eqs. (3) and (4). NMI score computation is implemented with scikit-learn [43]. Te scripts are publicly available in our repository’s evaluation directory [44].
NMI(标准化互信息)是对互信息(MI)得分的归一化,以在0(没有互信息)到1.0(完美相关性)之间进行缩放。
公式(2)描述了预测的聚类P和地面真相类别G的互关联程度,以揭示P和G之间的相互依赖关系,其中N表示基因组的总数。
MI通过P和G的平均熵进行归一化,以将结果缩放在0到1之间。
熵和NMI的计算如公式(3)和(4)所示。
NMI分数的计算使用scikit-learn 实现。
scikit-learn :提供现成函数和工具,方便用户在 Python 中进行机器学习和数据分析任务。
相应的脚本可在我们的存储库的评估目录公开获取。


 302
302

 被折叠的 条评论
为什么被折叠?
被折叠的 条评论
为什么被折叠?
 到【灌水乐园】发言


