


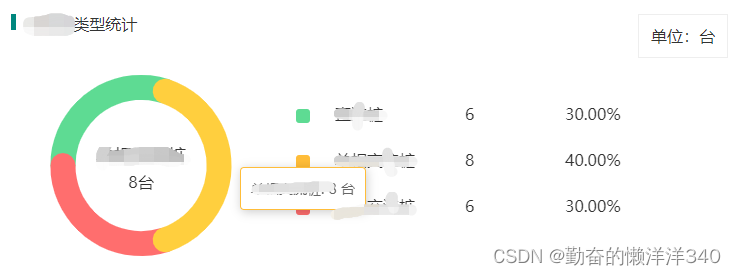
1.效果展示
2.代码
<template>
  <div class="pic-ECharts">
    <el-row :gutter="24">
      <el-col
        :xs="24"
        :sm="24"
        :md="24"
        :lg="24"
        :xl="12"
        v-for="item in listData"
        :key="item.id"
        class="ECharts-el-col"
      >
        <div :class="item.colECharts">
          <div :class="item.typECharts">
            <img :src="item.img" alt="" />
            <span>{{ item.type }}</span>
            <div class="unit">单位:{{ item.unit }}</div>
          </div>
          <div :class="item.EChart" :id="item.id"></div>
        </div>
      </el-col>
    </el-row>
  </div>
</template>
<script>
import { unitFormatter } from "@/utils";
import { totalChart } from "@/api/dashboard";

export default {
  name: "pieChart",
  data() {
    return {
      listData: [
        {
          img: require("@/assets/images/dashboard/btq.png"),
          colECharts: "col-ECharts",
          typECharts: "typECharts",
          type: "abcd累计统计",
          EChart: "EChart",
          unit: "kWh",
          id: "chargingStatisticsPieChart"
        },
        {
          img: require("@/assets/images/dashboard/btq.png"),
          colECharts: "col-ECharts",
          typECharts: "typECharts",
          type: "hyj类型统计",
          EChart: "EChart",
          unit: "台",
          id: "chargingTypeCircularDiagram"
        }
      ],
      chargingSituationData: [
        { value: "", name: "a", percentage: "", data_type: "6" },
        { value: "", name: "b", percentage: "", data_type: "7" },
        { value: "", name: "c", percentage: "", data_type: "8" },
        { value: "", name: "d", percentage: "", data_type: "9" }
      ],

      pieVal: {
        //环形图模拟数据
        typeData: [
          { value: "", name: "h", percentage: "", data_type: "10" },
          {
            value: "",
            name: "y",
            percentage: "",
            data_type: "11"
          },
          {
            value: "",
            name: "j",
            percentage: "",
            data_type: "12"
          }
        ],
        colorList: [
          //环形图颜色
          "#5EDB93",
          "#FFBD39",
          "#ff6e6e"
        ],
        seriesName: "",
        afterSeries: [], //绘制环形饼图的数据
        nameList: [],
        totalNum: 0
      }
    };
  },

  async mounted() {
    this.getData();
  },

  methods: {
    async getData() {
      const res = await totalChart();
      if (res.success) {
        let data = res.data;
        this.arrayComparison(this.chargingSituationData, data);
        this.arrayComparison(this.pieVal.typeData, data);
        this.getPie();
        this.getCircularDiagram();
      }
    },
    arrayComparison(oldArr, newArr) {
      oldArr.forEach(ele => {
        newArr.forEach(item => {
          if (ele.data_type == item.data_type) {
            ele.value = item.data;
            ele.percentage = item.percentage;
          }
        });
      });
    },
    // abcd累计统计
    async getPie() {
      let that = this;
      let chartDom = document.getElementById("chargingStatisticsPieChart");
      let myChart = this.echarts.init(chartDom);
      let option;
      option = {
        title: {
          text: "",
          subtext: "",
          left: "left"
        },
        tooltip: {
          trigger: "item",
          formatter: "{b}: {c} kWh"
        },
        color: ["#5EDB93", "#FFBD39 ", "#FF6E6E", "#76ADFF"],
        legend: {
          // 布局方式,默认为水平布局,可选为:'horizontal' ¦ 'vertical'
          orient: "vertical",
          // 水平安放位置,默认为全图居中,可选为:'center' ¦ 'left' ¦ 'right'
          x: "250px",
          top: "10%",
          //  设置图例之间的间距
          itemGap: 30,
          itemWidth: 14, // 设置宽度
          itemHeight: 14, // 设置宽度
          // 图例组件的宽度。 当需要换行的时候,设置宽度
          orient: "vertical",
          padding: 60,
          //图例文字的样式
          textStyle: {
            //图例文字的样式
            color: "#0b2b5e",
            fontSize: 24,
            fontWeight: "600",
            padding: [0, 0, 0, 5],
            rich: {
              name: {
                fontSize: 16,
                color: "#333",
                fontWeight: 280,
                width: 60
              },
              num: {
                fontSize: 16,
                fontWeight: 400,
                width: 80,
                color: "#333"
              }
            }
          },
          //可使用模板字符串,可使用回调函数,name是每个图例的名称
          formatter: this.setHtml(this.chargingSituationData)
        },
        series: [
          {
            name: "",
            type: "pie",
            center: ["160px", "45%"], // 默认全局居
            radius: "70%",
            //饼图上的指示线
            label: {
              position: "inner",
              show: false
            },
            emphasis: {
              itemStyle: {
                shadowBlur: 10,
                shadowOffsetX: 0,
                shadowColor: "rgba(0, 0, 0, 0.5)"
              }
            },
            data: this.chargingSituationData
          }
        ]
      };

      option && myChart.setOption(option);
    },
    // hyj类型统计
    getCircularDiagram() {
      this.pieVal.typeData.forEach((item, index) => {
        let seriesVal = {
          type: "bar",
          data: [0, 0, 2],
          coordinateSystem: "polar",
          barMaxWidth: 25, //圆环的宽度
          roundCap: true,
          name: "",
          color: "",
          stack: "a"
        };
        seriesVal.data[2] = Number(item.value);
        seriesVal.name = item.name;
        seriesVal.color = this.pieVal.colorList[index];
        this.pieVal.totalNum += Number(item.value);
        this.pieVal.nameList.push(item.name); //获取名称数组
        this.pieVal.afterSeries.push(seriesVal); //获取绘制环形饼图数组
      });
      this.phontoImage();
    },
    // 环形图
    phontoImage() {
      let that = this;
      let chartDom = document.getElementById("chargingTypeCircularDiagram");
      let myChart = this.echarts.init(chartDom);
      let BtVal = this.pieVal; //获取点击切换饼图传递的参数
      let option;
      // 鼠标移入事件
      myChart.on("mouseover", function(params) {
        myChart.setOption({
          title: {
            text: params.seriesName,
            subtext:that.getStatisticalChart(params.value)+'台'
          }
        });
      });
      // 鼠标移出事件
      myChart.on("mouseout", function(params) {
        myChart.setOption({
          title: {
            text: '',
            subtext:''
          }
        });
      });
      option = {
        title: {
          show: true,
          text: "",
          subtext:"",
          textStyle: {
            fontSize: 18,
            color: "#333",
            fontWeight: 400
          },
          subtextStyle: {
            fontSize: 16,
            color: "#333",
            fontWeight: 400
          },
          textAlign: "center", //图例文字居中显示
          x: "155px", //距离左边的距离
          y: "36%" //距离上边的距离
        },
        tooltip: {
          trigger: "item",
          formatter: "{a}: {c} 台",
          subtext: "",
          borderColor: ""
        },
        angleAxis: {
          axisLine: {
            show: false
          },
          axisLabel: {
            show: false
          },
          splitLine: {
            show: false
          },
          axisTick: {
            show: false
          },
          min: 0,
          max: BtVal.totalNum, //一圈的刻度值
          startAngle: 180 //初始角度
        },
        radiusAxis: {
          type: "category",
          axisLine: {
            show: false
          },
          axisTick: {
            show: false
          },
          axisLabel: {
            show: false
          },
          data: ["1", "2", "3", "4"], //代表层级
          z: 10
        },
        polar: {
          center: ["160px", "45%"], //圆环-图形位置
          radius: "100%" //图形大小 值可设置超过100%
        },
        series: BtVal.afterSeries,
        legend: {
          left: "310px",
          top: "20%",
          //  设置图例之间的间距
          itemGap: 30,
          itemWidth: 14, // 设置宽度
          itemHeight: 14, // 设置宽度
          // 图例组件的宽度。 当需要换行的时候,设置宽度
          orient: "vertical",
          //图例文字的样式
          textStyle: {
            //图例文字的样式
            color: "#0b2b5e",
            fontSize: 24,
            padding: [0, 0, 0, 20],
            rich: {
              name: {
                fontSize: 16,
                color: "#333",
                fontWeight: 400,
                width: 130
              },
              num: {
                fontSize: 16,
                fontWeight: 400,
                width: 100,
                color: "#333"
              }
            }
          },
          formatter: this.setHtml(that.pieVal.typeData)
        }
      };
      option && myChart.setOption(option);
    },
    getStatisticalChart(val) {
      if (!val) return "-";
      if (+val >= 10000) {
        return (val = ((val - (val % 100)) / 10000).toFixed(2) + "万");
      } else if (+val >= 10000000) {
        return (val = ((val - (val % 100)) / 10000000).toFixed(2) + "千万");
      }
      return val;
    },
    // 改变饼图右侧展示内容;
    setHtml(arr) {
      let that = this;
      const fn = function(name) {
        let item = arr.find(e => e.name == name);
        let html = [
          `{name|${item.name}}` +
            `{num|${that.getStatisticalChart(item.value)}}` +
            `{num|${unitFormatter(
              that.getStatisticalChart(item.percentage),
              "%"
            )}}`
        ].join("\n");
        return html;
      };
      return fn;
    },
  }
};
</script>

<style lang="scss" scoped>
.pic-ECharts {
  height: 318px;
  .ECharts-el-col {
    .col-ECharts {
      background-color: #fff;
      margin: 0 0 20px 0;
      .typECharts {
        margin-bottom: 20px;
        padding: 30px 30px 0 30px;
        > img {
          margin-right: 5px;
        }
        > span {
          font-size: 16px;
          font-family: Source Han Sans CN;
          font-weight: 400;
          color: #333333;
        }
      }
      .unit {
        float: right;
        margin-right: 30px;
        font-size: 16px;
        font-family: Source Han Sans CN;
        font-weight: 400;
        color: #333333;
        padding: 12px;
        border: 1px solid #eee;
      }
      .EChart {
        height: 250px;
        width: 100%;
      }
    }
  }
}
</style>
3.utils
/**
 * 格式化单位展示
 * author Zhengwl
 * @param value
 * @param unit
 * @returns {string}
 */
// 格式化单位展示
export function unitFormatter(value = '', unit = '') {
  value = value || '-' //这里应该去掉,然后下面一句话直接判空即可。
  return value + (['', '-'].includes(value) ? '' : unit)
}


 5258
5258


 被折叠的 条评论
为什么被折叠?
被折叠的 条评论
为什么被折叠?
 到【灌水乐园】发言


