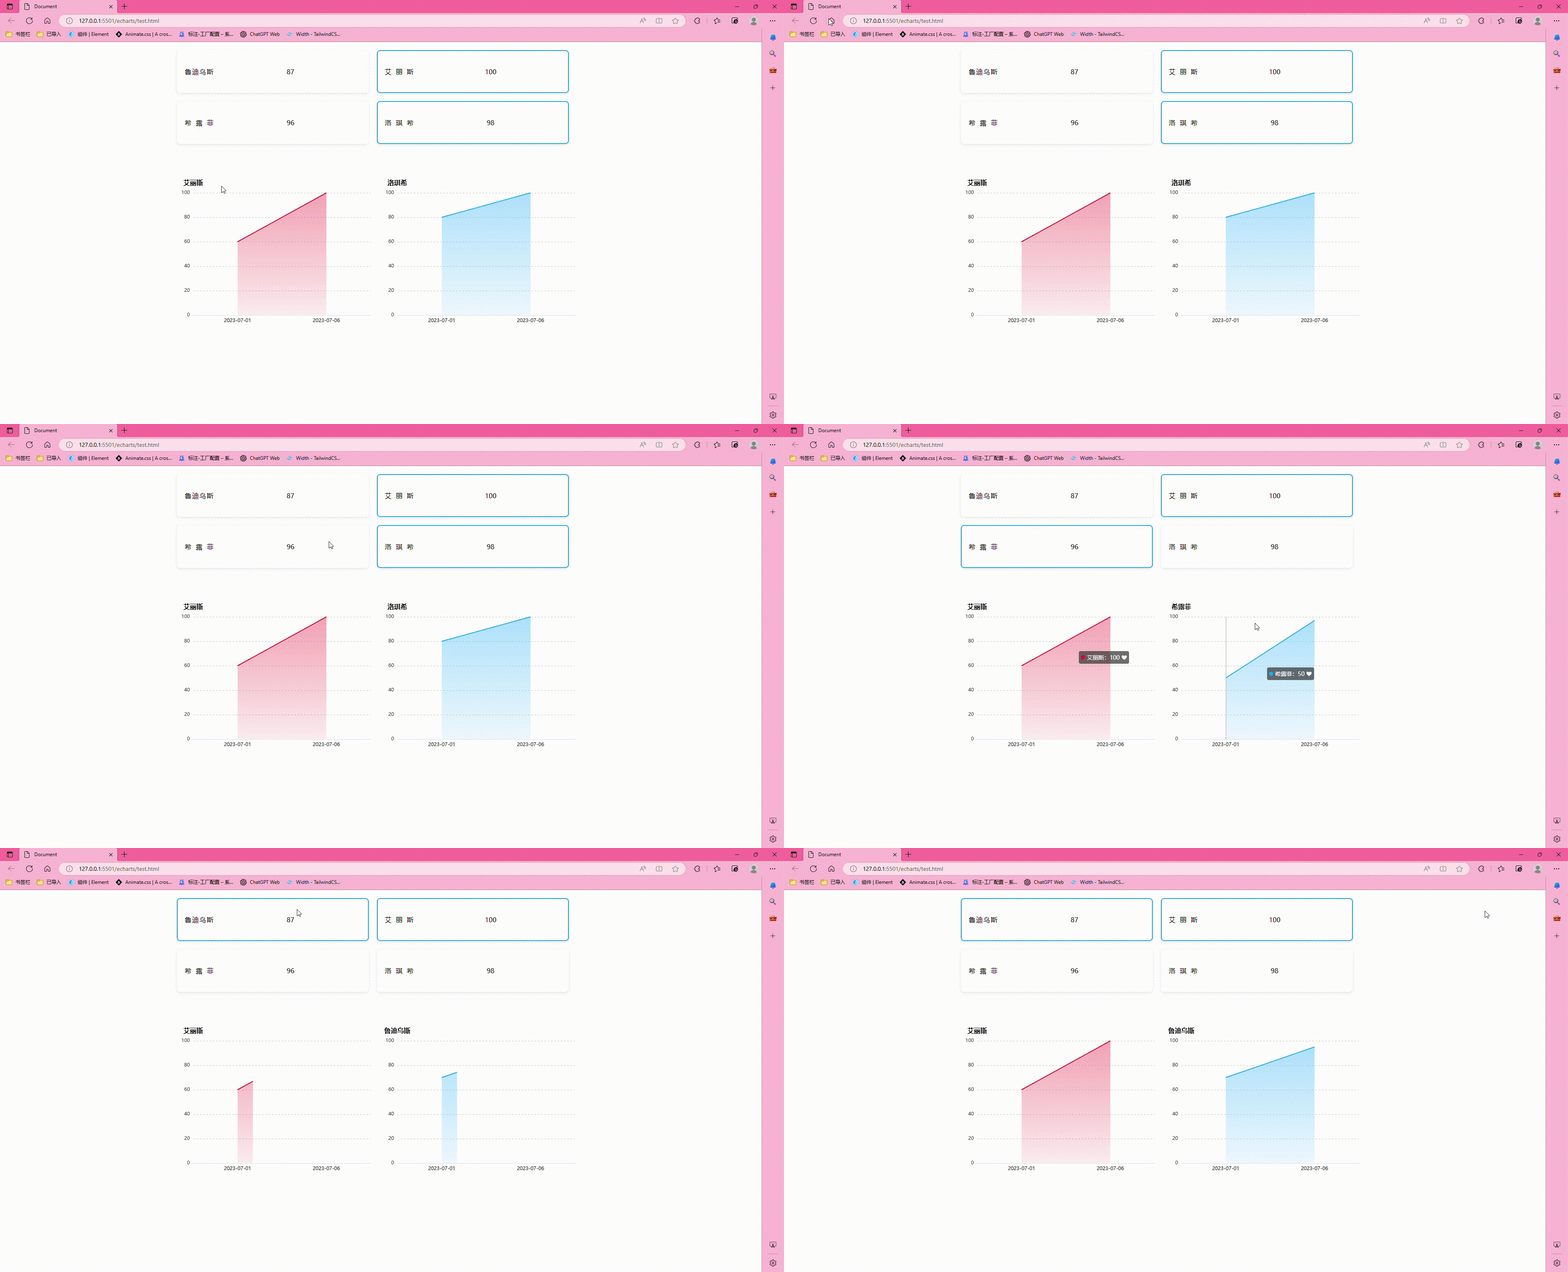
底下放置源码cv即可食用
几个注意事项:
- echartsData 这个变量是为了模拟后端数据格式
- changeTag() 这个方法是为了控制最多可以多选几条
- 最后关于循环echarts的灵感来源于 明天也要努力
<!DOCTYPE html>
<html lang="en">
  <head>
    <meta charset="UTF-8" />
    <meta name="viewport" content="width=device-width, initial-scale=1.0" />
    <title>Document</title>
    <script src="https://cdn.jsdelivr.net/npm/vue@2/dist/vue.js"></script>
    <script src="https://cdn.bootcss.com/echarts/4.2.1-rc1/echarts.min.js"></script>
  </head>
  <style>
    * {
      padding: 0;
      margin: 0;
      box-sizing: border-box;
    }
    .container {
      width: 1000px;
      margin: 0 auto;
      background-color: #fff;
      padding-top: 20px;
      height: 100%;
    }

    .typeBox {
      display: flex;
      flex-wrap: wrap;
    }
    .type_list {
      width: calc((100% - 60px) / 2);
      height: 105px;
      background: #ffffff;
      box-shadow: 0px 2px 6px 0px rgba(0, 0, 0, 0.1);
      border-radius: 8px 8px 8px 8px;
      border: 2px solid transparent;
      margin-bottom: 20px;
      margin-right: 20px;
      padding-left: 18px;
      display: flex;
      align-items: center;
      &:nth-child(2n) {
        margin-right: 0;
      }
    }
    .type_list_active {
      border: 2px solid #0fa3ff;
    }
    .w-base {
      width: 70px;
      text-align: justify;
      text-align-last: justify;
    }

    .echarts_box {
      width: 100%;
      height: 100%;
      display: flex;
      justify-content: space-between;
      flex-wrap: wrap;
      margin-top: 40px;
    }
    .line {
      width: calc(50%);
      height: 400px;
    }
  </style>
  <body>
    <div id="app">
      <div class="container">
        <div class="typeBox">
          <div
            class="type_list"
            :class="{'type_list_active': item.sel}"
            v-for="(item,i) in typeList"
            :key="i"
            @click="changeTag(item)"
          >
            <div class="w-base">{{item.title}}</div>
            <div style="flex: 1; text-align: center" class="title">
              {{item.num}}
            </div>
          </div>
        </div>

        <!-- 折线图 -->
        <div class="echarts_box">
          <div class="line" v-for="i in showData"></div>
        </div>
      </div>
    </div>

    <script>
      new Vue({
        el: '#app',
        data() {
          return {
            typeList: [],
            tagData: [], // 选中的
            echartsData: {}, // 数据源
          };
        },

        computed: {
          showData() {
            if (this.tagData == 0) {
              return this.typeList.slice(0, 2).map((v) => v.title);
            } else {
              return this.tagData;
            }
          },
        },
        created() {
          this.typeList = [
            {
              title: '鲁迪乌斯',
              num: 87,
              sel: false,
            },
            {
              title: '艾丽斯',
              num: 100,
              sel: false,
            },
            {
              title: '希露菲',
              num: 96,
              sel: false,
            },
            {
              title: '洛琪希',
              num: 98,
              sel: false,
            },
          ];
          this.echartsData = {
            date_data: ['2023-07-01', '2023-07-06'],
            艾丽斯: [60, 100],
            鲁迪乌斯: [70, 95],
            希露菲: [50, 97],
            洛琪希: [80, 100],
          };
        },

        mounted() {
          // 这边做个默认显示
          this.tagData = ['艾丽斯', '洛琪希'];

          this.typeList.forEach((v) => {
            v.sel = this.tagData.includes(v.title);
          });

          this.init(this.echartsData);
        },
        methods: {
          changeTag(item) {
            if (this.tagData.length == 2 && !item.sel) return;
            if (this.tagData.length < 2 && !item.sel) {
              item.sel = !item.sel;
              this.tagData.push(item.title);
            } else {
              item.sel = false;
              this.tagData = this.tagData.filter((v) => v != item.title);
            }
            this.init(this.echartsData);
          },

          init(data) {
            let lineData = this.showData.map((v) => data[v]);
            let rgba = ['240, 20, 47', '15, 163, 255'];

            let color = ['#F0142F', '#0FA3FF'];

            this.$nextTick(() => {
              let lineChart = document.getElementsByClassName('line');

              for (var i = 0; i < lineChart.length; i++) {
                // 通过for循环,在相同class的dom内绘制元素
                let myChart = echarts.init(lineChart[i]);
                myChart.clear();
                myChart.setOption({
                  color: color[i],
                  // 整个x y轴的内容
                  grid: {
                    top: '15%',
                    left: '8%',
                    right: '5%',
                    bottom: '10%',
                  },
                  tooltip: {
                    trigger: 'axis',
                    formatter: (params) => {
                      let html = '';
                      let unit;
                      params.forEach((element, index) => {
                        if (element.seriesName == '鲁迪乌斯') {
                          unit = '人';
                        } else {
                          unit = '❤';
                        }
                        html += `<div style="display:flex;align-items:center">
                          ${element.marker} <div>${element.seriesName}</div>:${element.data} ${unit}
                      </div>`;
                      });
                      return html;
                    },
                  },
                  xAxis: {
                    type: 'category',
                    data: data.date_data,
                    axisTick: {
                      //不显示坐标轴刻度线
                      show: false,
                    },
                    axisLine: {
                      lineStyle: {
                        type: 'solid',
                        color: '#dbdce6', //左边线的颜色
                        width: '1', //坐标线的宽度
                      },
                    },
                    axisLabel: {
                      showMaxLabel: true, // 展示最大值
                      showMinLabel: true, // 展示最小值
                      interval: 6,
                      textStyle: {
                        color: '#000', //坐标值得具体的颜色
                      },
                    },
                  },
                  yAxis: {
                    type: 'value',
                    name: this.showData[i],
                    nameTextStyle: {
                      align: 'left',
                      fontSize: 16,
                      fontWeight: 'bolder',
                      color: '#000000',
                    },
                    splitLine: {
                      show: true,
                      lineStyle: {
                        type: 'dashed',
                      },
                    },
                    axisLine: {
                      //不显示坐标轴线
                      show: false,
                    },
                    axisTick: {
                      //不显示坐标轴刻度线
                      show: false,
                    },
                  },
                  series: [
                    {
                      name: this.showData[i],
                      data: lineData[i],
                      type: 'line',
                      smooth: true,
                      symbol: 'none',
                      itemStyle: {
                        normal: {
                          lineStyle: {
                            color: color[i], //改变折线颜色
                          },
                        },
                      },
                      //  渐变色
                      areaStyle: {
                        color: new echarts.graphic.LinearGradient(0, 0, 0, 1, [
                          {
                            offset: 0,
                            color: `rgba(${rgba[i]}, 0.5)`,
                          },
                          {
                            offset: 1,
                            color: `rgba(${rgba[i]}, 0.1)`,
                          },
                        ]),
                      },
                    },
                  ],
                });
              }
            });
          },
        },
      });
    </script>
  </body>
</html>


 3003
3003


 被折叠的 条评论
为什么被折叠?


