


看到此文章, 我想你大概率是和我此时一样, 想弄一个散点图但公式没有头绪
直接上代码,
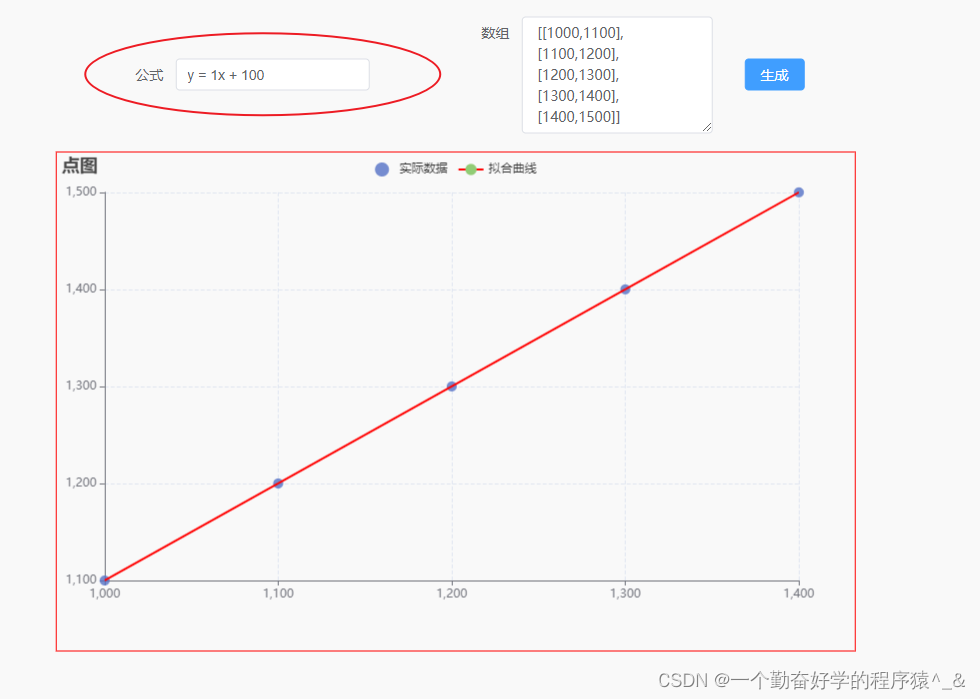
以下是利用散点图自动生成线性回归公式
  const data = [
    [1000,1100],
    [1100,1200],
    [1200,1300],
    [1300,1400],
    [1400,1500]
  ]
  // 计算平均值
  const calculateMean = arr => arr.reduce((acc, val) => acc + val, 0) / arr.length

  // 计算斜率
  const calculateSlope = (xValues, yValues, xMean, yMean) =>
    // 0 + (1000 - 平均值(1200)) *(1100 - y轴平均值(1300)) / 0 + 1000 - x平均值(1200) * 2 = ...
    // 累加:(x当前值 - x当前平均值) * (y当前值 - y当前平均值) / (x当前值 - x平均值) * (x当前值 - x平均值)
    // 0 + 1000 - 1200 * 1100 - 1300 = 40000
    // 40000 + 1100 - 1200 * 1200 - 1300 = 50000
    // 50000 + 1200 - 1200 * 1300 - 1300 = 50000
    // 50000 + 1300 - 1200 * 1400 - 1300 = 60000
    xValues.reduce((acc, _, i) => acc + (xValues[i] - xMean) * (yValues[i] - yMean), 0) /
    xValues.reduce((acc, _, i) => acc + Math.pow(xValues[i] - xMean, 2), 0)

  // 计算截距 (y平均值 - (斜率 * x平均值))
  const calculateIntercept = (xMean, yMean, slope) => yMean - slope * xMean // 1300 - 1 * 1200 = 100

  // 计算拟合公式字符串
  const generateFitEquation = (slope, intercept) => `y = ${slope.toFixed(0)}x + ${intercept.toFixed(0)}`

  // 计算拟合参数
  const xValues = data.map(point => point[0])
  const yValues = data.map(point => point[1])
  // X平均值
  const xMean = calculateMean(xValues)
  // Y平均值
  const yMean = calculateMean(yValues)
  // 斜率值
  const slope = calculateSlope(xValues, yValues, xMean, yMean)
  // 截距
  const intercept = calculateIntercept(xMean, yMean, slope)
  // 存储公式
  const fitEquation = generateFitEquation(slope, intercept)
  // console.log('xMean', xMean)
  // console.log('yMean', yMean)
  // console.log('slope', slope)
  // console.log('intercept', intercept)
  // console.log('拟合公式:', fitEquation)
  const formula = fitEquation
效果图如下:


 1869
1869


 被折叠的 条评论
为什么被折叠?
被折叠的 条评论
为什么被折叠?
 到【灌水乐园】发言


