


<template>
  <div :id="echartsId" style="width: 100%"></div>
</template>

<script setup>
  import { onMounted, ref, defineProps, watch, defineEmits, onUnmounted } from 'vue'
  import * as echarts from 'echarts'
  const emit = defineEmits(['openDialog'])
  const props = defineProps({
    // id
    echartsId: {
      type: String,
      default: 'echartsId',
    },
    // 切换重新渲染
    echartsBool: {
      type: Boolean,
      default: null,
    },
    // y轴数据上面的名字
    yAxisJsonName: {
      type: String,
      default: '单位:个数',
    },
    // y轴字体样式
    nameTextStyle: {
      type: Object,
      default: () => {
        return {
          color: '#fff',
          fontSize: 14,
          fontWeight: 400,
          verticalAlign: 'bottom',
          // 左上字体位置
          padding: [0, -20, 10, 20],
          fontFamily: 'PingFang SC',
        }
      },
    },
    // y轴字体样式
    nameTextStyleTwo: {
      type: Object,
      default: () => {
        return {
          color: '#fff',
          fontSize: 14,
          fontWeight: 400,
          verticalAlign: 'bottom',
          // 左上字体位置
          padding: [0, 20, 10, -20],
          fontFamily: 'PingFang SC',
        }
      },
    },
    // 主体宽度
    barWidth: {
      type: String,
      default: '40',
    },
    // dataListLength 大小==长度约束柱状宽度  定时器==个数 两个不会同时出现大小暂时不用
    dataListLength: {
      type: Number,
      default: 6,
    },
    // x轴展示的名字
    xAxisJson: {
      type: Array,
      default: () => {
        return []
      },
    },
    //y轴的展示名字
    yAxisJson: {
      type: Array,
      default: () => {
        return []
      },
    },
    // data展示数据
    dataJson: {
      type: Object,
      default: () => {
        return []
        // return [
        //   [10, 20, 30, 5, 8],
        //   [8, 10, 0, 30, 5],
        //   [30, 5, 0, 10, 20],
        //   [20, 30, 0, 8, 10],
        //   [5, 8, 10, 20, 30],
        // ]
      },
    },
    // legend方向
    legendDirection: {
      type: Object,
      default: () => {
        return {
          bottom: '0',
          top: '0',
          left: '0',
          right: '0',
        }
      },
    },
    // grid方向
    gridDirection: {
      type: Object,
      default: () => {
        return {
          bottom: '10%',
          top: '25%',
          right: '6%',
          left: '6%',
        }
      },
    },
    // 柱体颜色 定义的是左右渐变 ,如果不需要传过来一样的就好了
    barColorArray: {
      type: Object,
      default: () => {
        return {
          // 从左到右
          colorArr1: ['#0E3C69', '#0E336E', '#5433FF', '#20BDFF'],
          colorArr2: ['#FE8C00', '#FE8C00', '#FE8C00', '#F83600'],
          colorArr3: ['#2CA6A6', '#2CA6A6', '#43E3E3', '#247C7D'],
          colorArr4: ['#18D4A0', '#18D4A0', '#AAFFA9', '#11FFBD'],
          colorArr5: ['#823CF4', '#823CF4', '#823CF4', '#D015E0'],
        }
      },
    },
    // 顶片颜色 同柱体颜色一样
    upColorArray: {
      type: Object,
      default: () => {
        return {
          colorArr1: ['#2484BA', '#2484BA', '#2D9DD6', '#2D9DD6'],
          colorArr2: ['#FDB600', '#FDB600', '#FDB600', '#FDB600'],
          colorArr3: ['#44E6E6', '#44E6E6', '#44E6E6', '#44E6E6'],
          colorArr4: ['#1DF9BC', '#1DF9BC', '#1DF9BC', '#1DF9BC'],
          colorArr5: ['#6515E8', '#6515E8', '#6515E8', '#6515E8'],
        }
      },
    },
    // 底部颜色
    bottomColorArray: {
      type: Array,
      default: () => {
        return []
      },
    },
    // 开启底部颜色不
    openBottomColor: {
      type: Boolean,
      default: false,
    },
    // 类型判断 ==>整改率==line
    zglType: {
      type: String,
      default: '',
    },
    formatterParams: {
      type: Array,
      default: [
        { name: '隐患事件督办', color: '#455AFF' },
        { name: '不安全事件督办', color: '#FC7A00' },
        { name: '风险督办', color: '#8AFFAD' },
        { name: '重大作业督办', color: '#3BCCCD' },
        { name: '其他', color: '#AF24E8' },
      ],
    },
  })
  //组织颜色
  let setColor = function (colorArr) {
    let color = {
      type: 'linear',
      x: 0,
      x2: 1,
      y: 0,
      y2: 0,
      /* 此处决定阴暗面 若为横向柱状图则x,y轴调换
					x: 0,
					x2: 0,
					y: 0,
					y2: 1, */
      colorStops: [
        {
          offset: 0,
          color: colorArr[0],
        },
        {
          offset: 0.5,
          color: colorArr[1],
        },
        {
          offset: 1,
          color: colorArr[2],
        },
        {
          offset: 0.5,
          color: colorArr[3],
        },
      ],
    }
    return color
  }
  // 设置每一项的叠加总数,方便serve的顶部渲染
  const upStack = ref({
    upStackArr1: [],
    upStackArr2: [],
    upStackArr3: [],
    upStackArr4: [],
    upStackArr5: [],
  })
  const serveStack = () => {
    const stackLength = props.dataJson.length
    for (let i = 0; i < stackLength; i++) {
      const currentStackArr = props.dataJson[i]
      let sumArr = []
      if (i === 0) {
        sumArr = currentStackArr
      } else {
        const prevStackArr = upStack.value[`upStackArr${i}`]
        sumArr = currentStackArr.map((value, index) => value + prevStackArr[index])
      }
      upStack.value[`upStackArr${i + 1}`] = sumArr
    }
  }
  const series = ref([])
  const bf_series = ref([])
  const actionSeries = () => {
    series.value = []
    props.yAxisJson?.forEach((el, index) => {
      if (el == '整改率' || el == '评价率') {
        series.value.push(
          // 线体
          {
            type: 'line',
            name: el,
            data: props.dataJson[index], //Y轴上的高度
            smooth: true,
            yAxisIndex: 1,
            tooltip: {
              valueFormatter: function (value) {
                return value + ' %'
              },
            },
          }
        )
      } else {
        //   stack: 'total', 堆叠字段
        series.value.push(
          // 柱体
          {
            z: 1,
            type: 'bar',
            name: el,
            barGap: '15%', //相邻柱子间距
            itemStyle: {
              borderRadius: [0, 0, 0, 0], //柱子四周圆角
              color: setColor(props.barColorArray[`colorArr${index + 1}`]), //柱子左右颜色(深,浅)
            },
            data: props.dataJson[index], //Y轴上的高度
            // 做了滚动暂时不用了
            // barWidth: props.dataJson[0]?.length > props.dataListLength ? props.barWidth : '40',
            barWidth: '40',
            // barWidth:props.barWidth,
            stack: 'total',
          },
          //   每一个柱体的顶部
          {
            z: 3,
            name: el,
            type: 'pictorialBar',
            symbolPosition: 'end',
            data: upStack.value[`upStackArr${index + 1}`], //此数据对应顶部组件
            symbol: 'diamond',
            symbolOffset: ['0%', '-50%'],
            // 做了滚动暂时不用了
            // symbolSize: computedBarWidth(),
            symbolSize: [40 - 4, (10 * (40 - 10)) / 40],
            itemStyle: {
              normal: {
                borderColor: props.upColorArray[`colorArr${index + 1}`][2],
                borderWidth: 1, //加上棱角分明
                color: setColor(props.upColorArray[`colorArr${index + 1}`]), //柱子左右颜色(深,浅)
              },
            },
            tooltip: {
              show: false,
            },
            stack: 'total',
          }
        )
      }
    })
    // 底部 暂时不需要
    if (props.openBottomColor) {
      series.value.push({
        z: 2,
        name: '柱子1',
        type: 'pictorialBar',
        data: [0, 0, 0, 0, 0], //此数据对应底部组件
        symbol: 'diamond', //底部组件形状,不写默认为椭圆
        symbolOffset: ['0%', '50%'], //与柱子的偏移角度
        symbolSize: [25, 10], //底面[宽,高]
        itemStyle: {
          normal: {
            color: setColor(props.bottomColorArray), //底面左右颜色(深,浅)
          },
        },
        tooltip: {
          show: false,
        },
        stack: 'total',
      })
    }
    bf_series.value = series.value
  }
  var option = {
    dataZoom: [
      {
        show: false, // 是否显示滑动条
        xAxisIndex: 0, // 表示从X轴的零刻度线开始的
        startValue: 0, // 数据窗口范围的起始数值
        endValue: props.dataListLength - 1, // 数据窗口范围的结束数值(一次性展示几个)
      },
    ],
    tooltip: {
      trigger: 'axis',
      axisPointer: {
        type: 'shadow',
      },
      formatter: function (params) {
        var tooltipContent = '' // 初始化 tooltip 内容字符串
        let all = 0
        params.forEach((item) => {
          if (props.zglType == 'zgl') {
            if (item.seriesName == '未治理数' || item.seriesName == '已治理数') all += item.value
          } else if (props.zglType == 'pjl') {
            if (
              item.seriesName == '未评价数' ||
              item.seriesName == '已评价数' ||
              item.seriesName == '已关闭数'
            )
              all += item.value
          } else all += item.value
        })
        tooltipContent += `<div class='tooltipContent'>${
          props.zglType == 'zgl' ? '汇总数' : props.zglType == 'pjl' ? '评价总数' : '总数'
        }:<span style='color:#FF3A3A'>${all}</span></div>`
        params.forEach((item) => {
          props.formatterParams.forEach((el) => {
            if (item.seriesName == el.name) {
              tooltipContent += `<div class='tooltipContent'>${item.seriesName}:<span style='color:${
                el.color
              }'>${item.value + ''}${el.unit ? el.unit : ''}</span></div>`
            }
          })
        })
        return "<div class='tooltipBox'>" + tooltipContent + '</div>' // 返回自定义的 tooltip 内容
      },
      // 自定义 tooltip 的样式
      extraCssText:
        'width: 120px;height: 140px;padding:0;margin:0 ;background: #0A1A34;border: 1px solid #59AFF9B4;box-shadow: 0px 1px 12px 0px #03FBFFA6 inset;',
    },
    legend: {
      show: true,
      data: props.yAxisJson,
      selectedMode: true,
      textStyle: {
        color: '#fff',
        fontSize: '14',
      },
      top: props.legendDirection.top,
      bottom: props.legendDirection.bottom,
      left: props.legendDirection.left,
      right: props.legendDirection.right,
    },
    grid: {
      right: props.gridDirection.right,
      top: props.gridDirection.top,
      bottom: props.gridDirection.bottom,
      left: props.gridDirection.left,
    },
    xAxis: {
      type: 'category',
      axisLabel: {
        color: '#FFFFFF',
      },
      axisLine: {
        show: true,
        lineStyle: {
          color: '#1B3F66',
        },
      },
      axisTick: {
        show: false,
      },
      data: props.xAxisJson,
    },
    yAxis: [],
    series: [],
  }
  // legend 监听处理的事
  const legendselectAction = (selected_false_name) => {
    let indexArray = []
    let bf_upStack = JSON.parse(JSON.stringify(upStack.value))
    //   找到名字下标
    selected_false_name.forEach((el) => {
      indexArray.push(props.yAxisJson.indexOf(el))
    })
    //   找到下标一致的数据,对其他的数据进行相减得到新的up数据
    indexArray.forEach((el) => {
      // 找到对应需要减的下标
      for (let index = el + 1; index < 5; index++) {
        const currentStackArr = props.dataJson[el]
        // bf_upStack[`upStackArr${index}`] = [];
        var sy = []
        // 遍历数组,对应下标进行相减
        for (var i = 0; i < bf_upStack[`upStackArr${index + 1}`].length; i++) {
          sy.push(bf_upStack[`upStackArr${index + 1}`][i] - currentStackArr[i])
        }
        bf_upStack[`upStackArr${index + 1}`] = sy
      }
    })
    //   重新赋值server
    props.yAxisJson.forEach((el, index) => {
      series.value.forEach((item) => {
        if (el == item.name && item.type != 'bar' && item.type != 'line') {
          item.data = bf_upStack[`upStackArr${index + 1}`]
        }
      })
    })
  }
  // y轴的维度有几个
  let yAxis = {
    y1: {
      name: props.yAxisJsonName,
      nameTextStyle: props.nameTextStyle,
      type: 'value',
      max: props.yAxisJson.max,
      position: 'left',
      // 字体样式
      axisLabel: {
        formatter: '{value}',
        color: '#fff', //更改坐标轴文字颜色
        fontSize: 12, //更改坐标轴文字大小
      },
      axisLine: {
        show: true,
        lineStyle: {
          color: '#1B3F66',
        },
      },
      splitLine: {
        show: true,
        lineStyle: {
          type: 'dashed', // 将轴线设置为虚线
          color: '#35414C',
        },
      },
    },
    y2: {
      type: 'value',
      name: '单位:比例',
      max: 100,
      position: 'right',
      // 字体样式
      axisLabel: {
        formatter: '{value}',
        color: '#fff', //更改坐标轴文字颜色
        fontSize: 12, //更改坐标轴文字大小
      },
      axisLine: {
        show: true,
        lineStyle: {
          color: '#1B3F66',
        },
      },
      splitLine: {
        show: true,
        lineStyle: {
          type: 'dashed', // 将轴线设置为虚线
          color: '#35414C',
        },
      },
      nameTextStyle: props.nameTextStyleTwo,
    },
  }
  let timer = '' // 定时器
  const stopAnimation = () => {
    clearInterval(timer)
    timer = null
  }
  // 通过props.dataJson[0] 进行长度判断是否滚动
  const startAnimation = () => {
    timer = setInterval(() => {
      // 每次向后滚动一个,最后一个从头开始
      if (option.dataZoom[0].endValue === props.dataJson[0]?.length - 1) {
        option.dataZoom[0].startValue = 0 // 数据窗口范围的起始数值
        option.dataZoom[0].endValue = props.dataListLength - 1 // 数据窗口范围的结束数值
      } else {
        option.dataZoom[0].startValue = option.dataZoom[0].startValue + 1 // 数据窗口范围的起始数值
        option.dataZoom[0].endValue = option.dataZoom[0].endValue + 1 // 数据窗口范围的结束数值
      }
      chart.setOption(option)
    }, 3000)
  }
  const initData = () => {
    // 设置每一项的叠加总数,
    serveStack()
    // 对series进行处理
    actionSeries()
    option.xAxis.data = []
    option.legend.data = []
    option.xAxis.data = props.xAxisJson
    option.legend.data = props.yAxisJson
    option.series = series.value
    option.yAxis = []
    option.yAxis.push(yAxis.y1)
    // 如果有整改率和评价率的就要一个y2比例维度
    if (props.zglType == 'zgl' || props.zglType == 'pjl') {
      option.yAxis.push(yAxis.y2)
    }
    chart.setOption(option, true)
    // 统计维度x轴为公司和数据长度大于设置的长度的才开启滚动
    if (props.dataJson[0]?.length > props.dataListLength - 1) {
      startAnimation()
    }
  }
  let chart = ''
  onMounted(() => {
    const chartDom = document.getElementById(`${props.echartsId}`)
    chart = echarts.init(chartDom)
    initData()
    // 监听 legend 的点击事件
    chart.on('legendselectchanged', function (params) {
      let selected_false_name = []
      for (const key in params.selected) {
        const element = params.selected[key]
        // 找到为false的name
        if (!element) {
          selected_false_name.push(key)
        }
      }
      legendselectAction(selected_false_name)
      option.series = series.value
      chart.setOption(option, false)
    })
    chart.on('click', function (params) {
      emit('openDialog', params)
    })
  })
  onUnmounted(() => {
    stopAnimation()
  })
  watch(
    () => props.echartsBool,
    (newValue, oldValue) => {
      // 清除之前的视图
      chart.clear()
      stopAnimation()
      initData()
    },
    { deep: true }
  )
  const computedBarWidth = () => {
    // 如果x轴长度小于4都是固定宽度,大于4后才会动态宽度
    if (props.zglType && props.dataJson[0]?.length > props.dataListLength) {
      return ['50%', '8%']
    } else if (props.zglType) {
      return [40 - 4, (10 * (40 - 10)) / 40]
    } else {
      return [props.barWidth - 4, (10 * (props.barWidth - 10)) / props.barWidth]
    }
  }
</script>
<style>
  .tooltipContent {
    color: #99afcc;
    text-align: left;
    font-size: 14px;
    span {
      font-size: 14px;
      margin-left: 10px;
    }
  }
  .tooltipBox {
    width: 155px;
    height: 178px;
    background: url('~@/assets/digitalSafetySupervisionBigData/echartsColumnarbody_tooltip_bg.png')
      center/155px 178px;
    margin: -10px;
    padding: 20px;
  }
</style>
展示效果:目前是上面代码根据数量的多少进行一个重复渲染,因为这种方案不会让柱体宽度缩小影响观看效果,当然,上面代码也有跟随数量的多少进行宽度的变化,注释没删。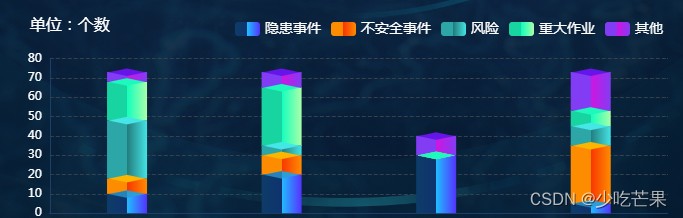
问题点:当某项数据为0的时候,顶部颜色不匹配,希望大佬看见能帮忙解决


 521
521

 被折叠的 条评论
为什么被折叠?
被折叠的 条评论
为什么被折叠?
 到【灌水乐园】发言


