


ELK=Elasticsearch+Logstash+Kibana
ELK是一款主流的日志平台架构,分布式,毫秒级响应的特性适用于大量数据的筛查,支持api接口访问
内存:推荐配置:64G 可用配置:32G、16G 配置下限:8G
CPU:双核到8核都可以 核数优先于单核的处理能力。
硬盘:源文件约2.5倍的空间
下载地址:https://www.elastic.co/cn/downloads(推荐低版本安装)
前置准备
wget https://artifacts.elastic.co/downloads/elasticsearch/elasticsearch-7.7.0-x86_64.rpm
wget https://artifacts.elastic.co/downloads/kibana/kibana-7.7.0-x86_64.rpm
wget https://artifacts.elastic.co/downloads/logstash/logstash-7.7.0.rpm
wget https://repo.huaweicloud.com/java/jdk/8u201-b09/jdk-8u201-linux-x64.rpm

systemctl stop firewalld.service
开始安装
Elasticsearch
安装Elasticsearch
rpm --import https://artifacts.elastic.co/GPG-KEY-elasticsearch
rpm --install elasticsearch-7.7.0-x86_64.rpm
设置开机自启
systemctl daemon-reload
systemctl enable elasticsearch
启动Elasticsearch
systemctl start elasticsearch
修改配置文件
vim /etc/elasticsearch/elasticsearch.yml
#集群名称
cluster.name: test-el
#节点名称
node.name: node-1
#监听IP
network.host: 0.0.0.0
#初始化设置
cluster.initial_master_nodes: ["node-1", "node-2"]
重启Elasticsearch
systemctl restart elasticsearch
Kibana
安装Kibana
rpm -ivh kibana-7.7.0-x86_64.rpm
设置开机自启
systemctl daemon-reload
systemctl enable kibana
修改配置文件
vim /etc/kibana/kibana.yml
#服务端口
server.port: 5601
#监听地址
server.host: "0.0.0.0"
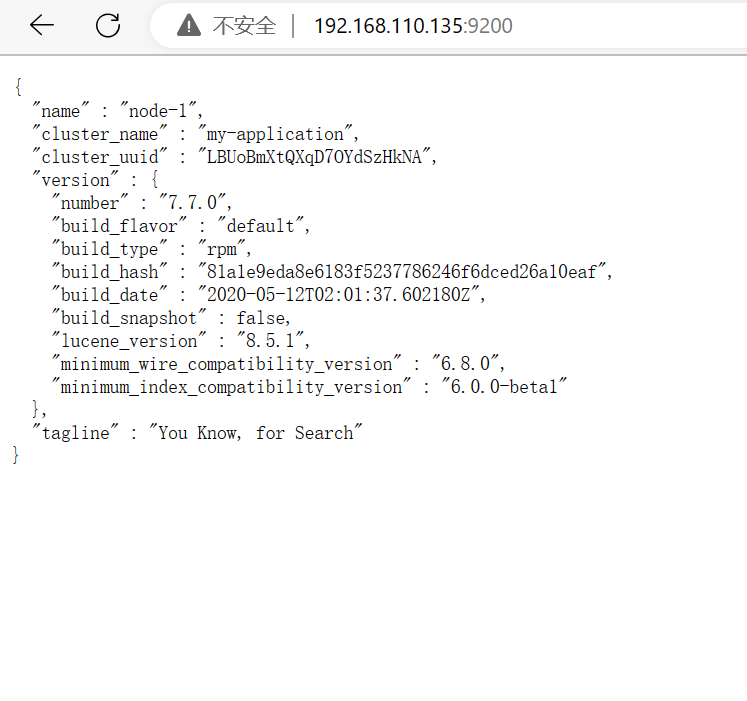
#elasticsearch 的地址+端口
elasticsearch.hosts: ["http://192.168.110.135:9200"]
#语言
i18n.locale: "zh-CN"
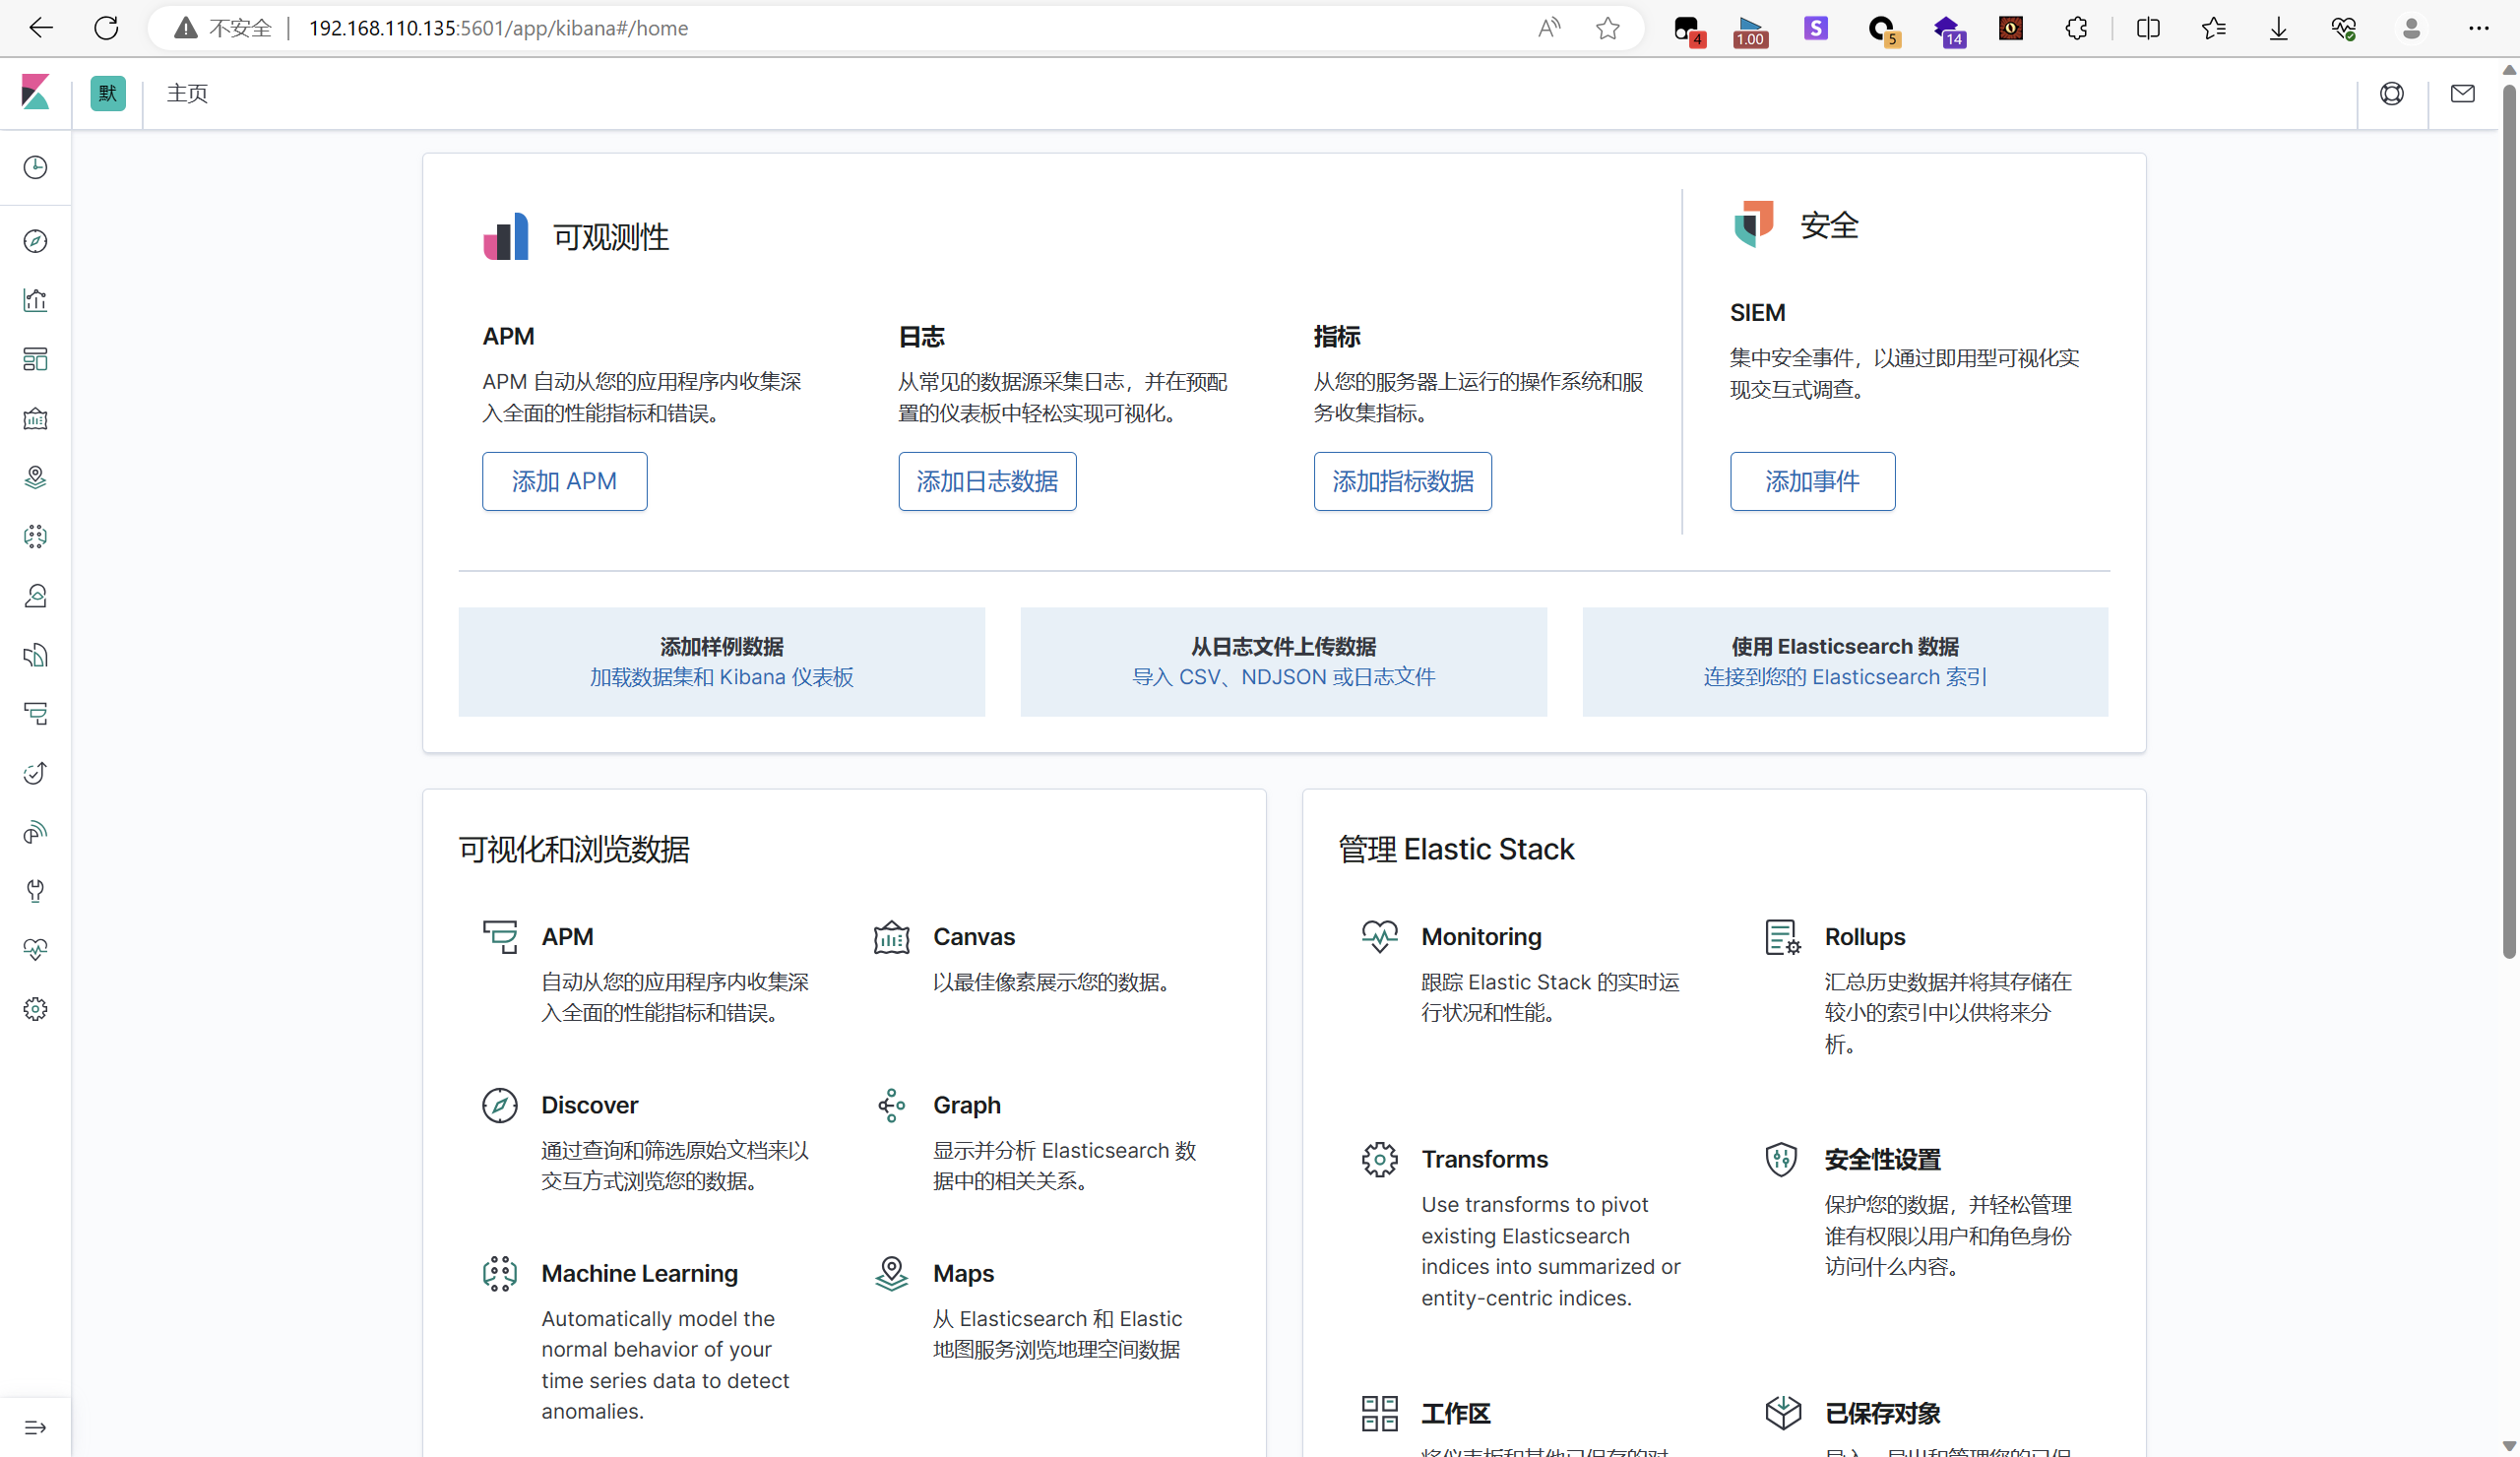
启动Kibana
systemctl start kibana
Logstash
安装java
rpm -ivh jdk-8u201-linux-x64.rpm
安装Logstash
rpm -ivh logstash-7.7.0.rpm
设置开机自启
systemctl daemon-reload
systemctl enable logstash
启动Logstash
systemctl start logstash
导入社工库
创建配置文件
vim /usr/share/logstash/bin/1.conf
input {
  file {
    path => ["/root/data.csv"]
	# 设置多长时间检测文件是否修改(单位:秒)
	stat_interval => 1
	# 监听文件的起始位置,默认是end
	start_position => beginning
	# 监听文件读取信息记录的位置(名称随便填一个)
	sincedb_path => "/root/data_db.txt"
	# 设置多长时间会写入读取的位置信息(单位:秒)
	sincedb_write_interval => 5
    	codec => plain{
		charset=>"GBK"
		}
	}
}
filter {
	#去除每行记录中需要过滤的\N,替换为空字符串
	mutate{
		gsub => [ "message", "\\r", "" ]
	}
	csv {
		# 每行记录的字段之间以|分隔
		separator => ","
		columns => ["name","phone","sfz"]
		# 过滤掉默认加上的字段
		remove_field => ["host", "tags", "path", "message","@timestamp","@version"]
	}
}
output {
    elasticsearch {
        hosts => ["127.0.0.1:9200"]
        index => "social"
    }
#建议吧stdout这段删除,会影响到导入数据,这个是显示导入数据过程的
	stdout {
		codec => rubydebug
	}
}
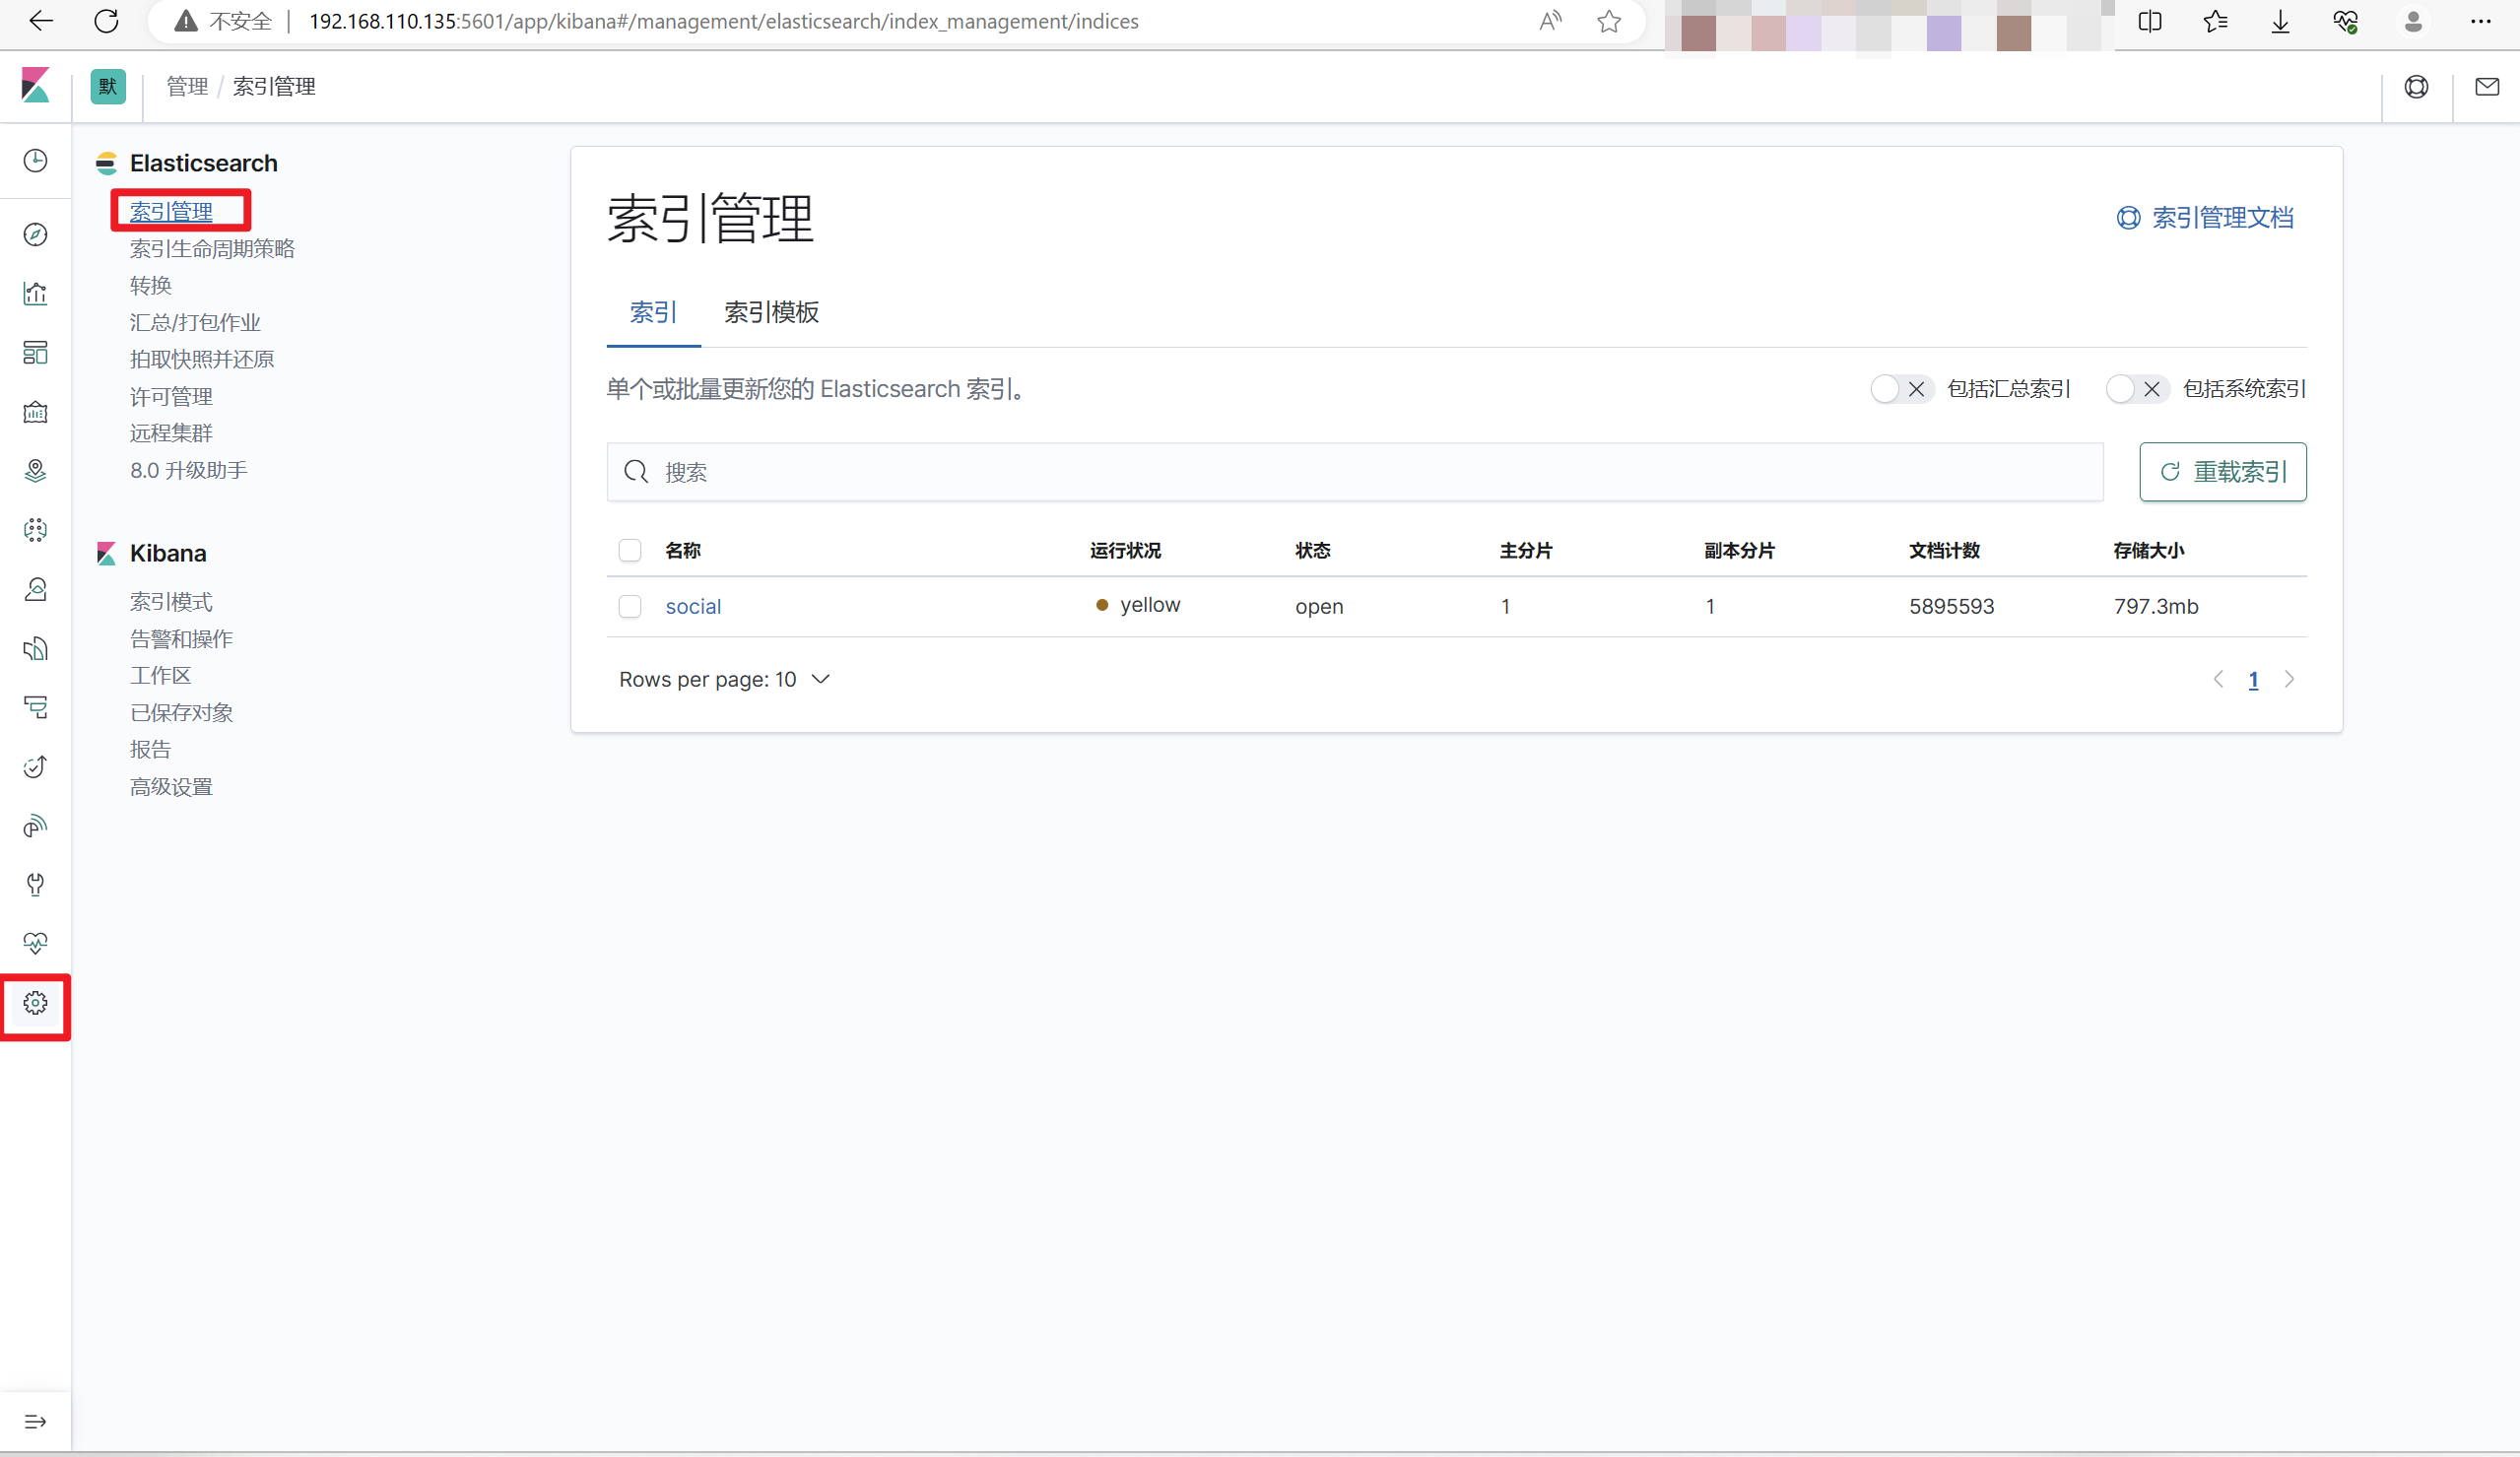
生成数据
/usr/share/logstash/bin/logstash -f 1.conf
社工库部署
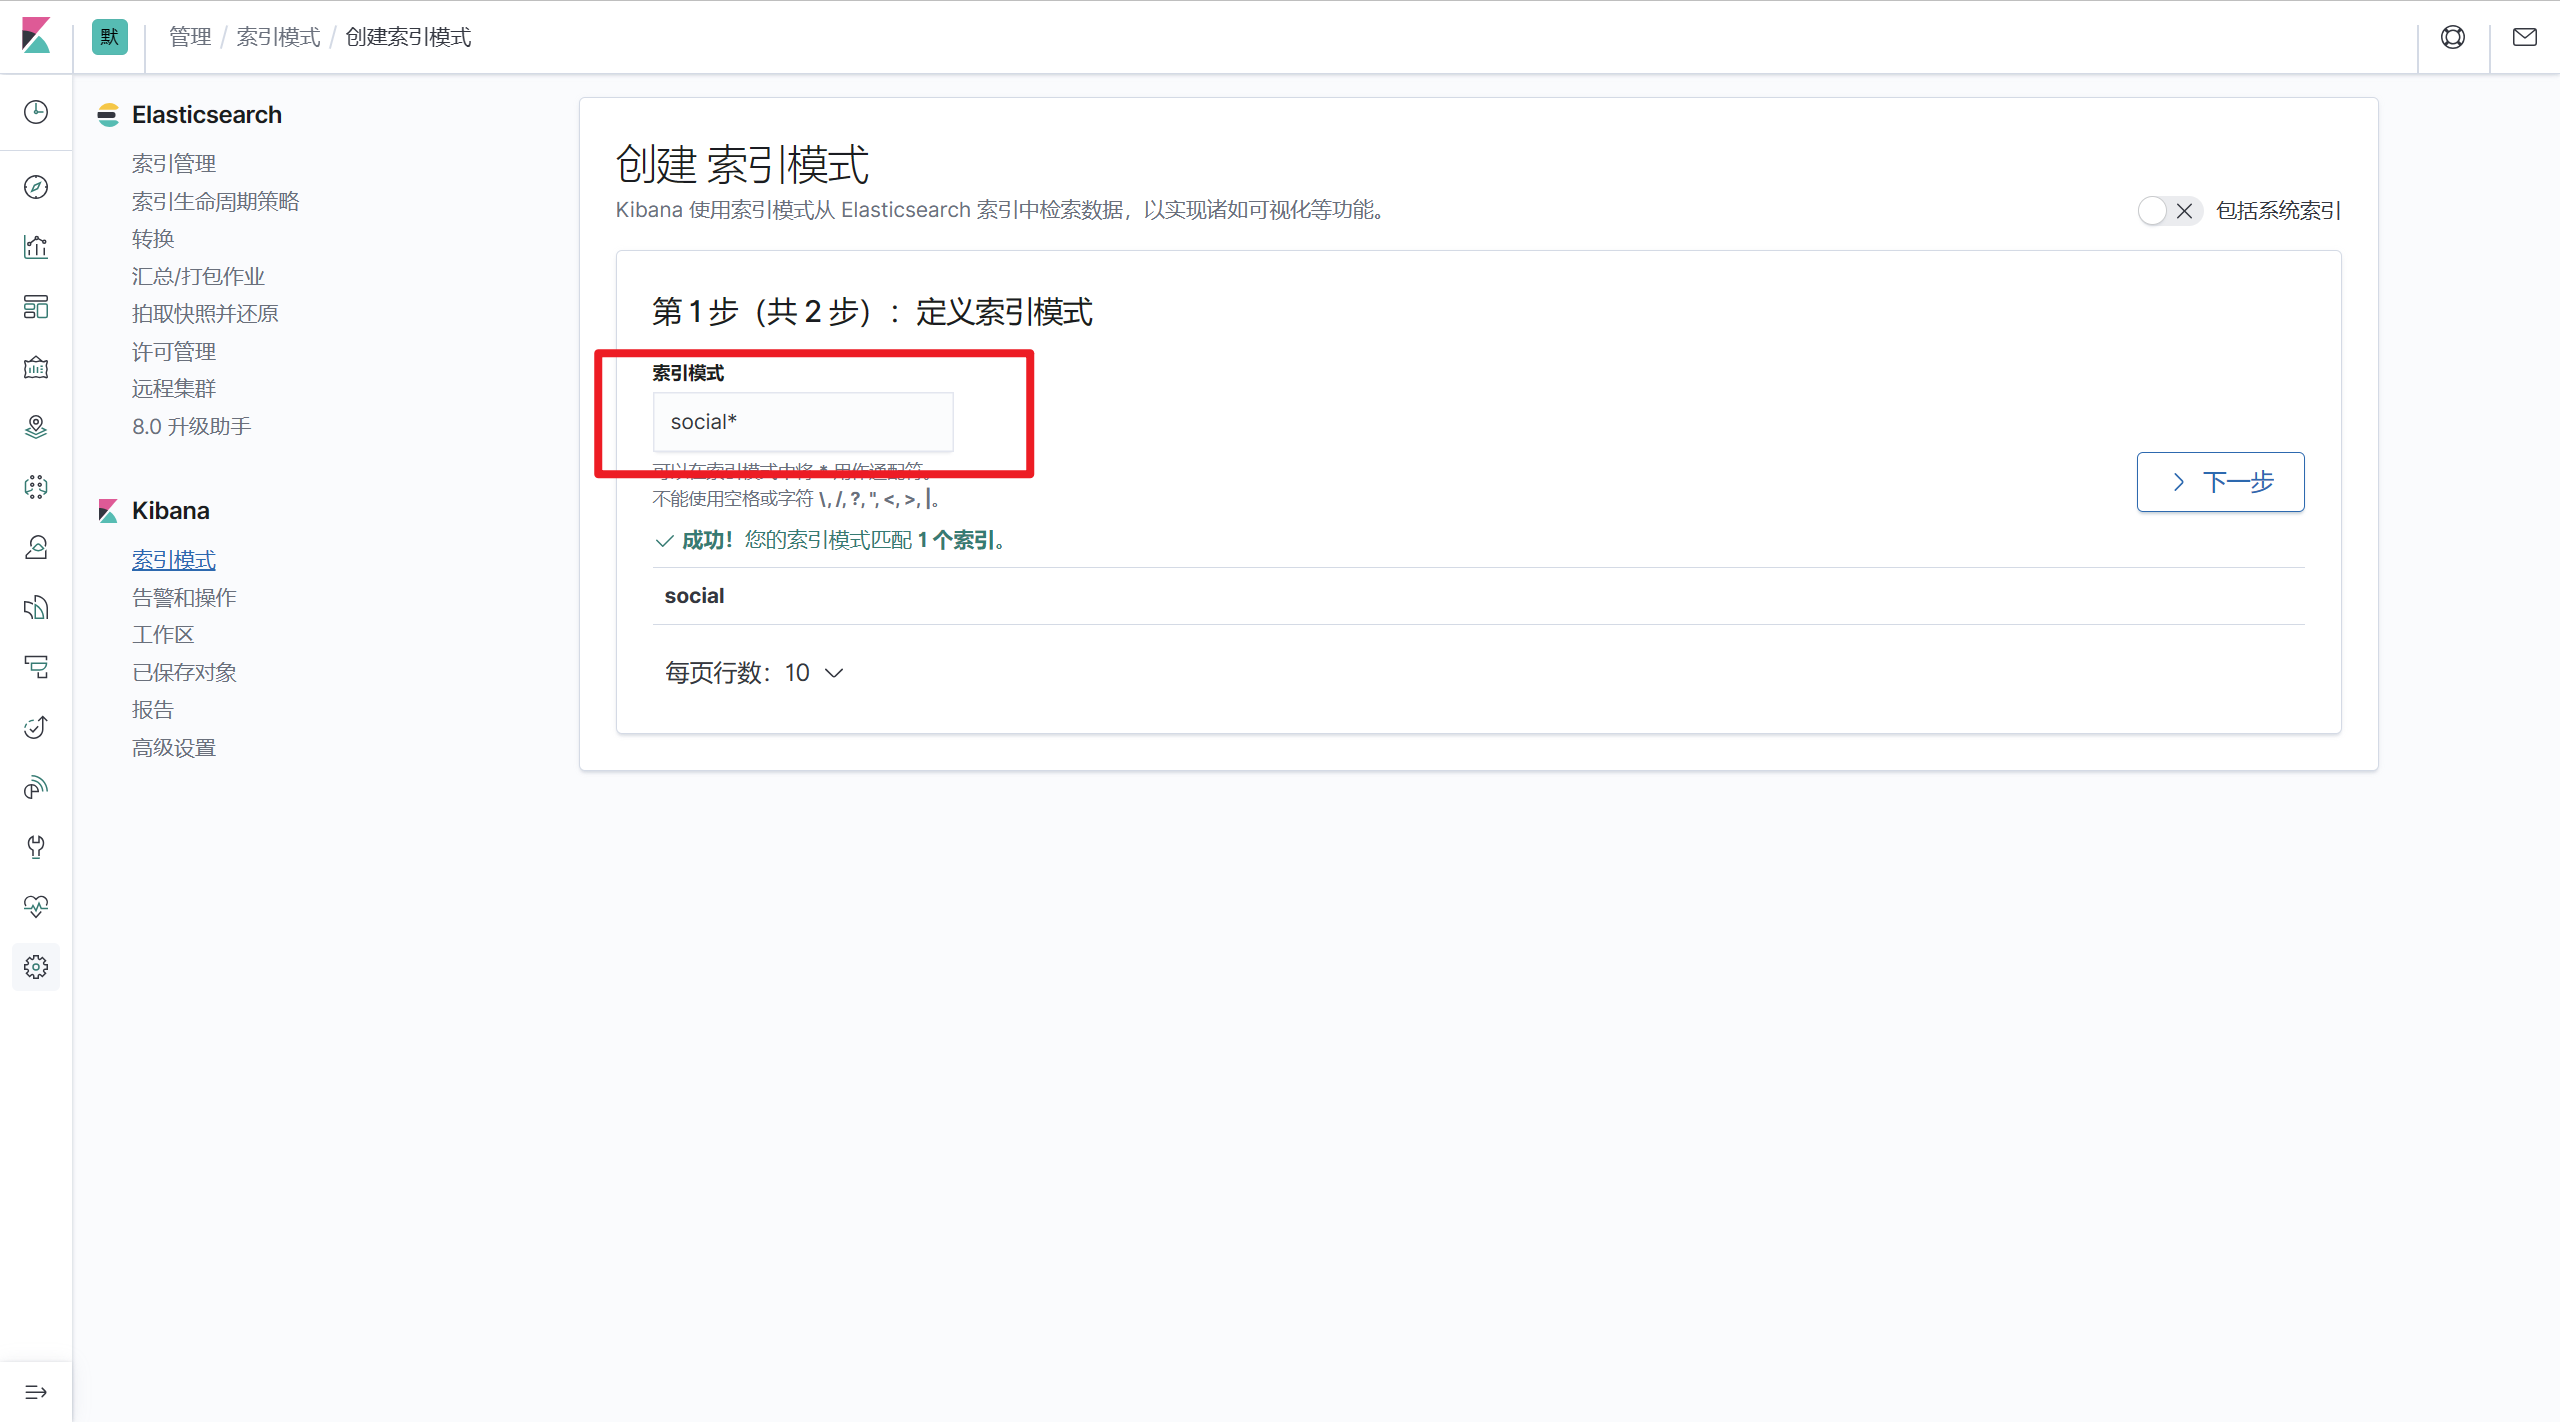
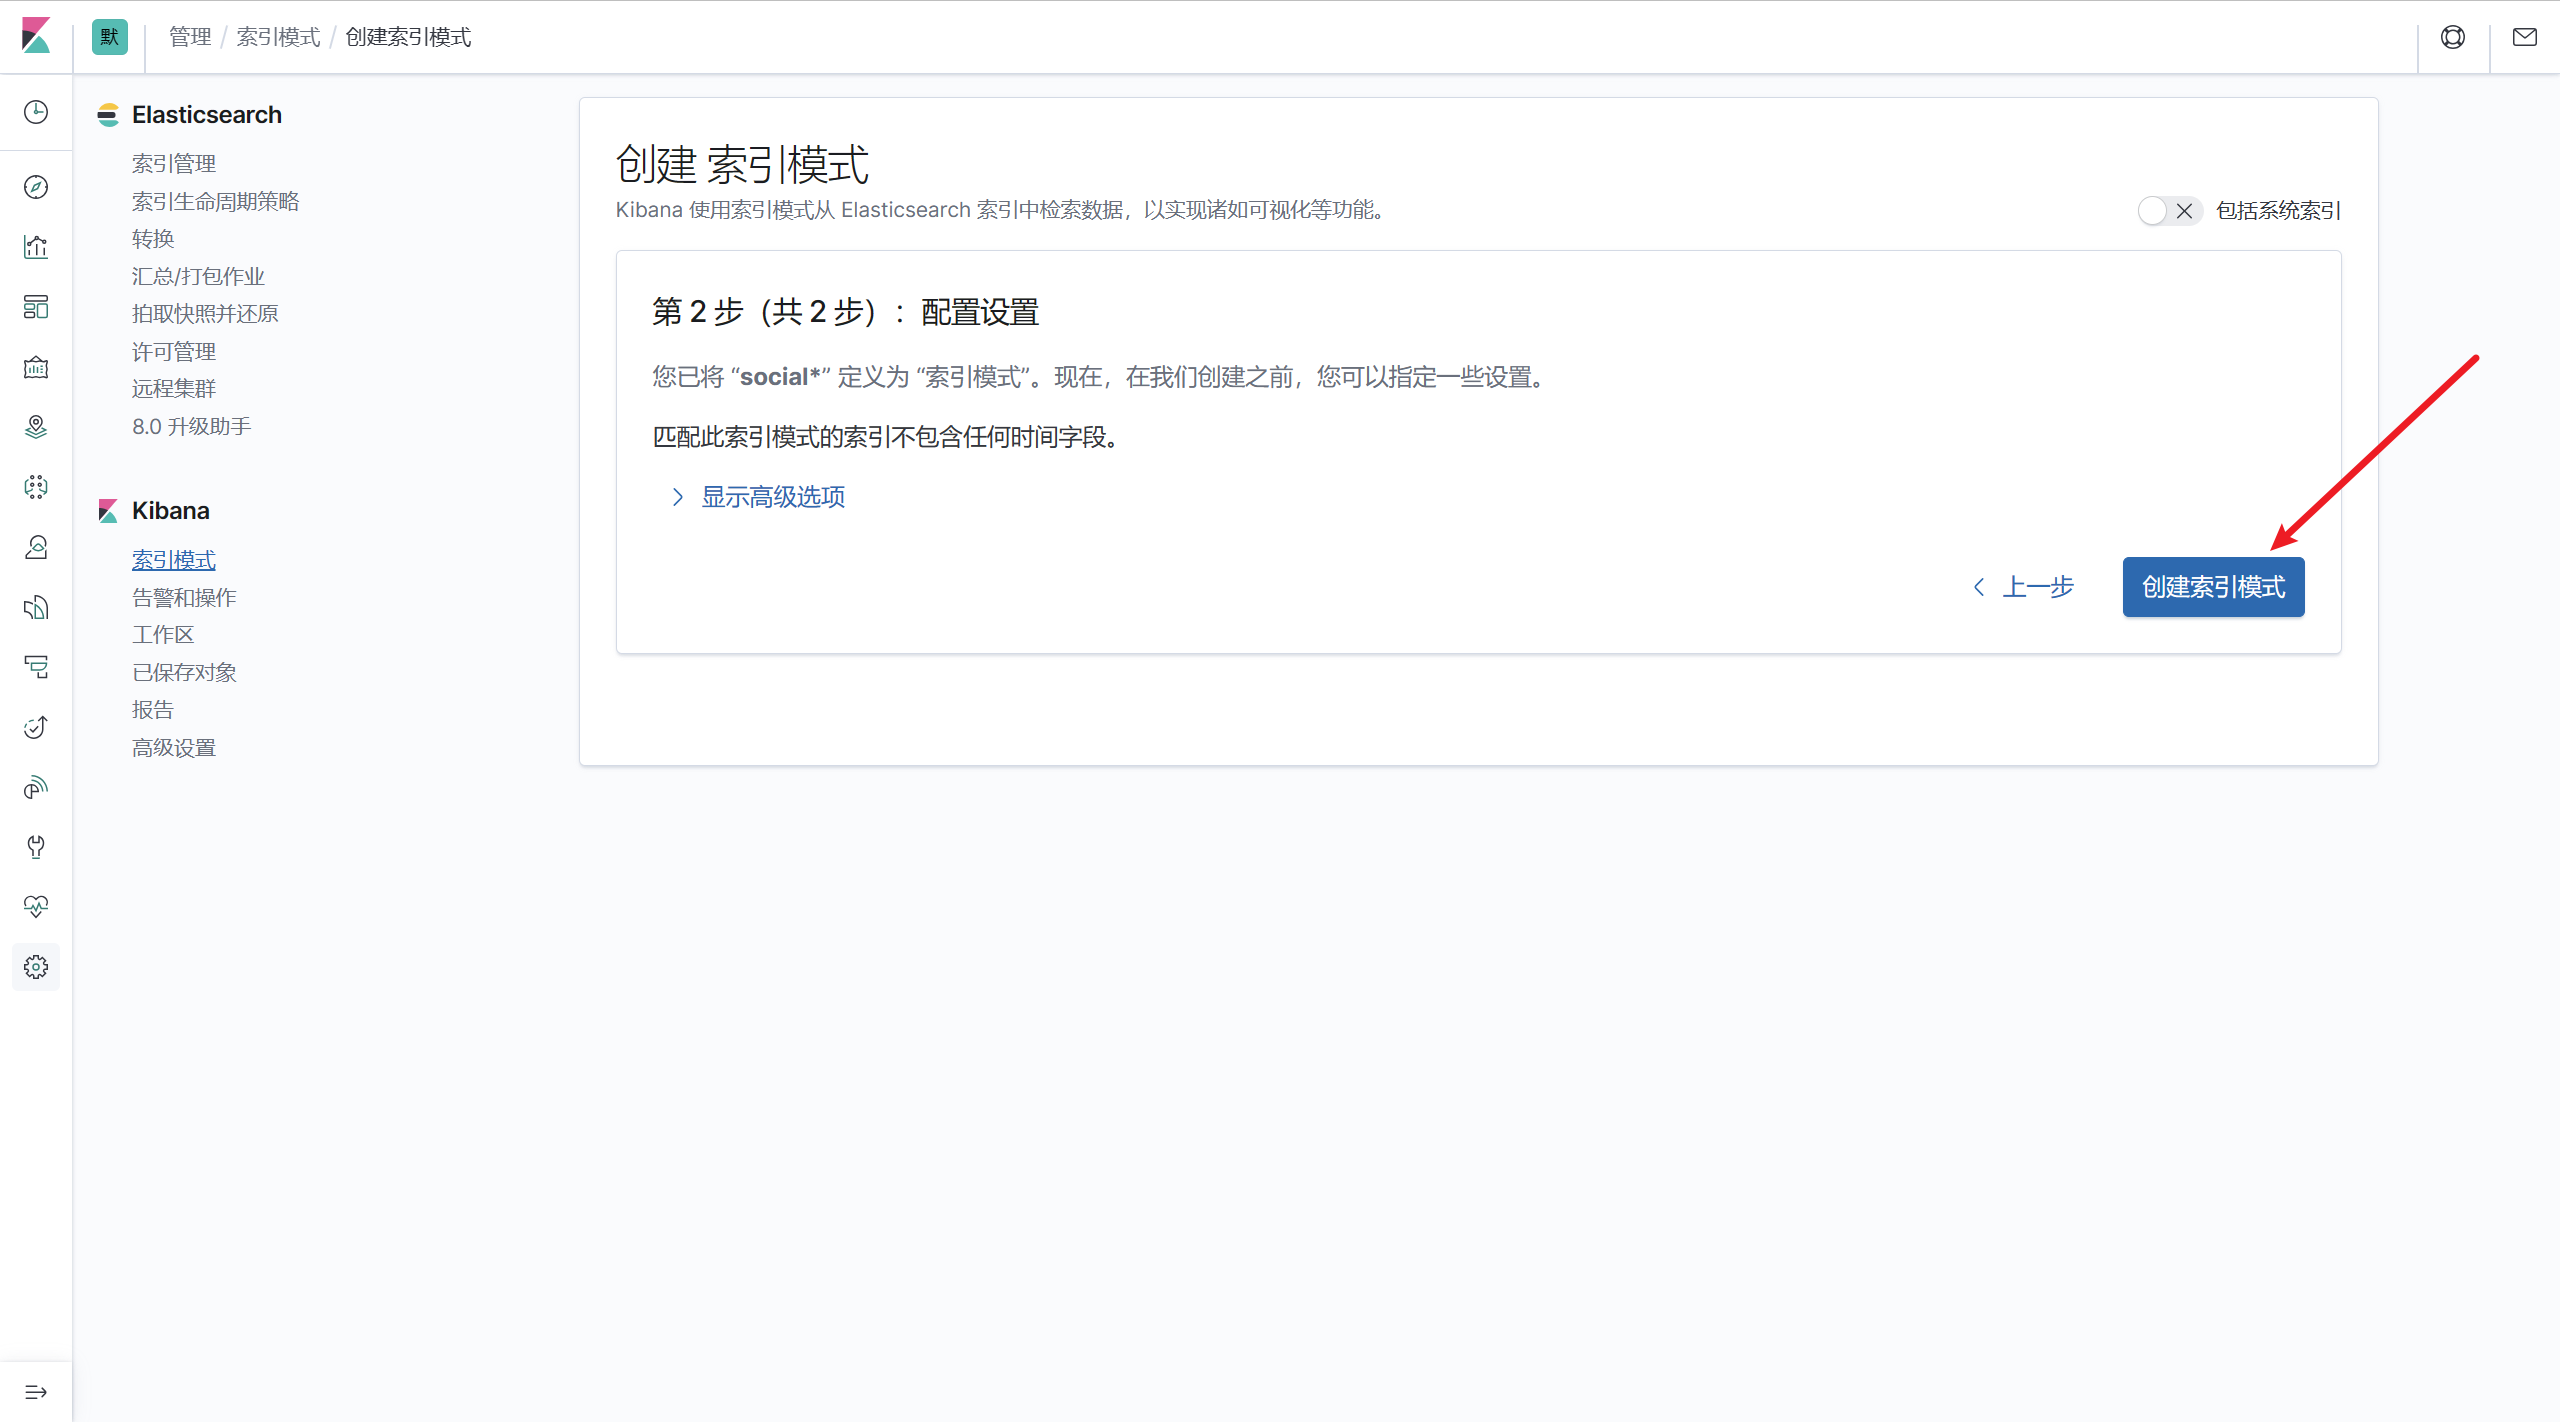
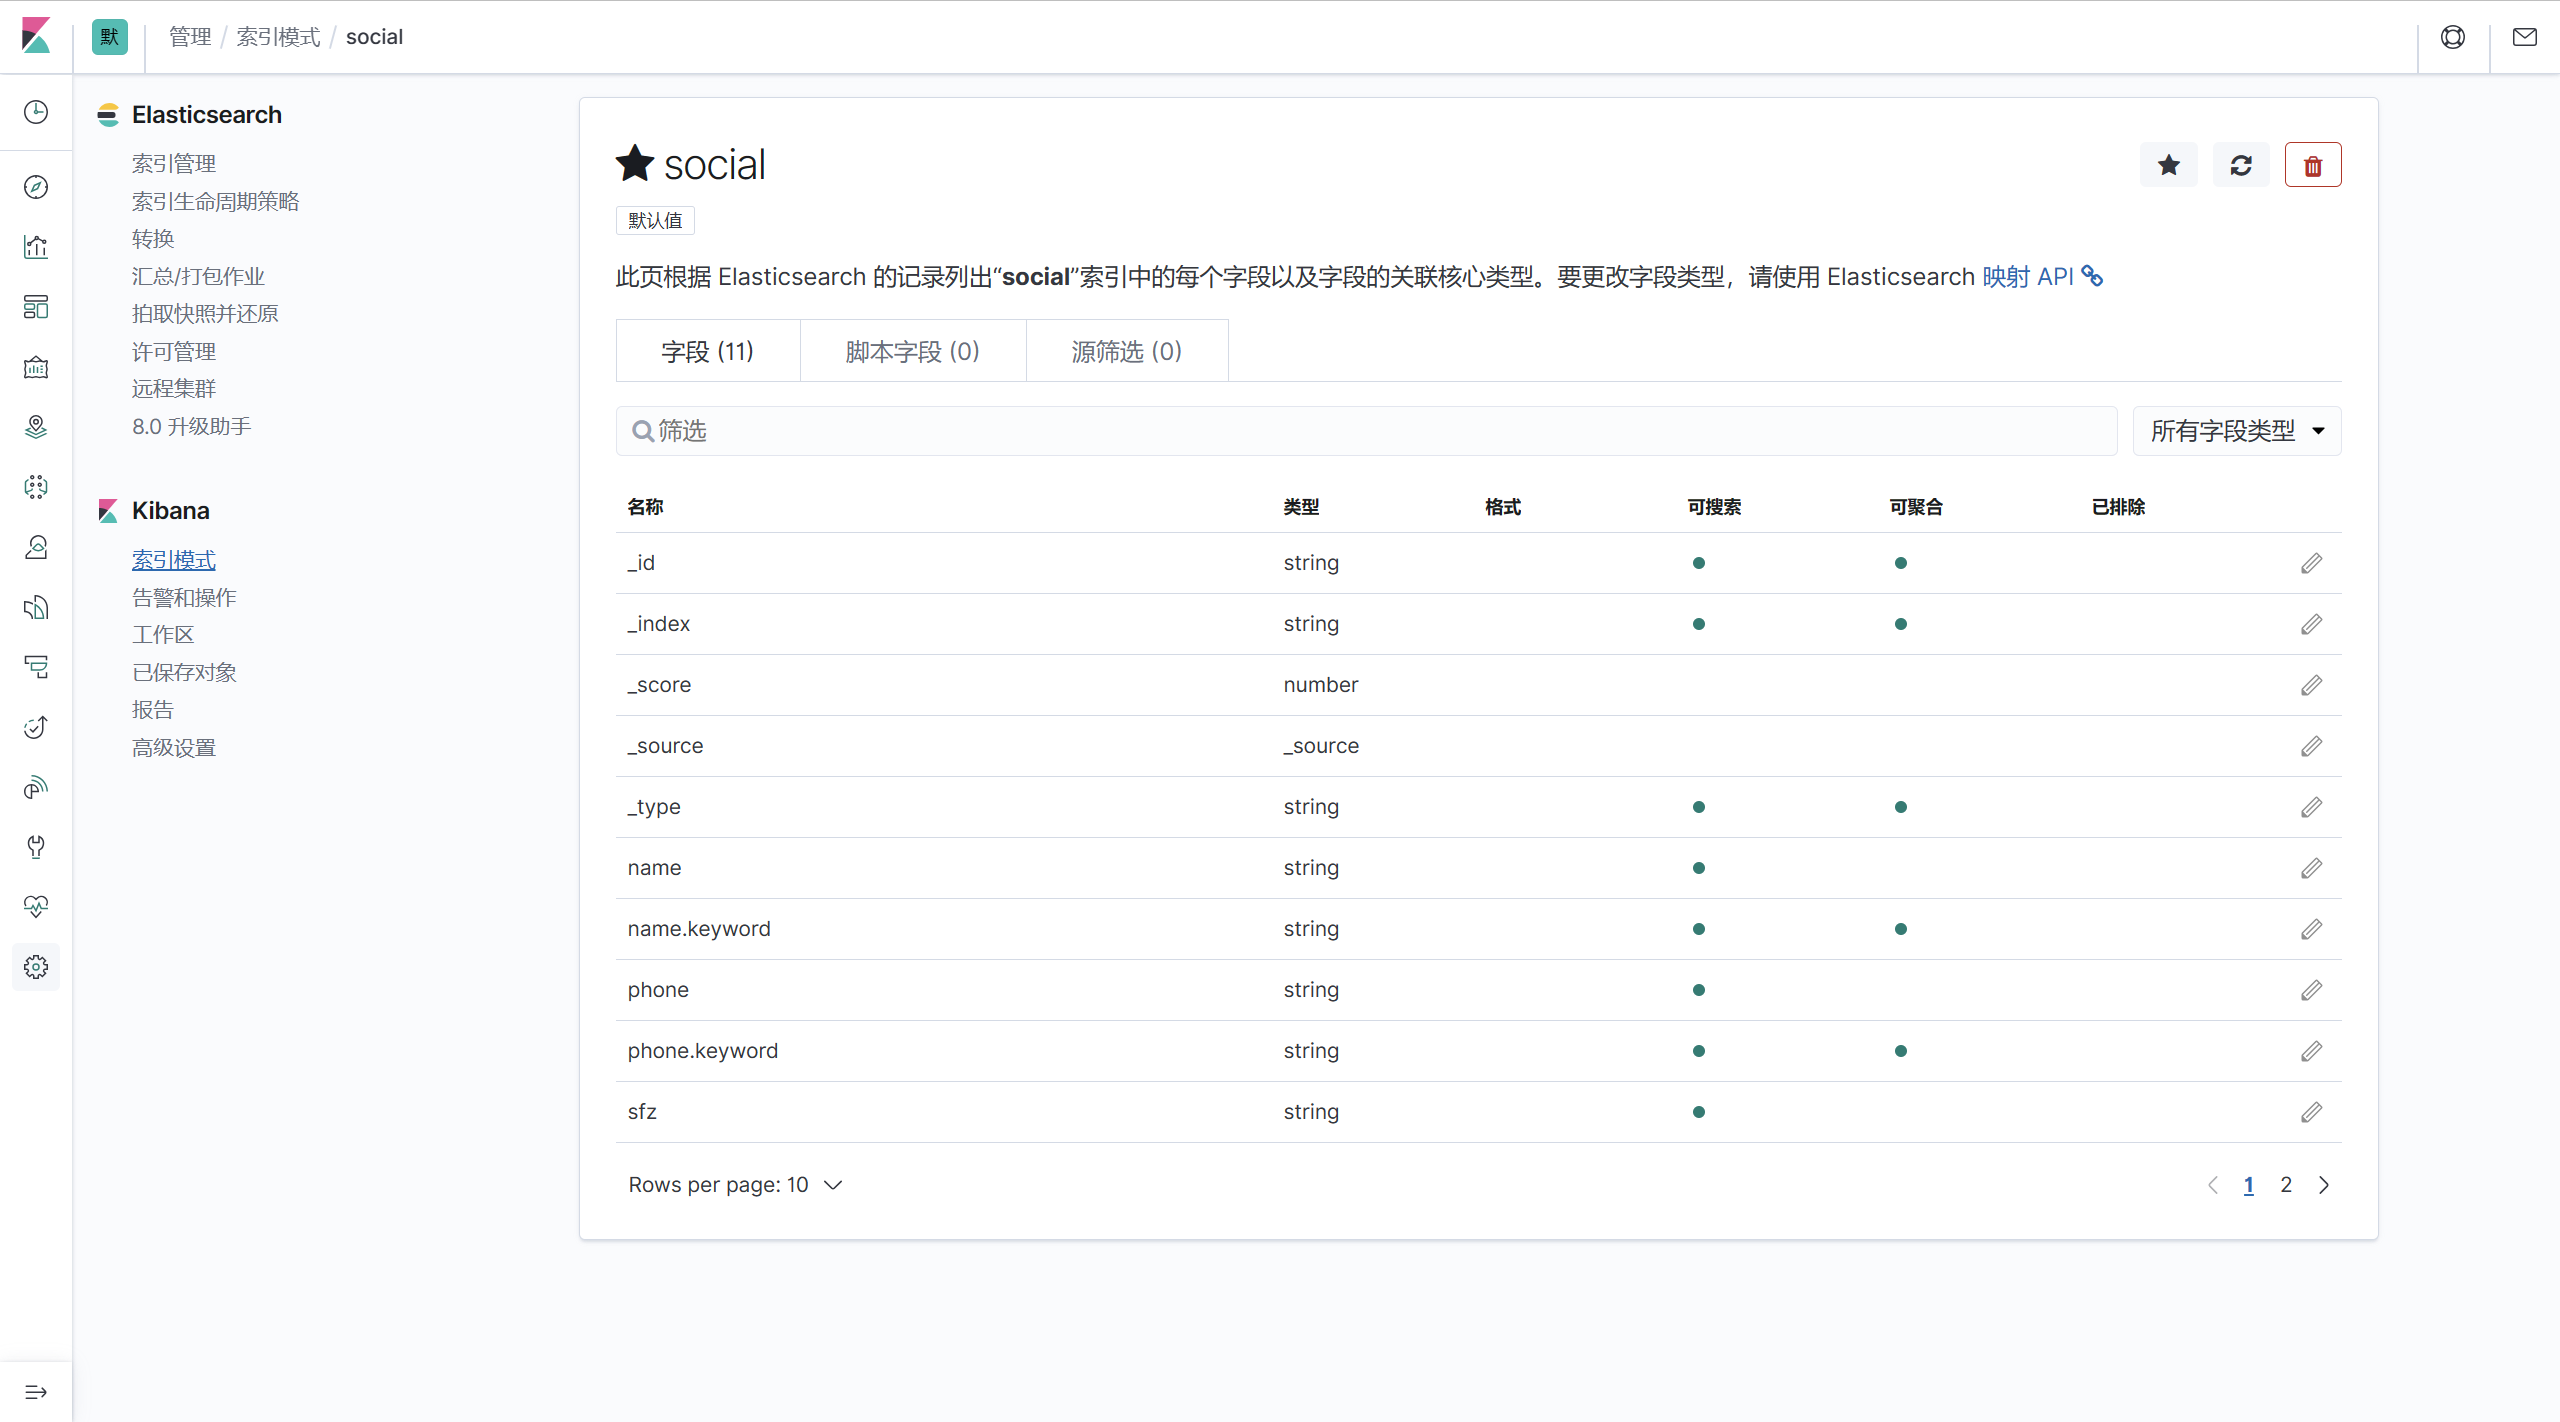
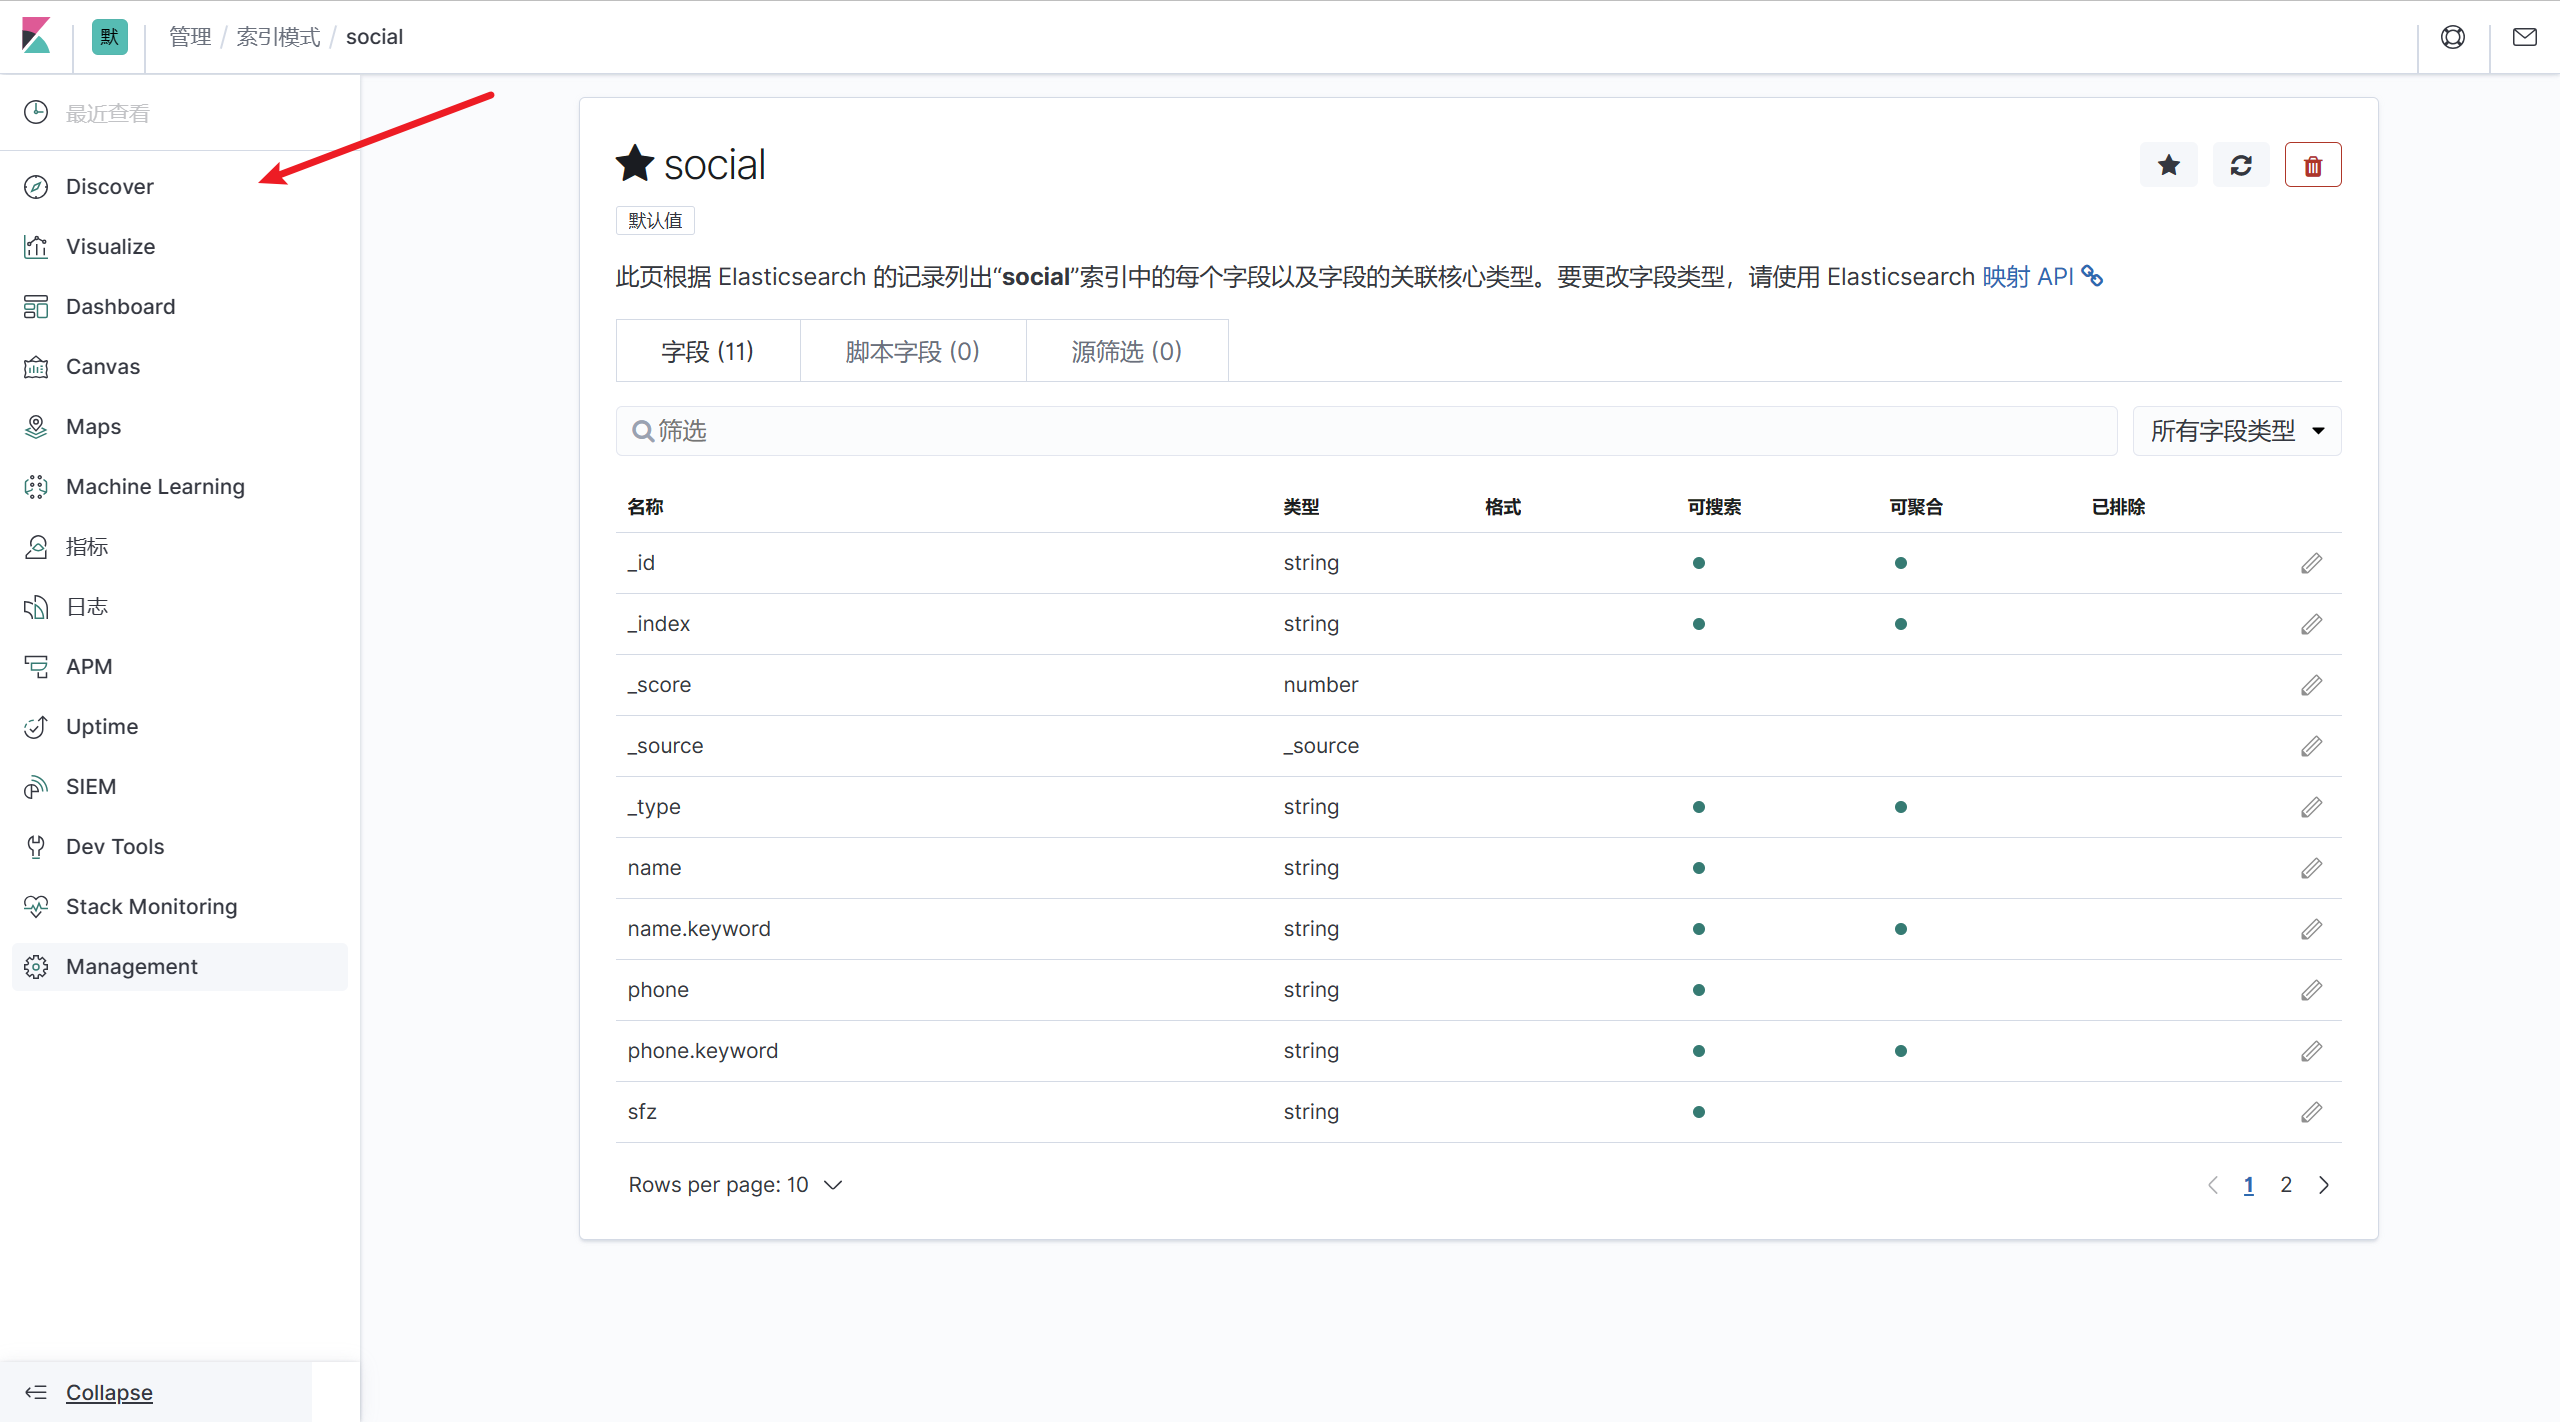
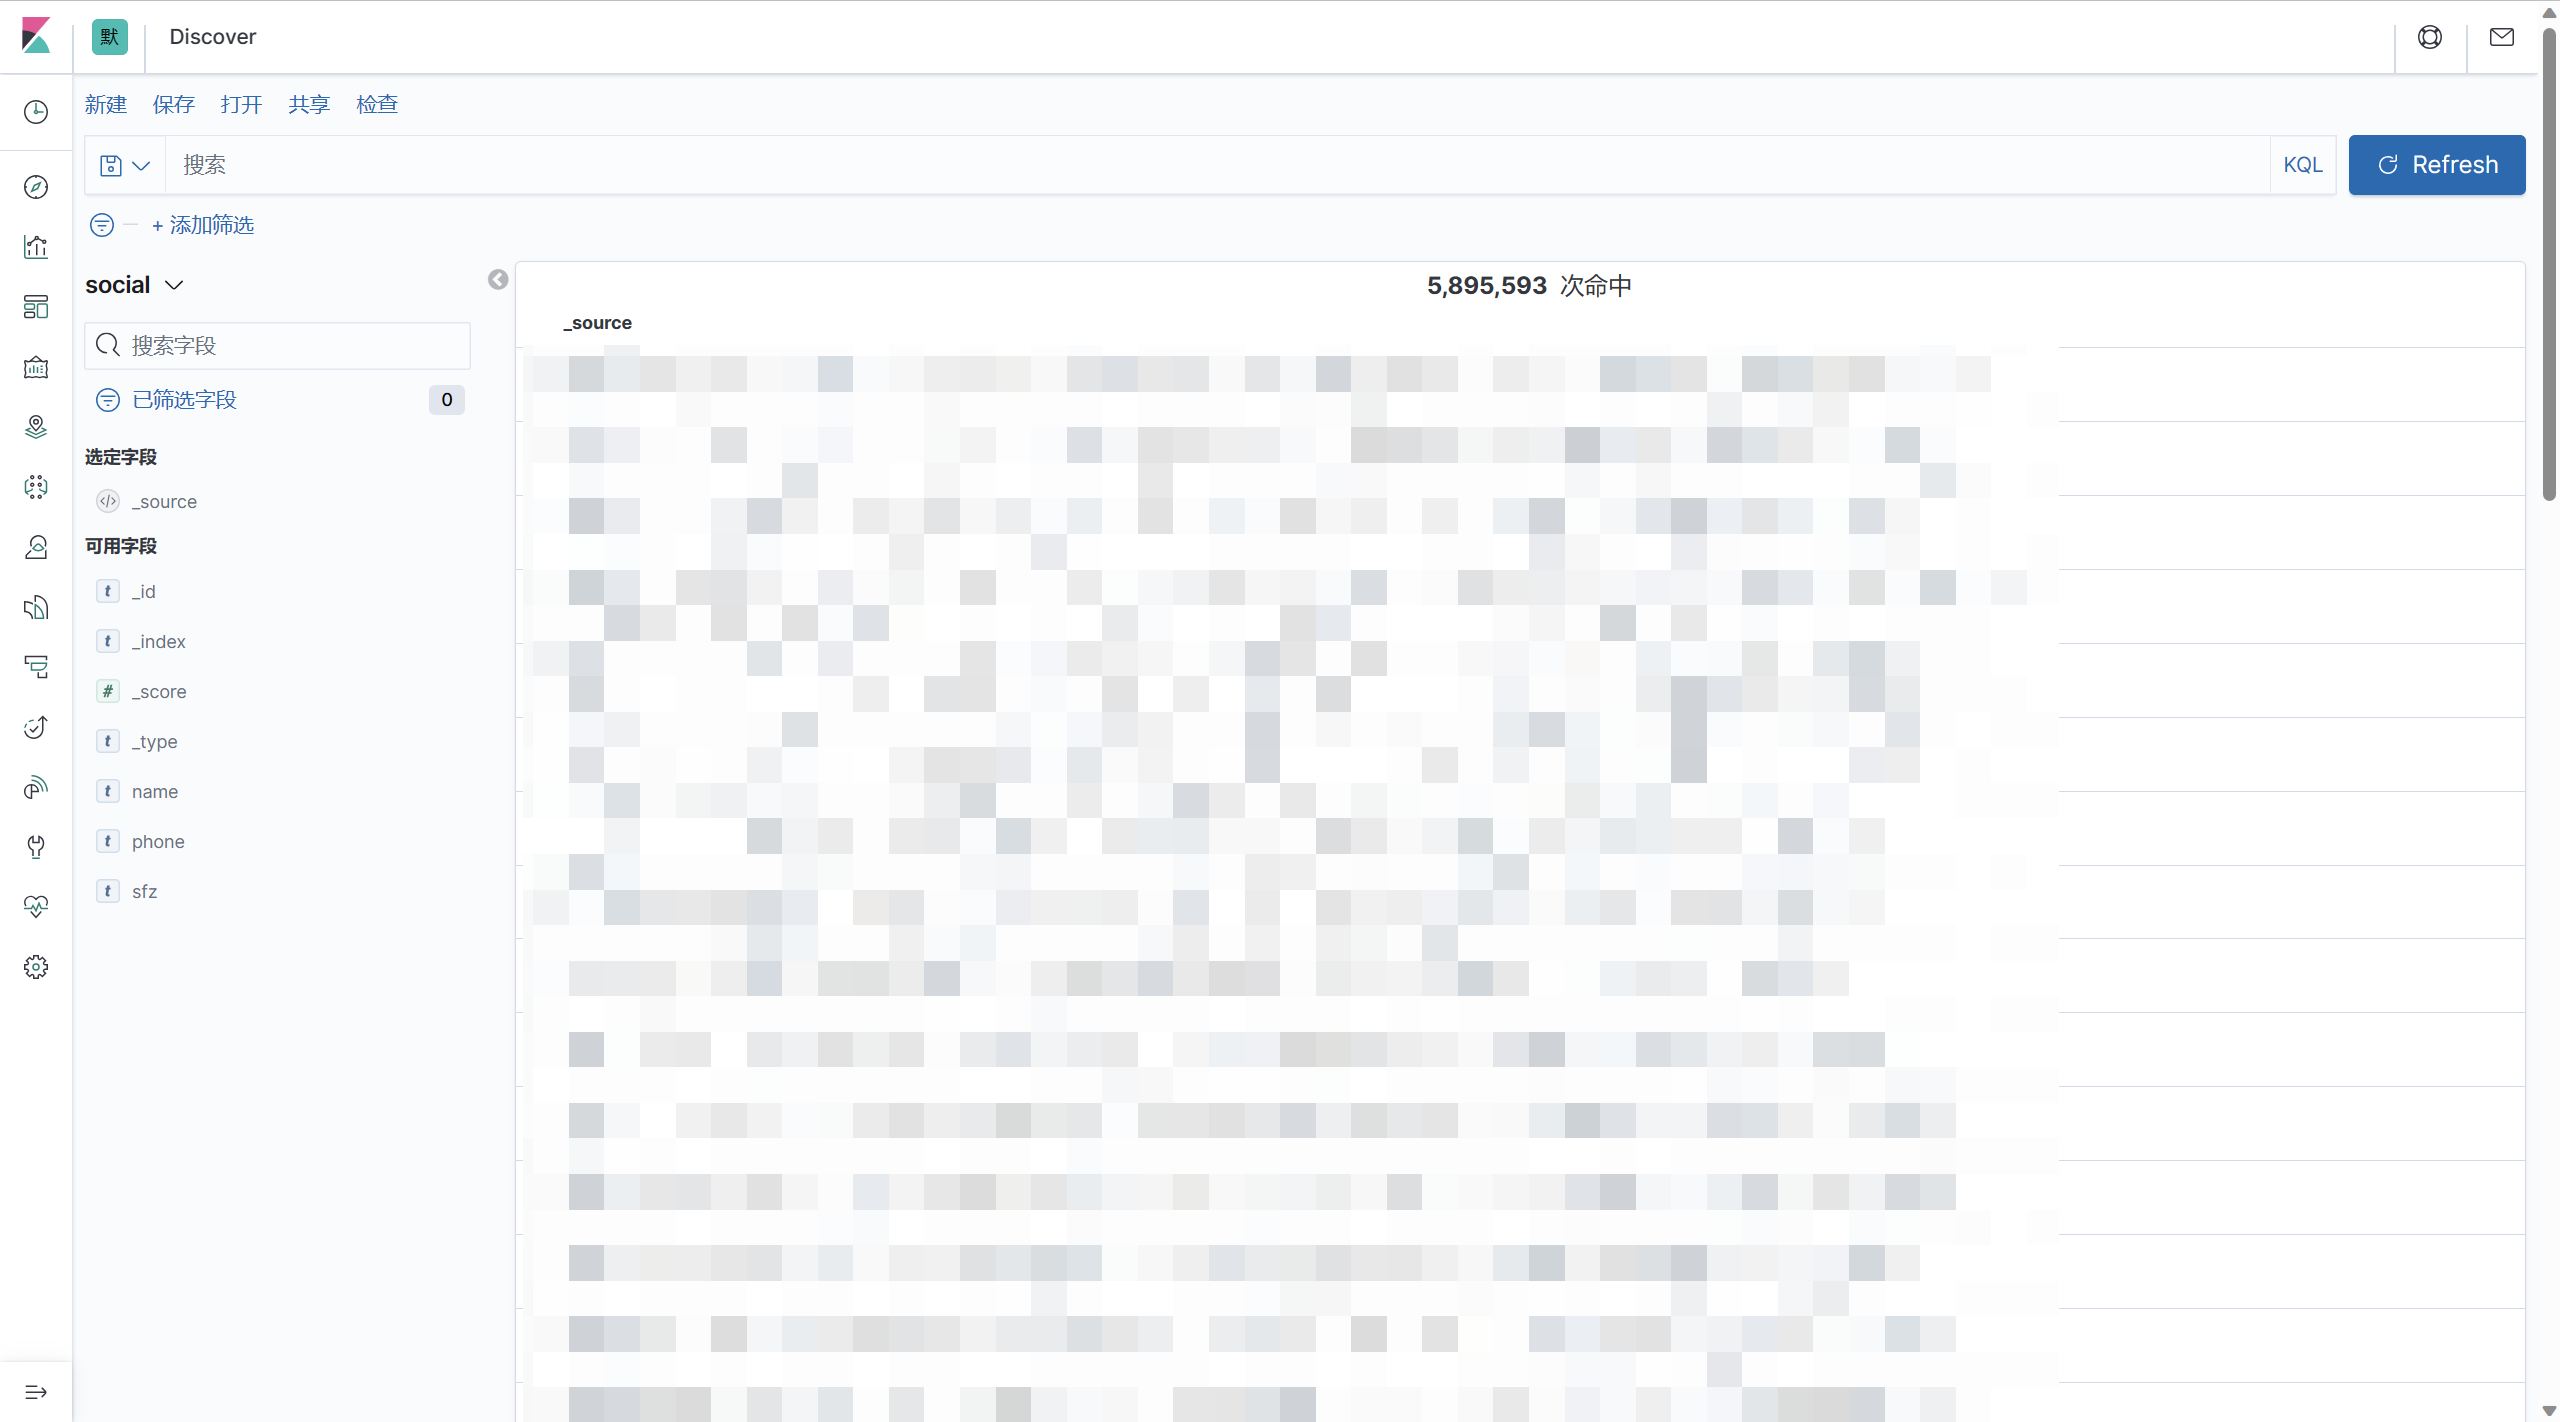
上线!
Tips
修改elasticsearch文件存储路径
停止需要迁移的节点,禁用分片(IP换成你自己的)
curl -XPUT 'http://127.0.0.1:9200/_cluster/settings?pretty' -H 'Content-Type:application/json' -d '{"transient":{"cluster.routing.allocation.enable": "none"}}'
查看分片是否禁用 (IP换成你自己的):
curl -XGET '127.0.0.1:9200/_cluster/settings?pretty'
停止实例
systemctl stop elasticsearch
创建数据目录(使用你自己的新的目录 磁盘空间大的)
mkdir -p /home/soft/elasticsearch/data
mkdir -p /home/soft/elasticsearch/logs
复制原数据到新目录
cp -r /var/lib/elasticsearch/nodes/ /home/soft/elasticsearch/data/
授权为es用户
chown -R elasticsearch:elasticsearch /home/soft/elasticsearch/data/
chown -R elasticsearch:elasticsearch /home/soft/elasticsearch/logs/
修改es配置文件
vim /etc/elasticsearch/elasticsearch.yml
path.data: /home/soft/elasticsearch/data
path.logs: /home/soft/elasticsearch/logs
启动服务
systemctl start elasticsearch
启用分片分配
curl -XPUT 'http://127.0.0.1:9200/_cluster/settings?pretty' -H 'Content-Type:application/json' -d '{"transient":{"cluster.routing.allocation.enable": "all"}}'
Logstash could not be started because there is already another instance using the configured data directory
systemctl stop logstash
ps -ef | grep logstash
kill -9 [pid]
systemctl start logstash
或者(未尝试)


 3677
3677

 被折叠的 条评论
为什么被折叠?
被折叠的 条评论
为什么被折叠?
 到【灌水乐园】发言


