


const option2 = computed(() => {
const defaultOption = {
// title: {
// text: 'Stacked Area Chart',
// },
tooltip: {
trigger: 'axis',
axisPointer: {
type: 'cross',
label: {
backgroundColor: '#6a7985',
},
},
},
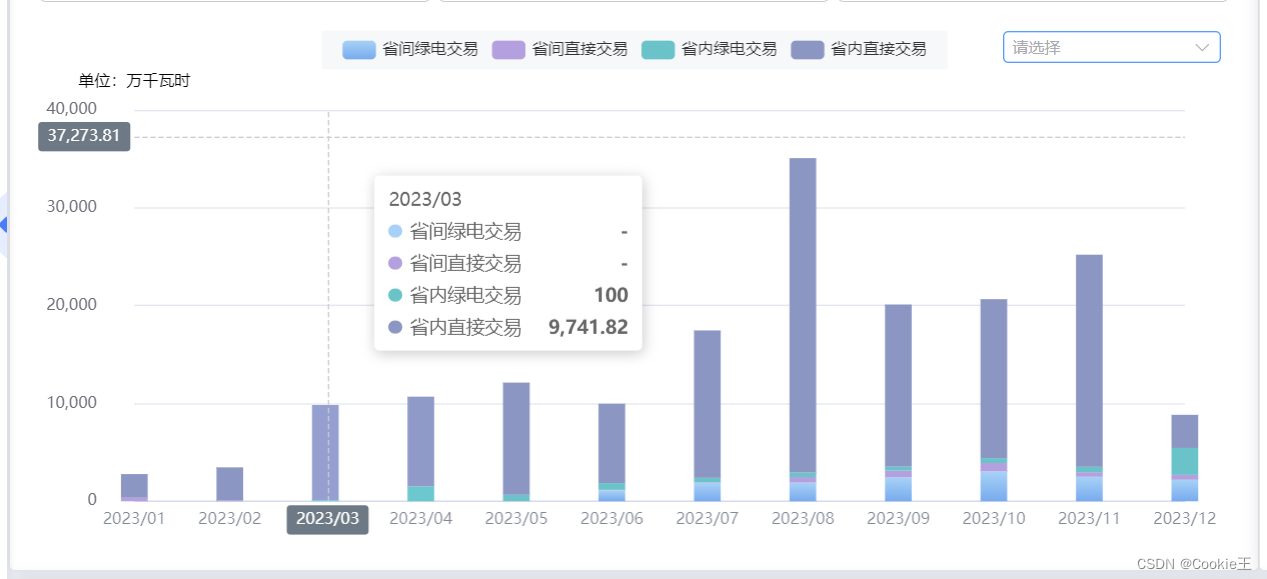
legend: {
data: ['省间绿电交易', '省间直接交易', '省内绿电交易', '省内直接交易'],
},
// toolbox: {
// feature: {
// saveAsImage: {},
// },
// },
grid: {
left: '3%',
right: '4%',
bottom: '3%',
containLabel: true,
},
xAxis: [
{
type: 'category',
boundaryGap: false,
data: datetimeXlist.value,
},
],
yAxis: [
{
type: 'value',
name: '单位:万千瓦时',
axisLine: {
lineStyle: {
color: '#000',
},
},
axisLabel: {
padding: [0, 20, 0, 0], // 设置上、右、下、左四个方向的内边距
},
},
],
series: [
{
name: '省间绿电交易',
type: 'bar',
stack: 'Total',
barWidth: '20',
areaStyle: {},
emphasis: {
focus: 'series',
},
data: sjgreenData.value,
},
{
name: '省间直接交易',
type: 'bar',
stack: 'Total',
barWidth: '30',
areaStyle: {},
emphasis: {
focus: 'series',
},
data: shjDirectdata.value,
},
{
name: '省内绿电交易',
type: 'bar',
stack: 'Total',
barWidth: '30',
areaStyle: {},
emphasis: {
focus: 'series',
},
data: shnGreendata.value,
},
{
name: '省内直接交易',
type: 'bar',
stack: 'Total',
barWidth: '30',
areaStyle: {},
emphasis: {
focus: 'series',
},
data: shnDirectdata.value,
},
],
};
return defaultOption;
});记得给容器加个宽度和高度 宽度:100%, 高度 40vh


 1万+
1万+


 被折叠的 条评论
为什么被折叠?
被折叠的 条评论
为什么被折叠?
 到【灌水乐园】发言


