


接上一篇文章【Kubernetes 1.5安装 kubernetes dashboard】http://blog.csdn.net/wenwst/article/details/54410012
安装Heapster
yaml文件来自于github。
创建yaml文件
grafana-deployment.yaml 中的image,先用下面命令下载到别一个节点上面。
docker pull gcr.io/google_containers/heapster_grafana:v3.1.1[root@localhost heapster]# cat grafana-deployment.yaml
apiVersion: extensions/v1beta1
kind: Deployment
metadata:
name: monitoring-grafana
namespace: kube-system
spec:
replicas: 1
template:
metadata:
labels:
task: monitoring
k8s-app: grafana
spec:
volumes:
- name: grafana-storage
emptyDir: {}
containers:
- name: grafana
image: gcr.io/google_containers/heapster_grafana:v3.1.1
ports:
- containerPort: 3000
protocol: TCP
volumeMounts:
- mountPath: /var
name: grafana-storage
env:
- name: INFLUXDB_HOST
value: monitoring-influxdb
- name: GRAFANA_PORT
value: "3000"
# The following env variables are required to make Grafana accessible via
# the kubernetes api-server proxy. On production clusters, we recommend
# removing these env variables, setup auth for grafana, and expose the grafana
# service using a LoadBalancer or a public IP.
- name: GF_AUTH_BASIC_ENABLED
value: "false"
- name: GF_AUTH_ANONYMOUS_ENABLED
value: "true"
- name: GF_AUTH_ANONYMOUS_ORG_ROLE
value: Admin
- name: GF_SERVER_ROOT_URL
# value: /api/v1/proxy/namespaces/kube-system/services/monitoring-grafana/
value: /
创建grafana-service.yaml
[root@localhost heapster]# cat grafana-service.yaml
apiVersion: v1
kind: Service
metadata:
  labels:
    # For use as a Cluster add-on (https://github.com/kubernetes/kubernetes/tree/master/cluster/addons)
    # If you are NOT using this as an addon, you should comment out this line.
    kubernetes.io/cluster-service: 'true'
    kubernetes.io/name: monitoring-grafana
  name: monitoring-grafana
  namespace: kube-system
spec:
  # In a production setup, we recommend accessing Grafana through an external Loadbalancer
  # or through a public IP.
  # type: LoadBalancer
  type: NodePort
  ports:
  - port: 80
    targetPort: 3000
  selector:
    k8s-app: grafana
创建influxdb-deployment.yaml文件
[root@localhost heapster]# cat influxdb-deployment.yaml
apiVersion: extensions/v1beta1
kind: Deployment
metadata:
  name: monitoring-influxdb
  namespace: kube-system
spec:
  replicas: 1
  template:
    metadata:
      labels:
        task: monitoring
        k8s-app: influxdb
    spec:
      volumes:
      - name: influxdb-storage
        emptyDir: {}
      containers:
      - name: influxdb
        image: kubernetes/heapster_influxdb:v0.6
        volumeMounts:
        - mountPath: /data
          name: influxdb-storage
创建influxdb-service.yaml 文件
[root@localhost heapster]# cat influxdb-service.yaml
apiVersion: v1
kind: Service
metadata:
  labels:
    task: monitoring
    # For use as a Cluster add-on (https://github.com/kubernetes/kubernetes/tree/master/cluster/addons)
    # If you are NOT using this as an addon, you should comment out this line.
    kubernetes.io/cluster-service: 'true'
    kubernetes.io/name: monitoring-influxdb
  name: monitoring-influxdb
  namespace: kube-system
spec:
  # type: NodePort
  ports:
  - name: api
    port: 8086
    targetPort: 8086
  selector:
    k8s-app: influxdb
创建 heapster-deployment.yaml 文件
[root@localhost heapster]# cat heapster-deployment.yaml
apiVersion: extensions/v1beta1
kind: Deployment
metadata:
  name: heapster
  namespace: kube-system
spec:
  replicas: 1
  template:
    metadata:
      labels:
        task: monitoring
        k8s-app: heapster
        version: v6
    spec:
      containers:
      - name: heapster
        image: kubernetes/heapster:canary
        imagePullPolicy: Always
        command:
        - /heapster
        - --source=kubernetes:https://kubernetes.default
        - --sink=influxdb:http://monitoring-influxdb:8086
创建 heapster-service.yaml 文件
[root@localhost heapster]# cat heapster-service.yaml
apiVersion: v1
kind: Service
metadata:
  labels:
    task: monitoring
    # For use as a Cluster add-on (https://github.com/kubernetes/kubernetes/tree/master/cluster/addons)
    # If you are NOT using this as an addon, you should comment out this line.
    kubernetes.io/cluster-service: 'true'
    kubernetes.io/name: Heapster
  name: heapster
  namespace: kube-system
spec:
  ports:
  - port: 80
    targetPort: 8082
  selector:
    k8s-app: heapster
下载镜像文件
先把下面三个镜像下载到所有的节点,再进行下一步。
gcr.io/google_containers/heapster_grafana:v3.1.1
kubernetes/heapster_influxdb:v0.6
kubernetes/heapster:canary
docker pull gcr.io/google_containers/heapster_grafana:v3.1.1
docker pull kubernetes/heapster_influxdb:v0.6
docker pull kubernetes/heapster:canary
如果无法下载,或下载太慢,请查看别一篇blog:
http://blog.csdn.net/wenwst/article/details/54582141
这里面的东西可能会有用处。
部署安装
刚才我们创建了六个文件,现在使用kubectl create 来创建。
kubectl create -f grafana-deployment.yaml -f grafana-service.yaml -f influxdb-deployment.yaml -f influxdb-service.yaml -f heapster-deployment.yaml -f heapster-service.yaml 创建完成后,使用命令
kubectl get pod --namespace=kube-system查看pod的安装情况。
 [root@localhost heapster]# kubectl get pod --namespace=kube-system
NAME                                    READY     STATUS    RESTARTS   AGE
dummy-2088944543-xjj21                  1/1       Running   0          2h
etcd-centos-master                      1/1       Running   0          2h
heapster-2193675300-j1jxn               1/1       Running   0          1h
kube-apiserver-centos-master            1/1       Running   0          2h
kube-controller-manager-centos-master   1/1       Running   0          2h
kube-discovery-1769846148-c45gd         1/1       Running   0          1h
kube-dns-2924299975-96xms               4/4       Running   0          1h
kube-proxy-33lsn                        1/1       Running   0          1h
kube-proxy-jnz6q                        1/1       Running   0          1h
kube-proxy-vfql2                        1/1       Running   0          1h
kube-scheduler-centos-master            1/1       Running   0          2h
kubernetes-dashboard-3000605155-8mxgz   1/1       Running   0          1h
monitoring-grafana-810108360-h92v7      1/1       Running   0          1h
monitoring-influxdb-3065341217-q2445    1/1       Running   0          1h
weave-net-k5tlz                         2/2       Running   0          1h
weave-net-q3n89                         2/2       Running   0          1h
weave-net-x57k7                         2/2       Running   0          1h
查看服务:
[root@localhost heapster]# kubectl get svc --namespace=kube-system
NAME                   CLUSTER-IP      EXTERNAL-IP   PORT(S)         AGE
heapster               10.98.45.1      <none>        80/TCP          1h
kube-dns               10.96.0.10      <none>        53/UDP,53/TCP   2h
kubernetes-dashboard   10.108.45.66    <nodes>       80:32155/TCP    1h
monitoring-grafana     10.97.110.225   <nodes>       80:30687/TCP    1h
monitoring-influxdb    10.96.175.67    <none>        8086/TCP        1h
查看grafana的详细信息:
[root@localhost heapster]# kubectl  --namespace=kube-system describe svc monitoring-grafana
Name:                   monitoring-grafana
Namespace:              kube-system
Labels:                 kubernetes.io/cluster-service=true
                        kubernetes.io/name=monitoring-grafana
Selector:               k8s-app=grafana
Type:                   NodePort
IP:                     10.97.110.225
Port:                   <unset> 80/TCP
NodePort:               <unset> 30687/TCP
Endpoints:              10.32.0.2:3000
Session Affinity:       None
No events.
看到开放端口为30687
通过节点IP加端口号访问:

点图标:
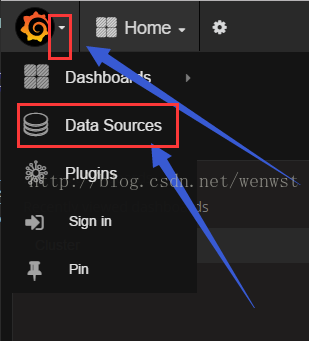
点默认;
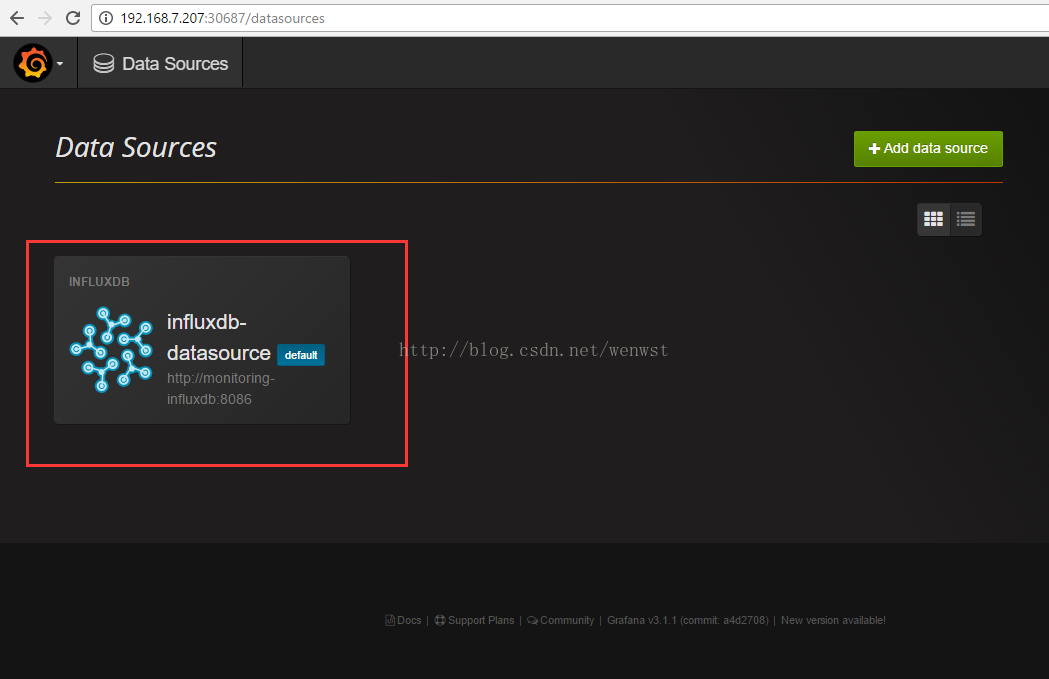
然后确认是k8s:
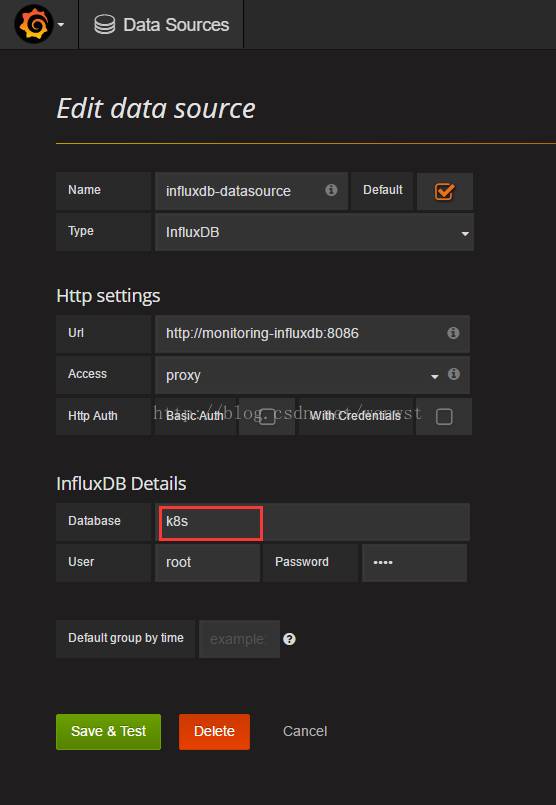
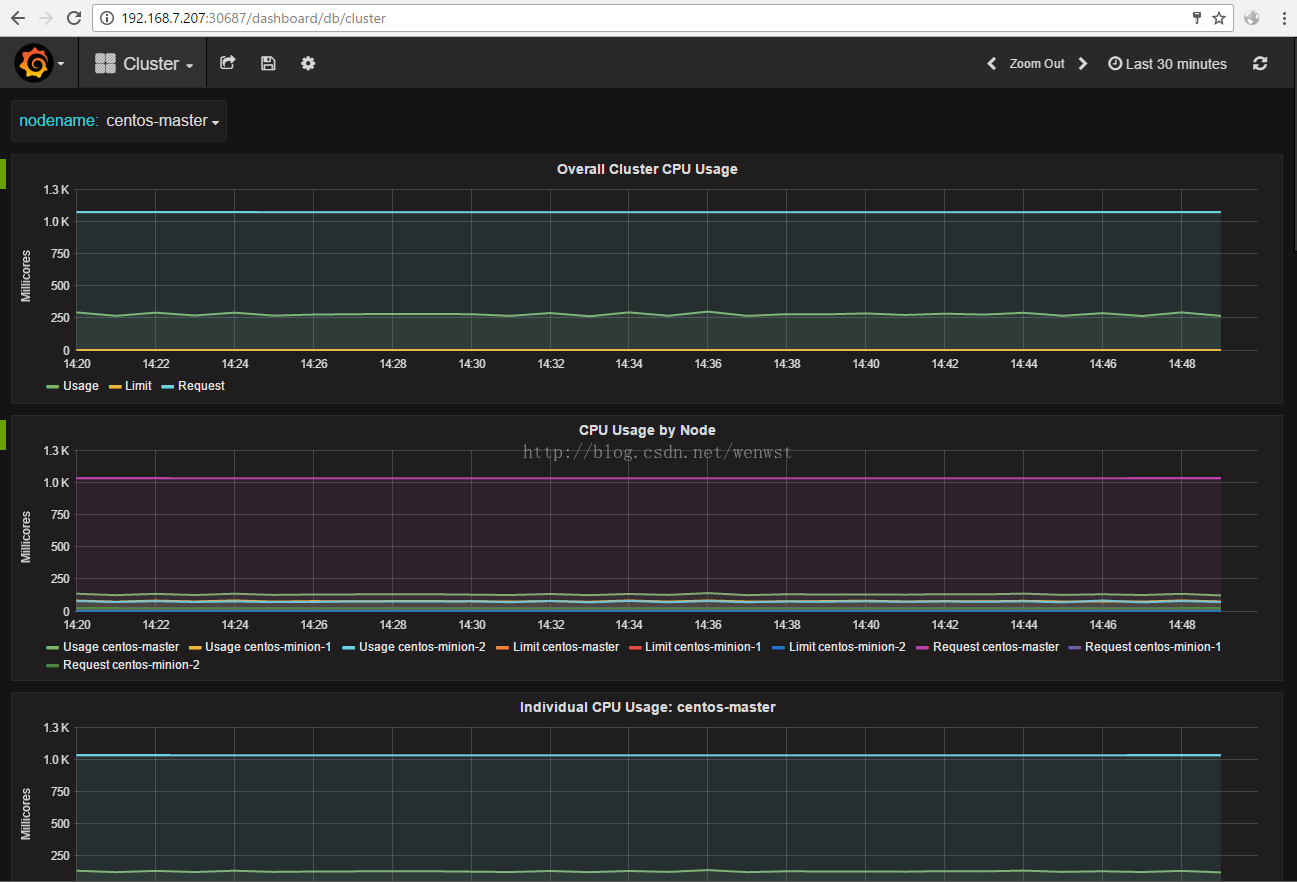
接下来:

查看图形:


 8032
8032

 被折叠的 条评论
为什么被折叠?
被折叠的 条评论
为什么被折叠?
 到【灌水乐园】发言


