


 文章探讨了Go语言中垃圾收集器(GC)的触发条件,主要关注gc_percent参数以及gctrace输出的解析。GC触发不仅与新分配的数据和存活数据的比例有关,还涉及到heapsize的变化。gctrace日志中的liveheap和goalheapsize并不严格保持2倍关系。此外,文章分析了GC日志中wall-clock和CPU时间的含义,以及可能存在的统计差异。
触发GC的时机是什么?我使用 gctrace 打印了 GC 的执行明细。我还了解到,是否需要 GC,触发的条件有两个参数来决定:gc_trigger 和 gcpercent。

关于 gcpercent,着重理解一下注释:a collection is triggered when the ratio of freshly allocated data to live data remaining after the previous collection reaches this percentage。新申请的数据和上次GC回收剩下的数据达到这个比例的时候触发。那100就是 100% 的意思喽,默认就是100。
// SetGCPercent sets the garbage collection target percentage:
// a collection is triggered when the ratio of freshly allocated data
// to live data remaining after the previous collection reaches this percentage.
// SetGCPercent returns the previous setting.
// The initial setting is the value of the GOGC environment variable
// at startup, or 100 if the variable is not set.
// A negative percentage disables garbage collection.
func SetGCPercent(percent int) int {
	return int(setGCPercent(int32(percent)))
}
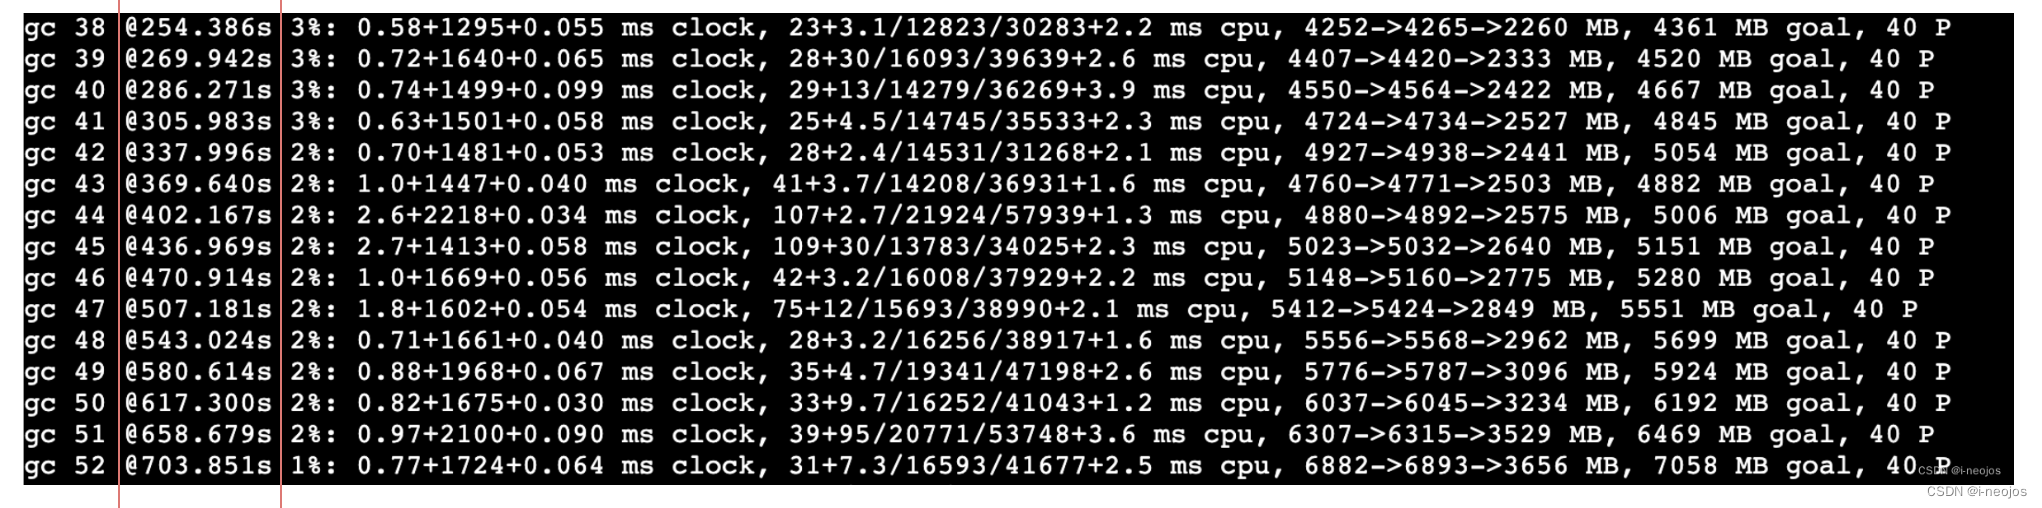
我们重新认识一下文章开头的 gctrace 日志,了解一下每列的具体含义,官方文档有详细的介绍。我们着重对比一下 live heap 和 goal heap size 这两个字段,理论上应该是 2 倍的关系(100 gcpercent),但实际结果是不精确的接近2倍。可能是哪里有错误的认识。
Currently, it is:
	gc # @#s #%: #+#+# ms clock, #+#/#/#+# ms cpu, #->#-># MB, # MB goal, # P
where the fields are as follows:
	gc #        the GC number, incremented at each GC
	@#s         time in seconds since program start
	#%          percentage of time spent in GC since program start
	#+...+#     wall-clock/CPU times for the phases of the GC
	#->#-># MB  heap size at GC start, at GC end, and live heap
	# MB goal   goal heap size
	# P         number of processors used
图中红色细线标注的是 GC 触发的时间,相邻两次 GC 的时间间隔并没有参考价值,相邻的时间间隔为15、17、19、42…说明这些 GC 并非主动触发,如果后台的常驻GC监控协程主动触发,时间间隔一定是基本固定的。但我也有怀疑,这样解释是否正确。
那 GC 有触发时机吗?我们看下面的两列数据,看解释 clock 和 cpu 只是统计的不同维度,要表示的含义是相同的。我们看官方对两列的解释说明:
The phases are stop-the-world (STW) sweep termination, concurrent mark and scan, and STW mark termination. The CPU times for mark/scan are broken down in to assist time (GC performed in line with allocation), background GC time, and idle GC time. If the line ends with “(forced)”, this GC was forced by a runtime.GC() call.
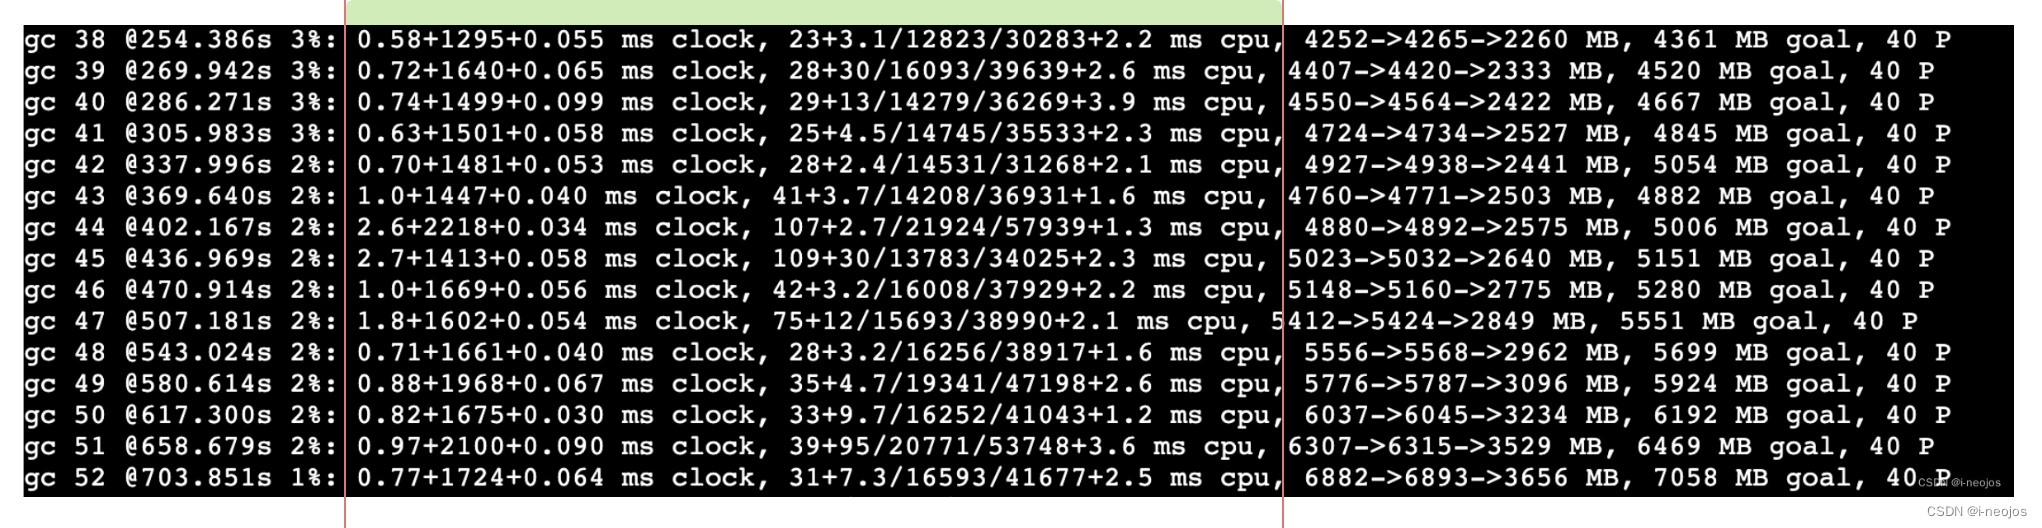
红线范围内两列的统计单位分别是 wall-clock 和 cpu time,wall 名词有墙壁的含义,表示现实世界的时间。cpu 表示 cpu 执行的时间。我们拿第一行数据来说明,wall-clock为0.58,cpu time 为23,当前机器是 4核8G,那么,现实世界的 0.58 ms,cpu 全部用来执行当前任务,统计耗时最多是 wall-clock 的4 倍 2.32ms,为什么 cpu 是 23 呢?
我猜测,这个 wall-clock 统计的是单个 P 的墙上时间,在列的末尾显示了当前存在 40 个 P。这样的统计也比较合理,Go 统计的是 Go 范围内的执行耗时,统计机器本身的 cpu 耗时意义也不大。接下来的关键是知道 wall/cpu time 内3个子项的具体统计含义。


 1208
1208

 被折叠的 条评论
为什么被折叠?
被折叠的 条评论
为什么被折叠?
 到【灌水乐园】发言


