


部分中文资料说notch是一个逻辑值,输出带凹口的箱型图
这中间忽略了无数过程。。。
根据查询的资料
从程序上,源自boxplot.stats
凹口的上下限为
stats[3L] + c(-1.58, 1.58) * iqr/sqrt(n)
在?boxplot中的detail也提到了该值 extend to +/-1.58 IQR/sqrt(n)
从?boxplot所引用的论文中
McGill, R., Tukey, J. W. and Larsen, W. A. (1978). Variations of box plots. The American Statistician, 32, 12–16. doi: 10.2307/2683468.
中对于该值的描述是,文中还解释了1.7的取值原因是因为为了使置信区间达到95%,本应取值1.96,但是当两样本标准差几乎相等时应取1.386,所以根据经验取了个1.7(empirically selected as preferabl)
Chambers, J. M., Cleveland, W. S., Kleiner, B. and Tukey, P. A. (1983). Graphical Methods for Data Analysis. Wadsworth & Brooks/Cole.
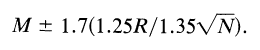
中对该值的描述是
![]()
这两篇论文没有详细看。在后一篇论文中提到一句
if the notches for two boxes do not overlap, we can regard it as strong evidence that a similar difference in levels would be seen in other sets of data collected under similar circumstances.
翻译过来就是,两个notch区间没有重叠的话,就可以证明该实验数据可以在相似条件的下再次收集到


 429
429


 被折叠的 条评论
为什么被折叠?
被折叠的 条评论
为什么被折叠?
 到【灌水乐园】发言


