


布局系统
布局系统负责定位和缩放布局元素,如QCustomPlot中的轴矩形、图例或颜色尺度。
类和机制
布局系统基于抽象基类QCPLayoutElement。所有参与布局系统的对象都直接或间接地从这个类派生。
由于QCPLayoutElement本身源自QCPLayerable,所以布局元素可以绘制自己的内容。然而,布局元素完全有可能只作为一个结构和/或定位元素,而不是自己绘制任何东西。
布局元素的矩形
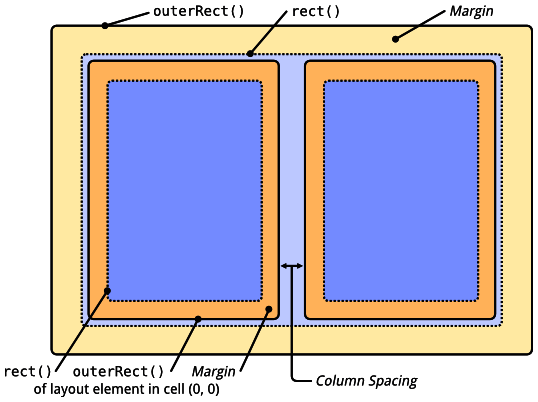
布局元素是一个矩形对象,由两个矩形描述:内部矩形(QCPLayoutElement::rect)和外部矩形(QCPLayoutElement::setOuterRect)。内部矩形通过外部矩形向内应用边距(QCPLayoutElement::setMargins)自动计算。内部矩形用于主要内容,而边距区域可以留空或用于显示外围图形。例如,QCPAxisRect将四个主要的轴定位在内部矩形的两侧,因此图形最终在内部矩形中结束,而轴标签和标记标签位于边距区域。
边际
每个布局元素都可以提供一种自动确定其边距的机制。在内部,这是通过QCPLayoutElement::calculateAutoMargin函数实现的,该函数接受QCP:: margin并返回一个代表指定边的理想margin的整数值。自动边距将用于QCPLayoutElement::setAutoMargins中指定的边距。缺省情况下,设置为QCP::msAll。含义自动进行四面裕度计算。在这种情况下,可以使用QCPLayoutElement::setMinimumMargins设置最小边距,以防止自动边距机制在特定情况下将边距设置得比期望的小。如果自动裕度计算没有设置在特定边,可以通过QCPLayoutElement::setMargins直接控制该边的裕度。
如果多个布局排列在彼此的旁边或下面,则可能需要在某些方面对齐它们的内部矩形。因为它们都可能有不同的自动边距,所以通常不是这样的。类QCPMarginGroup和QCPLayoutElement::setMarginGroup通过允许同步多个边距来解决这个问题。有关详细信息,请参阅那里的文档。
布局
如前所述,QCPLayoutElement可以有任意数量的子布局元素,原则上只能用于管理/安排这些子元素。这就是子类QCPLayout专门从事的工作。它本身是一个QCPLayoutElement,但没有可视表示。它定义了一个添加、删除和管理子布局元素的接口。QCPLayout不是一个可用的布局,它是一个抽象基类,具体的布局派生自,像QCPLayoutGrid,它在网格中安排它的子元素和QCPLayoutInset,它允许在其矩形内自由放置子元素。
由于QCPLayout本身是一个布局元素,所以可以将其放置在其他布局中。通过这种方式,可以创建复杂的层次结构,提供非常灵活的安排。
下面是一个可以通过QCustomPlot::plotLayout访问的默认QCPLayoutGrid的草图。它显示了两个子布局元素是如何在网格布局中的单元格(0,0)和(0,1)中相邻放置的。
顶层布局
每个QCustomPlot有型的一个顶层布局QCPLayoutGrid。它可以通过QCustomPlot :: plotLayout访问,并且包含(直接或间接地通过其他子布局)QCustomPlot中的所有布局元素。默认情况下,此顶层网格布局包含一个包含主轴矩形的单元格。
例子
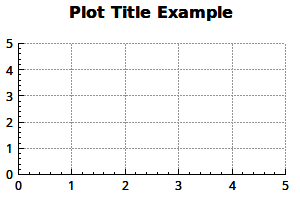
添加地块标题是一个典型且简单的案例,用于演示布局系统的基本工作原理。
|
  // first we create and prepare a text layout element:
  QCPTextElement *title = new QCPTextElement(customPlot);
  title->setText("Plot Title Example");
  title->setFont(QFont("sans", 12, QFont::Bold));
  // then we add it to the main plot layout:
  customPlot->plotLayout()->insertRow(0); // insert an empty row above the axis rect
  customPlot->plotLayout()->addElement(0, 0, title); // place the title in the empty cell we've just created
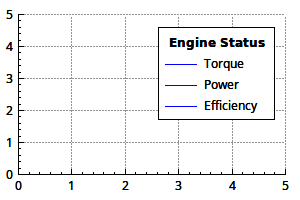
将自定义元素添加到图例非常简单,因为QCPLegend本身只是QCPLayoutGrid的子类。因此,我们可以像以前一样处理主图布局:
|
 // prepare legend and some graphs:
  customPlot->legend->setVisible(true);
  customPlot->addGraph()->setName("Torque");
  customPlot->addGraph()->setName("Power");
  customPlot->addGraph()->setName("Efficiency");
  // create and prepare a text layout element:
  QCPTextElement *legendTitle = new QCPTextElement(customPlot);
  legendTitle->setLayer(customPlot->legend->layer()); // place text element on same layer as legend, or it ends up below legend
  legendTitle->setText("Engine Status");
  legendTitle->setFont(QFont("sans", 9, QFont::Bold));
  // then we add it to the QCPLegend (which is a subclass of QCPLayoutGrid):
  if (customPlot->legend->hasElement(0, 0)) // if top cell isn't empty, insert an empty row at top
    customPlot->legend->insertRow(0);
  customPlot->legend->addElement(0, 0, legendTitle); // place the text element into the empty cell
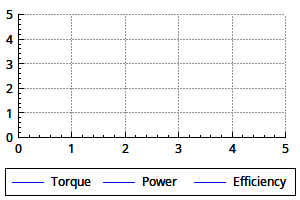
可以将图例移动到轴rect之外,方法如下:
|
// prepare some graphs:
  customPlot->legend->setVisible(true);
  customPlot->addGraph()->setName("Torque");
  customPlot->addGraph()->setName("Power");
  customPlot->addGraph()->setName("Efficiency");
  // now we move the legend from the inset layout of the axis rect into the main grid layout.
  // We create a sub layout so we can generate a small gap between the plot layout cell border
  // and the legend border:
  QCPLayoutGrid *subLayout = new QCPLayoutGrid;
  customPlot->plotLayout()->addElement(1, 0, subLayout);
  subLayout->setMargins(QMargins(5, 0, 5, 5));
  subLayout->addElement(0, 0, customPlot->legend);
  // change the fill order of the legend, so it's filled left to right in columns:
  customPlot->legend->setFillOrder(QCPLegend::foColumnsFirst);
  // set legend's row stretch factor very small so it ends up with minimum height:
  customPlot->plotLayout()->setRowStretchFactor(1, 0.001);
布置多轴矩形实际上是布局系统的主要目的。
|
 customPlot->plotLayout()->clear(); // let's start from scratch and remove the default axis rect
  // add the first axis rect in second row (row index 1):
  QCPAxisRect *bottomAxisRect = new QCPAxisRect(customPlot);
  customPlot->plotLayout()->addElement(1, 0, bottomAxisRect);
  // create a sub layout that we'll place in first row:
  QCPLayoutGrid *subLayout = new QCPLayoutGrid;
  customPlot->plotLayout()->addElement(0, 0, subLayout);
  // add two axis rects in the sub layout next to each other:
  QCPAxisRect *leftAxisRect = new QCPAxisRect(customPlot);
  QCPAxisRect *rightAxisRect = new QCPAxisRect(customPlot);
  subLayout->addElement(0, 0, leftAxisRect);
  subLayout->addElement(0, 1, rightAxisRect);
  subLayout->setColumnStretchFactor(0, 3); // left axis rect shall have 60% of width
  subLayout->setColumnStretchFactor(1, 2); // right one only 40% (3:2 = 60:40)
  // since we've created the axis rects and axes from scratch, we need to place them on
  // according layers, if we don't want the grid to be drawn above the axes etc.
  // place the axis on "axes" layer and grids on the "grid" layer, which is below "axes":
  QList<QCPAxis*> allAxes;
  allAxes << bottomAxisRect->axes() << leftAxisRect->axes() << rightAxisRect->axes();
  foreach (QCPAxis *axis, allAxes)
  {
    axis->setLayer("axes");
    axis->grid()->setLayer("grid");
  }


 7533
7533


 被折叠的 条评论
为什么被折叠?
被折叠的 条评论
为什么被折叠?
 到【灌水乐园】发言


